 Duplex
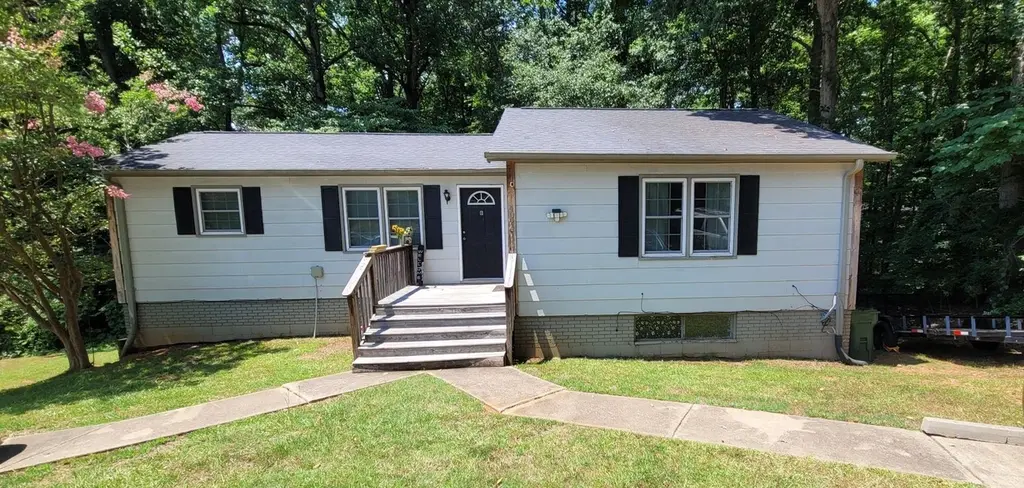
4024 Pebblebrook ct Ct Unit *** · Spartanburg, SC
Flood risk 1/10 · Minimal
- FEMA flood zone
- X (unshaded)
- Chance of flooding over 30 yrs
- 0.0%
- Est. flood insurance / yr
- $473 – $860
Fire risk 3/10 · Minor
- Est. fire insurance / yr
- $783 – $1,453
Heat risk 6/10 · Moderate
- Hot days now (above 105°F)
- 7 days/yr
- Hot days in 30 yrs
- 16 days/yr
Wind risk 2/10 · Minimal
- Chance of severe wind over 30 yrs
- 2.0%
Air-quality risk 4/10 · Minor
- Unhealthy air days now
- 4 days/yr
- Unhealthy air days in 30 yrs
- 5 days/yr
Risk factors via First Street. Map © Google.
Why this score? — see what drove the C grade
The composite is a weighted blend of 9 inputs, each scored 0–100. Each bar is that input's sub-score; the figure is the points it added to the 100-point composite (weight × sub-score).
- Cash flow +24.6/30.0
- DSCR +8.0/10.0
- ARV discount +7.5/15.0
- 1% rule +5.8/10.0
- Livability +3.8/5.0
- Schools +3.2/10.0
- Condition / age +2.5/5.0
- Rent growth +1.8/5.0
- Appreciation +0.0/10.0
$277,900
🖨 Deal sheet (PDF) 📄 Offer letter ✓ Due diligence
Multi-family units
County records classify this as Multi-Family (2-4 Unit). Listing-text estimate: 2 units. confirmed
Listing remarks MLS
Bring your Investors to check out this great investment opportunity. Duplex is located at the end of Pebble Brook Ct. with limited to no traffic.
Key facts
- 0.54 acre lot
- Built 1983
- Listed 369 days
Property features AI
Finance
- Financial info: Annual property tax approximately $2,538
Exterior
- Home design: Duplex residential income property
- Exterior features: Lot approximately 0.54 acres
Interior
- Interior features: Two levels
Neighborhood map
What this means for you Summary
Snapshot
- This is a 2 × 2.0-bed/1.5-bath units multifamily listed at $278k.
Deal economics
- At list price, monthly cash flow is $576 ($7k/yr) — positive. Per door: $288/mo.
- The deal already cash-flows at list — no discount required.
- Meets the 1% rule at list price ($3k rent vs $278k).
- Recommended offer: $245k (12.0% below list) — sets the bar for market timing.
- Cap rate 8.8% vs local median 3.9% in Spartanburg — top-decile yield for the area; either an underpriced asset or a hidden risk that comps aren't pricing in. Stress-test before assuming the spread holds.
Location & tenants
- Location reads 76/100 on livability (#24 in SC, #3,679 nationally) — a middle-class / working-renter tenant base. Strengths: amenities A+, commute A+, cost of living A+; Watch: crime F, employment F.
- Spartanburg 06 (suburban): math 33% / reading 42% proficiency, ranked #35 of 80 in SC (top 44%) — families likely to look elsewhere, expect single-tenant / working-renter base with shorter leases.
- Zoned schools: Anderson Mill Elementary (math 52% / reading 48%, grade D+, #163 of 597 statewide, top 28%, 651 students, 64% FRL); R. P. Dawkins Middle (math 38% / reading 44%, grade F, #72 of 229 statewide, top 32%, 862 students, 76% FRL); Dorman High (math 46% / reading 78%, grade B-, #99 of 196 statewide, top 53%, 3,808 students, 75% FRL) — zoned schools average 72% FRL vs 48% district-wide (23 pts higher); higher-poverty schools than district average — tighter screening recommended.
- Zoned-school proficiency averages 51% at this address vs 38% district-wide (+14 pts) — the actual schools serving this property are materially stronger than the Spartanburg 06 average implies; a family-tenant draw the district grade alone would hide.
- Market conditions: Rents soft (-2.6%/yr); 465 active listings in the ZIP; 9 comparable units currently listed for rent nearby; rentals at typical pace (median 16d on market — plan ~3-4 weeks tenant-placement turnaround); 3,129 units permitted in Spartanburg County in 2024 (40 in 5+ unit buildings).
- At $2,994/mo this rent would consume 62% of the median local household income ($58k/yr) (locally 1331% of renters already pay >50% of income on rent) — very limited rent-growth headroom before tenants either downsize or default.
Forward outlook
- Local home prices are declining (-3.0%/yr); year-one equity from $2k of loan paydown is wiped out by about $8k of value loss. Plan a longer hold.
- Spartanburg County population projected at +18% by 2050 — long-run rental-demand tailwind backs the buy-and-hold thesis.
Negotiation context
- It's been on market 369 days — a 12% lower offer ($245k) is reasonable based on typical stale-listing flexibility.
- 5 sale attempts since 24y ago with the ask held roughly flat each time — persistent listings suggest the price (not the market) is what's stuck; bring a comps-based counter.
- Current owner paid $50k; list at $278k implies a 461% gain — meaningful room to come down on a strong offer.
Risks & watch-outs
- Climate carrying-cost: extreme-heat days projected 7→16/yr by 2055 (HVAC capex compounding) — expect insurance premiums to compound above CPI over the hold.
Questions for the listing agent
- It's been on market 369 days. Have you received any prior offers? Is the seller open to a 12% concession, seller financing, or rate buy-down credit?
- Can we see the unit-by-unit rent roll, current vacancy, and any below-market leases? What's the average tenancy length?
- What capital expenditures (roof, boiler, parking lot, exteriors) have been made in the last 5 years, and what's planned in the next 2?
- Why hasn't it sold? Are there any deal-killer items the seller is aware of (foundation, flood, title, zoning, code violations)?
- Is there a deadline driving the sale (1031 exchange, divorce, estate, relocation)? That informs how much negotiation room exists.
- Schools are D-rated, which usually means shorter tenancies and higher turnover. Who's the typical renter profile here, and what's been the actual vacancy rate?
- Crime grade is F in this area — have there been break-ins, vandalism, or insurance claims at this property in the last 3 years? What carrier currently insures it and at what premium?
- What's the average days-on-market for RENTAL listings here right now (not sales)? A rising rental-DOM trend means longer vacancies and softer asking-rent achievability than the comps imply.
- What's the recent tenant-quality profile in this submarket — average credit score on applications, eviction rate, late-payment / NSF rate, and stable-employment percentage? A property-management company in the area should have these aggregated.
- How much new apartment / multifamily construction is in the pipeline within 1–3 miles? Heavy new supply (>2% of stock underway) typically softens rents 12–24 months out; light construction supports rent growth.
Investment metrics
- 1% rule
- 1.08% ✓
- Cap rate
- 8.78%
- Cash-on-cash
- 8.88%
- DSCR
- 1.40
- GRM
- 7.7
CMA / ARV
- ARV (on-the-fly)
- $277,760
- Comps found
- 2
Show comp detail 2 sales within ~0.75 mi
| Address | Dist | Beds/Ba | Sqft | Sold | Price | $/sf | Match |
|---|---|---|---|---|---|---|---|
| 4762 Worden Dr | 0.08mi | 4/— | 2,148 (-4%) | 23mo | $235,000 | $109 | 70 |
| 4020 Pebblebrook Ct | 0.02mi | 3/3.0 (-1) | 2,304 (+3%) | 22mo | $285,000 | $124 | 66 |
Match score weights: distance 35% · size 25% · config 20% · recency 20%. Top-matched comps best support the ARV.
Projected returns pro-forma
-3.0% appreciation · 0.0% rent growth · sell at horizon
- IRR
- -6.1%
- Equity multiple
- 0.78×
- Total profit
- $-17,151
- Equity at exit
- $41,436
- IRR
- -0.4%
- Equity multiple
- 0.98×
- Total profit
- $-1,743
- Equity at exit
- $24,028
Cash invested: $77,812 (down + closing). Projections, not guarantees.
Landlord ↔ Tenant lean methodology
- Overall (STATE)
- 90 Strongly Landlord-Friendly
- State South Carolina
- 90 Strongly Landlord-Friendly · R+6
- County
- — inherits STATE
- City
- — inherits STATE
ZIP-level market 29301
- Home prices YoY
- -25.3%
- Rents YoY
- -2.6%
- Active inventory
- 465
- Price-to-rent
- 15.5×
Monthly cashflow live
- Estimated rent
- $2,994 high interval (Pro) →
- Mortgage (P&I)
- −$1,457
- Tax from tax record
- −$216 /mo · $2,593/yr
- Insurance
- −$116
- HOA
- −$0
- Vacancy / Maint / Mgmt
- −$629
- Net cashflow
- $576
Break-even live
Sensitivity live
| Price | -10% $733 | -5% $655 | +0% $576 | +5% $497 | +10% $419 |
|---|---|---|---|---|---|
| Rent | -10% $340 | -5% $458 | +0% $576 | +5% $694 | +10% $813 |
| Rate | -1.0pp $716 | -0.5pp $647 | base $576 | +0.5pp $504 | +1.0pp $431 |
2-unit breakdown (identical units grouped — click to expand)
| Units | Beds | Baths | Est. rent |
|---|---|---|---|
| 2× units | 2.0 | 1.5 | $2,994 |
| #1 | 2.0 | 1.5 | $1,497 |
| #2 | 2.0 | 1.5 | $1,497 |
| Total (2 units) | $2,994 | ||
UW: 25.0% down · 7.5% · 30yr · 1.5% tax · 5.0% vac · 8.0% maint · 8.0% mgmt
Financing live
Cash to close
- Down payment
- $69,475
- Closing costs
- $8,337
- Reserves months
- —
- Total cash needed
- —
Loan-product check · same deal, 3 products live
Conventional
25% down · 7.5% · 30yr
- Down + closing
- —
- Monthly P&I
- —
- Monthly cashflow
- —
- DSCR
- —
- Eligible?
- —
Personal DTI + credit; lowest rate.
DSCR
20% down · 8.5% · 30yr
- Down + closing
- —
- Monthly P&I
- —
- Monthly cashflow
- —
- DSCR
- —
- Eligible?
- —
No personal income docs; deal must DSCR.
Hard money
10% down · 12.0% · 12mo
- Down + closing
- —
- Monthly P&I
- —
- Monthly cashflow
- —
- DSCR
- —
- Eligible?
- —
Short-term bridge; refi at stabilization.
Rent comps 9 comps
| Address | Beds | Baths | Sqft | Rent | $/sqft | DOM | Units | Dist |
|---|---|---|---|---|---|---|---|---|
| 1128 Grovewood Ct Moore, SC | 3.0 | 2.5 | 2465 | $2,300 | $0.93 | 23d | 1 | 0.59mi |
| 1071 Simmons Trce Moore, SC | 3.0 | 2.5 | 1407 | $1,725 | $1.23 | 23d | 1 | 0.60mi |
| 1035 Simmons Trce Moore, SC | 3.0 | 2.5 | 1407 | $1,665 | $1.18 | 23d | 1 | 0.64mi |
| 807 Exley Ln Spartanburg, SC | 2.0–3.0 | 2.5–3.0 | 1562 | $1,764 | $1.13 | 5d | 10 | 0.65mi |
| 1308 Simmons Ridge Ln Moore, SC | 3.0 | 2.5 | 1407 | $1,725 | $1.23 | 23d | 1 | 0.65mi |
| 954 Simmons Trce Moore, SC | 3.0 | 2.5 | 1428 | $1,665 | $1.17 | 15d | 1 | 0.72mi |
| 1124 Simmons Bend Ct Moore, SC | 3.0 | 2.5 | 1428 | $1,675 | $1.17 | 15d | 1 | 0.80mi |
| 736 Bent Hollow Ct Moore, SC | 4.0 | 2.5 | 1850 | $1,995 | $1.08 | 15d | 1 | 1.03mi |
| 2180 Davenport Ct Moore, SC | 3.0 | 2.0 | 1456 | $2,000 | $1.37 | 15d | 1 | 1.35mi |
Listing history 27 events
-
2026-06-22days on market $277,900 Active 369 DOM
-
2026-06-18days on market $277,900 Active 366 DOM
-
2026-06-17days on market $277,900 Active 365 DOM
-
2026-06-16days on market $277,900 Active 364 DOM
-
2026-06-15days on market $277,900 Active 363 DOM
-
2026-06-14days on market $277,900 Active 361 DOM
-
2026-06-13days on market $277,900 Active 360 DOM
-
2026-06-10days on market $277,900 Active 358 DOM
-
2026-06-09days on market $277,900 Active 357 DOM
-
2026-06-08days on market $277,900 Active 356 DOM
-
2026-06-07days on market $277,900 Active 355 DOM
-
2026-06-02days on market $277,900 Active 350 DOM
-
2026-06-01days on market $277,900 Active 349 DOM
-
2026-05-31days on market $277,900 Active 348 DOM
-
2026-05-30days on market $277,900 Active 347 DOM
-
2025-10-08price $277,900
-
2025-07-09price $279,900
-
2025-06-17$285,000 Active
-
2024-12-11$285,000 Active
-
2024-12-11historical
-
2024-07-15$285,000 Active
-
2008-02-12soldstatus $49,500 145-char remark
Show marketing remark (145 chars)
Bring your Investors to check out this great investment opportunity. Duplex is located at the end of Pebble Brook Ct. with limited to no traffic.
-
2007-11-16$64,500 145-char remark
Show marketing remark (145 chars)
Bring your Investors to check out this great investment opportunity. Duplex is located at the end of Pebble Brook Ct. with limited to no traffic.
-
2002-10-30soldstatus $90,500
-
2002-10-01soldstatus $90,500
-
2002-05-24$92,900
-
1997-12-01soldstatus $79,450
ⓘ Source: listings_history table (triggers on properties + properties_extension) + one-shot
backfill from property_details.listing_events for pre-trigger history.
Tax reassessment forecast SC · Resets to sale price
- Current annual tax
- $2,593 · $216/mo
- Projected year-2 tax
- $2,593 · $216/mo
- Expected delta
- $0/yr ($0/mo · 0.0%)
ⓘ Screening estimate from a state-policy table — verify with the county assessor before closing.
Climate risk First Street
- Flood 1/10 Low FEMA zone X (unshaded) · 0% chance over 30 yrs
- Wildfire 3/10 Moderate
- Heat 6/10 Major 7 d/yr ≥105°F today · 16 d/yr by 30 yrs out
- Wind 2/10 Low 2% chance of damaging wind over 30 yrs
- Air quality 4/10 Moderate 4 unhealthy d/yr today · 5 by 30 yrs out
Nearby sold comps map
Loading sold comps map…
Walkable amenities ~0.75 mi
Loading nearby amenities…
Taxation est. · year 1
- Rental income
- $35,928
- − Mortgage interest
- −$15,567
- − Property taxes
- −$2,593
- − Insurance
- −$1,390
- − Repairs & maintenance
- −$2,874
- − Management
- −$2,874
- − Depreciation
- −$8,084
- Taxable income
- $2,546
- Est. tax owed @ 24.0%
- −$611
- After-tax cash flow
- $6,302/yr
For passive investors: Depreciation is non-cash, so a rental often shows a tax loss while cash-flowing — sheltering income. Rental losses are passive: they offset passive income freely, and up to $25,000/yr can offset ordinary (W-2) income if you actively participate and your MAGI is under $100k (phasing out to $0 by $150k); unused losses carry forward. On sale, claimed depreciation is recaptured at up to 25%, and gains may owe capital-gains tax (a 1031 exchange can defer both). Figures are a year-1 estimate at your 24.0% rate — not tax advice; consult a CPA.
Schools (NCES district)
- District
- Spartanburg 06
- NCES district ID
- 4503630
- Math proficiency
- 33% ▼ -8.00%
- Reading proficiency
- 42% ▼ -2.00%
- Median HH income
- $46,110
- Composite
- 32.02/100
- National rank
- #5827
- State rank
- #35 of 80 in SC
Livability — Spartanburg
- Score
- 76/100
- State rank
- #24
- US rank
- #3679
Category grades
Schools grade is shown separately in the Schools card above.
Census & demographics
- County
- Spartanburg County · 258,607 people
- City population
- 120,406
- Metro
- Spartanburg, SC
- Population (ZIP)
- 36,278
- Household income
- $57,805
- Rent vs Own
- Severe rent burden
- 1331.0
Population outlook (Spartanburg County) Hauer SSP2
- Today (2025)
- 325,495 people
- By 2030
- 338,800 · +4.1%
- By 2040
- 363,471 · +11.7%
- By 2050
- 384,156 · +18.0%
- By 2075
- 430,137 · +32.1%
- By 2100
- 442,733 · +36.0%
Race, ethnicity, and origin ACS 2023
- Neighborhood character
- Diverse neighborhood (Simpson 0.67)
- Race & ethnicity
- White 45% Black 32% Hispanic / Latino 13% Two or more races 9% Asian 5%
- Hispanic origin (detail)
- Mexican 7% Puerto Rican 2%
- Common ancestry
- Slovak 2% Lithuanian 1% Italian 1%
- Foreign-born
- 12% · Canada, China, Vietnam
- Languages at home
- 83% English-only · Spanish 10% Other Indo-European 3% Other Asian/Pacific 1%
Political lean MEDSL · Spartanburg
- 2024 margin
- Solid R (+33.6) · D 32.6% · R 66.2% · Other 1.2%
- 2008→2024 swing
- -12.0pp toward R · 2008: -21.6pp · 2024: -33.6pp
- All cycles
- 2024: R+33.6 2020: R+27.3 2016: R+30.0 2012: R+23.1 2008: R+21.6
Not yet ingested
- Civics
- —
Market trends
- HPI YoY
- ▼ -77.19%
- Current HPI
- 228.4172
- Rent YoY
- ▼ -2.64%
- Metro
- Spartanburg, SC
- State GDP YoY
- ▲ 4.51%
- F500 in state
- 2
Industry mix (Fortune 500 HQ in SC)
| Industry | F500 HQs | Revenue |
|---|---|---|
| Packaging | 1 | $7B |
|
||
Price history
+249.8% since first listed12 events — show timeline
- 2025-10-08 Price Changed $277,900 SPMLS
- 2025-07-09 Price Changed $279,900 SPMLS
- 2025-06-17 Listed $285,000 SPMLS
- 2024-12-11 Listed $285,000 SPMLS
- 2024-12-11 Delisted — SPMLS
- 2024-07-15 Listed $285,000 SPMLS
- 2008-02-12 Sold (MLS) $49,500 SPMLS
- 2007-11-16 Listed $64,500 SPMLS
- 2002-10-30 Sold (MLS) $90,500 SPMLS
- 2002-10-01 Sold (Public Records) $90,500 Public Records
- 2002-05-24 Listed $92,900 SPMLS
- 1997-12-01 Sold (Public Records) $79,450 Public Records
Property tax history
+1.9%/yrLatest (2025): $2,593 · +1.9% YoY. Source: county tax records.
Cash-flow waterfall
monthlySold comps — $/sqft
last 12 mo · ≤1 miLoading sold comps…