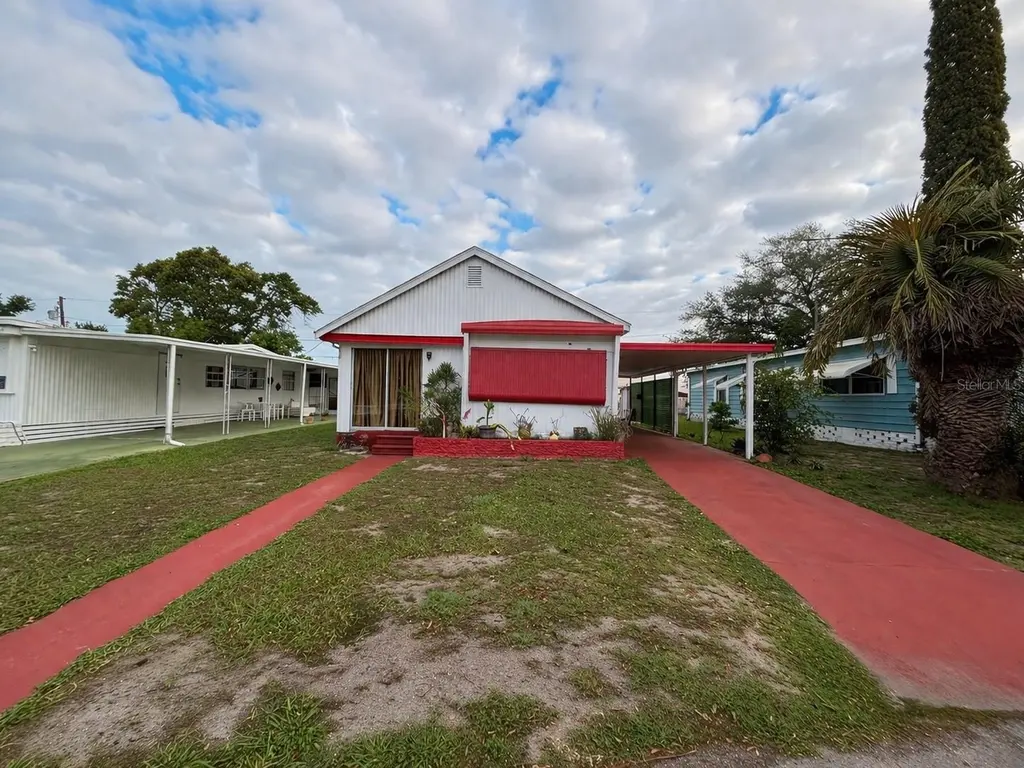
5619 Sunshine Park Dr · Elfers, FL
Flood risk 1/10 · Minimal
- FEMA flood zone
- X (unshaded)
- Chance of flooding over 30 yrs
- 0.0%
- Est. flood insurance / yr
- $507 – $1,088
Fire risk 1/10 · Minimal
- Est. fire insurance / yr
- $947 – $1,759
Heat risk 10/10 · Severe
- Hot days now (above 108°F)
- 7 days/yr
- Hot days in 30 yrs
- 27 days/yr
Wind risk 10/10 · Severe
- Chance of severe wind over 30 yrs
- 99.0%
Air-quality risk 2/10 · Minimal
- Unhealthy air days now
- 1 days/yr
- Unhealthy air days in 30 yrs
- 1 days/yr
Risk factors via First Street. Map © Google.
Why this score? — see what drove the C+ grade
The composite is a weighted blend of 9 inputs, each scored 0–100. Each bar is that input's sub-score; the figure is the points it added to the 100-point composite (weight × sub-score).
- Cash flow +30.0/30.0
- DSCR +10.0/10.0
- 1% rule +8.6/10.0
- Schools +4.3/10.0
- Livability +3.9/5.0
- Rent growth +2.7/5.0
- Condition / age +2.5/5.0
- ARV discount +0.0/15.0
- Appreciation +0.0/10.0
$95,999
🖨 Deal sheet 📄 Offer letter ✓ Due diligence
Listing remarks MLS
2 Bedroom 2 Bath Roomy Mobile Home selling AS IS. .. AS IS. .. AS IS. . CASH ONLY. .. Needs some TLC or change it out with a new mobile home. . VALUE IS IN THE LAND. No Lot Rent Here.
Key facts
- Cotee river
- Natural light
- Private yard
Tags
Property features AI
Finance
- Other: Unfurnished; Zoning: RMH
Exterior
- Parking: Carport (1 space)
- Utilities: Public water; Public sewer; Public utilities
- Home design: Residential mobile home; Single-story; Faces south; Homesteaded property
- Construction: Metal siding; Metal roof; Crawlspace foundation; Built on a 0.1-acre lot
- Exterior features: Other exterior features; Paved road access
Interior
- Kitchen: Microwave; Refrigerator
- Bedrooms: 2 bedrooms
- Flooring: Tile; Wood
- Bathrooms: 1 full bathroom; 1 half bathroom
- Heating & cooling: No heating system specified; Central air conditioning
- Interior features: Other interior features; Microwave; Refrigerator
- Laundry & utility: No laundry facilities
Neighborhood map
What this means for you Summary
Snapshot
- This is a 2-bed/2.0-bath manufactured listed at $96k.
Deal economics
- At list price, monthly cash flow is $394 ($5k/yr) — positive.
- The deal already cash-flows at list — no discount required.
- Meets the 1% rule at list price ($1k rent vs $96k).
- Recommended offer: $93k (3.0% below list) — sets the bar for market timing.
- Cap rate 11.2% vs local median 4.7% in Elfers — top-decile yield for the area; either an underpriced asset or a hidden risk that comps aren't pricing in. Stress-test before assuming the spread holds.
Location & tenants
- Location reads 78/100 on livability (#167 in FL, #2,486 nationally) — a middle-class / working-renter tenant base. Strengths: cost of living A+, housing A+, health & safety A+; Watch: crime C-, employment D+, amenities D-.
- Pasco (suburban): math 50% / reading 52% proficiency, ranked #32 of 73 in FL (top 44%) — acceptable for families but not a draw, mixed tenant base, ~2y average lease.
- Market conditions: Rents flat; 635 active listings in the ZIP; 19 comparable units currently listed for rent nearby; rentals at typical pace (median 22d on market — plan ~3-4 weeks tenant-placement turnaround); 6,765 units permitted in Pasco County in 2024 (1,250 in 5+ unit buildings).
Forward outlook
- Local home prices are declining (-3.0%/yr); year-one equity from $663 of loan paydown is wiped out by about $3k of value loss. Plan a longer hold.
- Pasco County population projected at +29% by 2050 — long-run rental-demand tailwind backs the buy-and-hold thesis.
- At projected returns (-3.0% appreciation + 0.7% rent growth), your $27k cash investment doubles in ~9 years — after that, you're playing with house money.
Negotiation context
- It's been on market 59 days — a 3% lower offer ($93k) is reasonable based on typical stale-listing flexibility.
- 2 sale attempts since 8y ago; this cycle's ask has dropped $13k (12%) from the opening price — seller is motivated, your offer sets the floor, not the list.
- Current owner paid $500; list at $96k implies a 19100% gain — meaningful room to come down on a strong offer.
Risks & watch-outs
- Climate carrying-cost: severe wind risk, 99% chance of damaging wind over 30y; extreme-heat days projected 7→27/yr by 2055 (HVAC capex compounding) — expect insurance premiums to compound above CPI over the hold.
Questions for the listing agent
- It's been on market 59 days. Have you received any prior offers? Is the seller open to a 3% concession, seller financing, or rate buy-down credit?
- Built in 1970 — when were the roof, HVAC, electrical panel, plumbing, and water heater last replaced?
- Is there a deadline driving the sale (1031 exchange, divorce, estate, relocation)? That informs how much negotiation room exists.
- What's the average days-on-market for RENTAL listings here right now (not sales)? A rising rental-DOM trend means longer vacancies and softer asking-rent achievability than the comps imply.
- What's the recent tenant-quality profile in this submarket — average credit score on applications, eviction rate, late-payment / NSF rate, and stable-employment percentage? A property-management company in the area should have these aggregated.
- How much new for-sale + rental construction is in the pipeline within 1–3 miles? Heavy new supply typically softens prices + rents 12–24 months out; constrained supply supports both.
Investment metrics
- 1% rule
- 1.36% ✓
- Cap rate
- 11.22%
- Cash-on-cash
- 17.59%
- DSCR
- 1.78
- GRM
- 6.1
CMA / ARV
- ARV (on-the-fly)
- $73,008
- Comps found
- 2
Show comp detail 2 sales within ~0.75 mi
| Address | Dist | Beds/Ba | Sqft | Sold | Price | $/sf | Match |
|---|---|---|---|---|---|---|---|
| 5713 Sunshine Park Dr | 0.09mi | 2/1.5 | 672 (+8%) | 4mo | $69,000 | $103 | 78 |
| 4239 Memphis Ave | 0.34mi | 2/1.5 | 600 (-4%) | 2mo | $70,000 | $117 | 74 |
Match score weights: distance 35% · size 25% · config 20% · recency 20%. Top-matched comps best support the ARV.
Projected returns pro-forma
-3.0% appreciation · 0.72% rent growth · sell at horizon
- IRR
- 6.5%
- Equity multiple
- 1.25×
- Total profit
- $6,614
- Equity at exit
- $14,314
- IRR
- 13.8%
- Equity multiple
- 1.99×
- Total profit
- $26,625
- Equity at exit
- $8,300
Cash invested: $26,880 (down + closing). Projections, not guarantees.
Landlord ↔ Tenant lean methodology
- Overall (STATE)
- 87 Strongly Landlord-Friendly
- State Florida
- 87 Strongly Landlord-Friendly · R+3
- County
- — inherits STATE
- City
- — inherits STATE
ZIP-level market 34652
- Home prices YoY
- -26.1%
- Rents YoY
- 0.7%
- Active inventory
- 635
- Price-to-rent
- 6.1×
Monthly cashflow live
- Estimated rent
- $1,302 high interval (Pro) →
- Mortgage (P&I)
- −$503
- Tax from tax record
- −$91 /mo · $1,094/yr
- Insurance
- −$40
- HOA
- −$0
- Vacancy / Maint / Mgmt
- −$273
- Net cashflow
- $394
Break-even live
UW: 25.0% down · 7.5% · 30yr · 1.5% tax · 5.0% vac · 8.0% maint · 8.0% mgmt
Financing live
Cash to close
- Down payment
- $24,000
- Closing costs
- $2,880
- Reserves months
- —
- Total cash needed
- —
Loan-product check · same deal, 3 products live
Conventional
25% down · 7.5% · 30yr
- Down + closing
- —
- Monthly P&I
- —
- Monthly cashflow
- —
- DSCR
- —
- Eligible?
- —
Personal DTI + credit; lowest rate.
DSCR
20% down · 8.5% · 30yr
- Down + closing
- —
- Monthly P&I
- —
- Monthly cashflow
- —
- DSCR
- —
- Eligible?
- —
No personal income docs; deal must DSCR.
Hard money
10% down · 12.0% · 12mo
- Down + closing
- —
- Monthly P&I
- —
- Monthly cashflow
- —
- DSCR
- —
- Eligible?
- —
Short-term bridge; refi at stabilization.
Rent comps 19 comps
| Address | Beds | Baths | Sqft | Rent | $/sqft | DOM | Units | Dist |
|---|---|---|---|---|---|---|---|---|
| 5844 Sunshine Park Dr New Port Richey, FL | 3.0 | 1.0 | 672 | $1,100 | $1.64 | 3d | 1 | 0.17mi |
| 4551 Audrey Ln NEW PRT RCHY, FL | 2.0 | 1.0 | 750 | $1,295 | $1.73 | 22d | 1 | 0.43mi |
| 4540 Audrey Ln New Port Richey, FL | 2.0 | 1.0 | 750 | $1,150 | $1.53 | 24d | 1 | 0.43mi |
| 4518 Audrey Ln Unit 4551 New Port Richey, FL | 2.0 | 1.0 | 750 | $1,295 | $1.73 | 22d | 1 | 0.44mi |
| 4529 Audrey Ln New Port Richey, FL | 2.0 | 1.0 | 750 | $1,295 | $1.73 | 22d | 1 | 0.46mi |
| 4744 Azalea Dr #204 New Port Richey, FL | 1.0 | 1.0 | 736 | $1,100 | $1.49 | 20d | 1 | 0.57mi |
| 5333 Pasadena Dr Unit 5333 New Port Richey, FL | 1.0 | 1.0 | 576 | $1,200 | $2.08 | 18d | 1 | 0.58mi |
| 4722 Kennedy Dr New Port Richey, FL | 1.0 | 1.0 | 504 | $850 | $1.69 | 24d | 1 | 0.59mi |
| 4124 Flamingo Dr New Port Richey, FL | 3.0 | 1.0 | 744 | $1,500 | $2.02 | 3d | 1 | 0.81mi |
| 4124 Flamingo Dr New Port Richey, FL | 3.0 | 1.0 | 744 | $1,500 | $2.02 | 15d | 1 | 0.81mi |
| 5149 Tangelo Dr Apt B New Port Richey, FL | 1.0 | 1.0 | 350 | $1,195 | $3.41 | 24d | 1 | 0.86mi |
| 5154 Turquoise Ln #102 New Port Richey, FL | 1.0 | 1.0 | 708 | $1,250 | $1.77 | 5d | 1 | 1.10mi |
| 4901 Onyx Ln #102 New Port Richey, FL | 1.0 | 1.0 | 672 | $1,295 | $1.93 | 24d | 1 | 1.17mi |
| 5543 Gulf Dr New Port Richey, FL | 2.0 | 1.0 | 744 | $1,550 | $2.08 | 17d | 1 | 1.18mi |
| 4944 Elkner St New Port Richey, FL | 2.0 | 1.0 | 722 | $1,350 | $1.87 | 22d | 1 | 1.20mi |
| 4948 Getner St New Port Richey, FL | 2.0 | 1.0 | 722 | $1,350 | $1.87 | 24d | 1 | 1.24mi |
| 4922 Filner St New Port Richey, FL | 1.0 | 1.0 | 540 | $1,000 | $1.85 | 22d | 1 | 1.25mi |
| 6807 Porter Rd Unit PCG G-202 New Port Richey, FL | 1.0 | 1.0 | 605 | $1,025 | $1.69 | 5d | 1 | 1.31mi |
| 4209 Touchton Pl New Port Richey, FL | 1.0 | 1.0 | 624 | $1,300 | $2.08 | 17d | 1 | 1.33mi |
Listing history 12 events
-
2026-06-07days on market $95,999 Active 59 DOM
-
2026-06-04days on market $95,999 Active 56 DOM
-
2026-06-03days on market $95,999 Active 55 DOM
-
2026-06-02days on market $95,999 Active 54 DOM
-
2026-06-01days on market $95,999 Active 53 DOM
-
2026-05-31days on market $95,999 Active 52 DOM
-
2026-05-11price $95,999
-
2026-04-28price $99,999
-
2026-04-09$109,000 Active
-
2019-01-09historical 183-char remark
Show marketing remark (183 chars)
2 Bedroom 2 Bath Roomy Mobile Home selling AS IS. .. AS IS. .. AS IS. . CASH ONLY. .. Needs some TLC or change it out with a new mobile home. . VALUE IS IN THE LAND. No Lot Rent Here.
-
2019-01-06soldstatus $500 Closed 183-char remark
Show marketing remark (183 chars)
2 Bedroom 2 Bath Roomy Mobile Home selling AS IS. .. AS IS. .. AS IS. . CASH ONLY. .. Needs some TLC or change it out with a new mobile home. . VALUE IS IN THE LAND. No Lot Rent Here.
-
2018-12-11$39,900 Active 183-char remark
Show marketing remark (183 chars)
2 Bedroom 2 Bath Roomy Mobile Home selling AS IS. .. AS IS. .. AS IS. . CASH ONLY. .. Needs some TLC or change it out with a new mobile home. . VALUE IS IN THE LAND. No Lot Rent Here.
ⓘ Source: listings_history table (triggers on properties + properties_extension) + one-shot
backfill from property_details.listing_events for pre-trigger history.
Tax reassessment forecast FL · Resets to sale price
- Current annual tax
- $1,094 · $91/mo
- Projected year-2 tax
- $1,094 · $91/mo
- Expected delta
- $0/yr ($0/mo · 0.0%)
ⓘ Screening estimate from a state-policy table — verify with the county assessor before closing.
Climate risk First Street
- Flood 1/10 Low FEMA zone X (unshaded) · 0% chance over 30 yrs
- Wildfire 1/10 Low
- Heat 10/10 Extreme 7 d/yr ≥108°F today · 27 d/yr by 30 yrs out
- Wind 10/10 Extreme 99% chance of damaging wind over 30 yrs
- Air quality 2/10 Low 1 unhealthy d/yr today · 1 by 30 yrs out
Nearby sold comps map
Loading sold comps map…
Walkable amenities ~0.75 mi
Loading nearby amenities…
Taxation est. · year 1
- Rental income
- $15,623
- − Mortgage interest
- −$5,377
- − Property taxes
- −$1,094
- − Insurance
- −$480
- − Repairs & maintenance
- −$1,250
- − Management
- −$1,250
- − Depreciation
- −$2,793
- Taxable income
- $3,379
- Est. tax owed @ 24.0%
- −$811
- After-tax cash flow
- $3,916/yr
For passive investors: Depreciation is non-cash, so a rental often shows a tax loss while cash-flowing — sheltering income. Rental losses are passive: they offset passive income freely, and up to $25,000/yr can offset ordinary (W-2) income if you actively participate and your MAGI is under $100k (phasing out to $0 by $150k); unused losses carry forward. On sale, claimed depreciation is recaptured at up to 25%, and gains may owe capital-gains tax (a 1031 exchange can defer both). Figures are a year-1 estimate at your 24.0% rate — not tax advice; consult a CPA.
Schools (NCES district)
- District
- Pasco
- NCES district ID
- 1201530
- Math proficiency
- 50% ▼ -10.00%
- Reading proficiency
- 52% ▼ -5.00%
- Median HH income
- $45,039
- Composite
- 43.14/100
- National rank
- #3074
- State rank
- #32 of 73 in FL
Livability — Elfers
- Score
- 78/100
- State rank
- #167
- US rank
- #2486
Category grades
Schools grade is shown separately in the Schools card above.
Census & demographics
- Census place
- Elfers, FL
- County
- Pasco County · 524,098 people
- Metro
- Tampa-St. Petersburg-Clearwater, FL
- Population (ZIP)
- 27,444
- Household income
- $56,931
- Rent vs Own
- Severe rent burden
- 1190.0
Population outlook (Pasco County) Hauer SSP2
- Today (2025)
- 570,045 people
- By 2030
- 605,844 · +6.3%
- By 2040
- 674,806 · +18.4%
- By 2050
- 736,022 · +29.1%
- By 2075
- 862,900 · +51.4%
- By 2100
- 906,364 · +59.0%
Race, ethnicity, and origin ACS 2023
- Neighborhood character
- Predominantly White (78%)
- Race & ethnicity
- White 78% Hispanic / Latino 13% Two or more races 9% Black 4%
- Hispanic origin (detail)
- Mexican 3% Puerto Rican 4% Cuban 4%
- Common ancestry
- Romanian 4% Lithuanian 3% Slovak 2%
- Foreign-born
- 9% · Canada
- Languages at home
- 87% English-only · Spanish 9% Other Indo-European 1% Russian/Polish/Slavic 1%
Political lean MEDSL · Pasco
- 2024 margin
- Strong R (+25.2) · D 36.9% · R 62.1% · Other 1.0%
- 2008→2024 swing
- -21.6pp toward R · 2008: -3.6pp · 2024: -25.2pp
- All cycles
- 2024: R+25.2 2020: R+20.1 2016: R+21.6 2012: R+6.7 2008: R+3.6
Not yet ingested
- Civics
- —
Market trends
- HPI YoY
- ▼ -109.49%
- Current HPI
- 310.8347
- Rent YoY
- ▲ 0.72%
- Metro
- Tampa-St. Petersburg-Clearwater, FL
- State GDP YoY
- ▲ 3.28%
- F500 in state
- 36
Industry mix (Fortune 500 HQ in FL)
| Industry | F500 HQs | Revenue |
|---|---|---|
| Industrial Technology | 2 | $29B |
|
||
| Insurance | 2 | $17B |
|
||
| Retail | 1 | $60B |
|
||
| Technology Distribution | 1 | $58B |
|
||
| Homebuilding | 1 | $35B |
|
||
| Technology Manufacturing | 1 | $35B |
|
||
Price history
+140.6% since first listed6 events — show timeline
- 2026-05-11 Price Changed $95,999 Stellar MLS as Distributed by MLS Grid
- 2026-04-28 Price Changed $99,999 Stellar MLS as Distributed by MLS Grid
- 2026-04-09 Listed $109,000 Stellar MLS as Distributed by MLS Grid
- 2019-01-09 Listing Removed — Stellar MLS as Distributed by MLS Grid
- 2019-01-06 Sold (MLS) $500 Stellar MLS as Distributed by MLS Grid
- 2018-12-11 Listed $39,900 Stellar MLS as Distributed by MLS Grid
Property tax history
+7.5%/yrLatest (2025): $1,094 · +7.3% YoY. Source: county tax records.
Cash-flow waterfall
monthlySold comps — $/sqft
last 12 mo · ≤1 miLoading sold comps…