1917 Frederick Ave · Baltimore, MD
Flood risk No data
- FEMA flood zone
- —
- Chance of flooding over 30 yrs
- —
- Est. flood insurance / yr
- —
Fire risk No data
- Est. fire insurance / yr
- —
Heat risk No data
- Hot days now (above threshold)
- —
- Hot days in 30 yrs
- —
Wind risk No data
- Chance of severe wind over 30 yrs
- —
Air-quality risk No data
- Unhealthy air days now
- —
- Unhealthy air days in 30 yrs
- —
Risk factors via First Street. Map © Google.
Why this score? — see what drove the D- grade
The composite is a weighted blend of 9 inputs, each scored 0–100. Each bar is that input's sub-score; the figure is the points it added to the 100-point composite (weight × sub-score).
- Cash flow +15.0/30.0
- 1% rule +5.0/10.0
- DSCR +5.0/10.0
- Rent growth +4.4/5.0
- Livability +3.8/5.0
- Condition / age +2.5/5.0
- Schools +1.0/10.0
- ARV discount +0.8/15.0
- Appreciation +0.0/10.0
$25,000
🖨 Deal sheet 📄 Offer letter ✓ Due diligence
Listing remarks
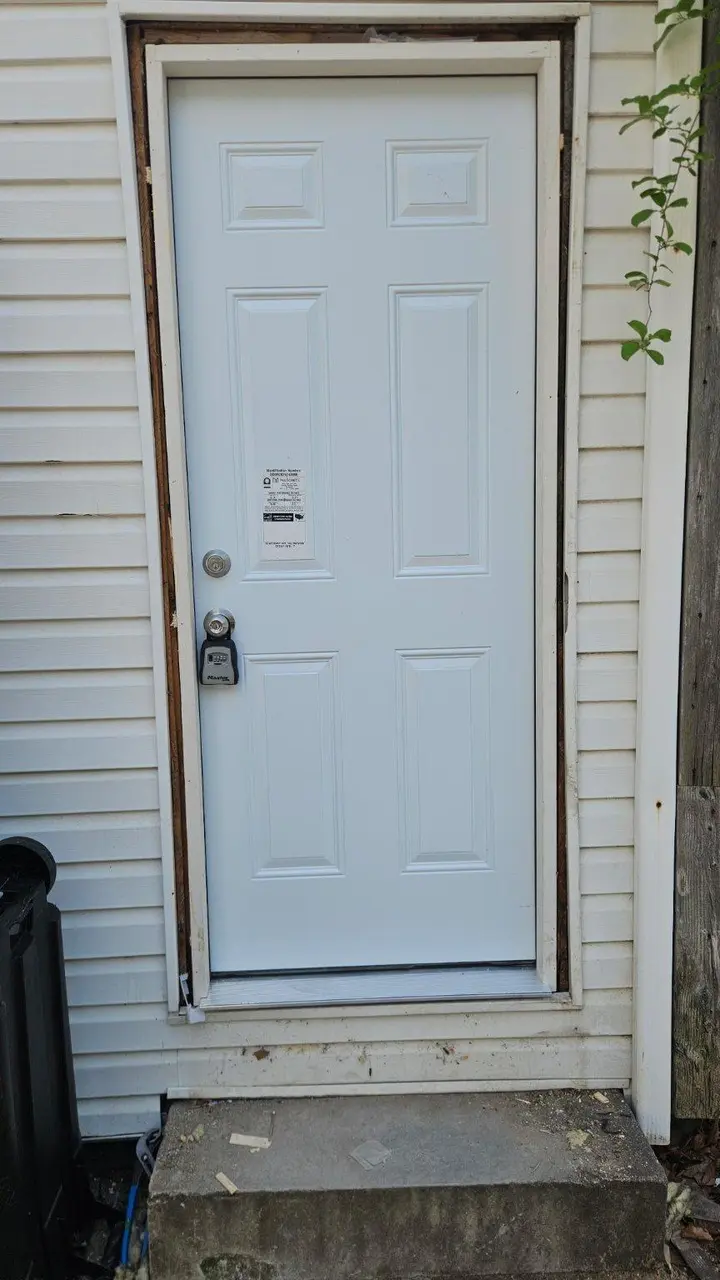
Investor Special | Full Rehab | Priced to Move Classic Federal-style construction across 4 levels; 3BD |1BA interior row in Baltimore City's Carrollton Ridge. This is a complete gut rehab — no lipstick, just opportunity. AS-IS sale. Cash and hard money only. Perfect for flippers, landlords, and seasoned investors looking to add to their Baltimore portfolio. Priced for the work it needs — bring your contractor and your offer.
Key facts
- Interior row
- Carrollton ridge
- Complete gut rehab
Tags
Property features AI
Finance
- Other: Finished above-grade area reported
- Financial info: Ground rent amount applies (semi-annual payment); Property assessed as ground rent ownership interest; Property condition: major rehab needed
Exterior
- Parking: On-street parking
- Utilities: Public water; Public sewer; Natural gas available; Sewer available; Water available
- Home design: Interior townhouse/rowhouse; Estimated year built
- Construction: Brick and vinyl siding exterior; Brick/mortar foundation; Tar and gravel roof; Above-grade and below-grade structures; Full basement with interior access and rear entrance
- Exterior features: Street lights; Ground rent exists; paid semi-annually
Interior
- Bedrooms: Three bedrooms on the main level
- Flooring: Ceramic tile; Concrete; Partially carpeted; Wood
- Bathrooms: One full bathroom on the main level
- Heating & cooling: Natural gas and oil heating; Ceiling fans for cooling; Electric service with circuit breakers
- Interior features: Drywall and plaster walls and ceilings; Building not winterized; Enclosed porch; Street lights along the street
- Laundry & utility: Multi-tank hot water
Neighborhood map
What this means for you Summary
Snapshot
- This is a 3-bed/1.0-bath townhouse listed at $25k.
Deal economics
- At list price, monthly cash flow is $1k ($13k/yr) — positive.
- The deal already cash-flows at list — no discount required.
- Meets the 1% rule at list price ($2k rent vs $25k).
- Recommended offer: $25k (1.5% below list) — sets the bar for market timing.
- Cap rate 60.2% vs local median 6.0% in Baltimore — top-decile yield for the area; either an underpriced asset or a hidden risk that comps aren't pricing in. Stress-test before assuming the spread holds.
Location & tenants
- Location reads 76/100 on livability (#90 in MD, #3,396 nationally) — a middle-class / working-renter tenant base. Strengths: amenities A+, commute A+, housing A+; Watch: schools D, crime F.
- Baltimore City Public Schools (urban): math 7% / reading 16% proficiency, ranked #24 of 24 in MD (top 100%) — low school quality limits family demand, transient renter base, plan for 1-2y turnover; 79% free/reduced lunch — lower-income household profile, screen leases tightly.
- Market conditions: Rents rising fast (+7.5%/yr); 422 active listings in the ZIP; 40 comparable units currently listed for rent nearby; rentals at typical pace (median 24d on market — plan ~3-4 weeks tenant-placement turnaround); 40% of comp listings sitting > 30 days — soft ceiling on asking rent; 1,273 units permitted in Baltimore city in 2024 (1,104 in 5+ unit buildings).
- This rent runs 43% of the median local income ($46k/yr) — at the standard rent-burdened threshold; future hikes will face affordability resistance.
Forward outlook
- Local home prices are declining (-3.0%/yr); year-one equity from $173 of loan paydown is wiped out by about $750 of value loss. Plan a longer hold.
- Baltimore County population projected to shrink 4% by 2050 — rents likely to lag national; underwrite the cash flow, not the appreciation.
- At projected returns (-3.0% appreciation + 7.5% rent growth), your $7k cash investment doubles in ~1 year — after that, you're playing with house money.
Negotiation context
- It's been on market 29 days — a 2% lower offer ($25k) is reasonable based on typical stale-listing flexibility.
- 6 sale attempts since 14y ago with the ask held roughly flat each time — persistent listings suggest the price (not the market) is what's stuck; bring a comps-based counter.
- Current owner paid $2k; list at $25k implies a 1150% gain — meaningful room to come down on a strong offer.
Risks & watch-outs
- Watch-outs: built in 1920 — expect roof / HVAC / electrical / plumbing capex.
Questions for the listing agent
- Built in 1920 — when were the roof, HVAC, electrical panel, plumbing, and water heater last replaced?
- Is there a deadline driving the sale (1031 exchange, divorce, estate, relocation)? That informs how much negotiation room exists.
- Schools are D-rated, which usually means shorter tenancies and higher turnover. Who's the typical renter profile here, and what's been the actual vacancy rate?
- Crime grade is F in this area — have there been break-ins, vandalism, or insurance claims at this property in the last 3 years? What carrier currently insures it and at what premium?
- The area grade is low — what's the realistic commute time and amenity access for the typical tenant pool here? Any planned neighborhood developments (good or bad) we should know about?
- What's the average days-on-market for RENTAL listings here right now (not sales)? A rising rental-DOM trend means longer vacancies and softer asking-rent achievability than the comps imply.
- What's the recent tenant-quality profile in this submarket — average credit score on applications, eviction rate, late-payment / NSF rate, and stable-employment percentage? A property-management company in the area should have these aggregated.
- How much new for-sale + rental construction is in the pipeline within 1–3 miles? Heavy new supply typically softens prices + rents 12–24 months out; constrained supply supports both.
Investment metrics
- 1% rule
- 6.55% ✓
- Cap rate
- 60.21%
- Cash-on-cash
- 192.57%
- DSCR
- 9.57
- GRM
- 1.3
CMA / ARV
- ARV (on-the-fly)
- $21,750
- Comps found
- 12
Show comp detail 12 sales within ~0.75 mi
| Address | Dist | Beds/Ba | Sqft | Sold | Price | $/sf | Match |
|---|---|---|---|---|---|---|---|
| 1610 Lemmon St | 0.24mi | 2/1.0 (-1) | 744 (-1%) | 1mo | $20,000 | $27 | 82 |
| 1612 Lemmon St | 0.24mi | 2/1.0 (-1) | 744 (-1%) | 1mo | $20,000 | $27 | 82 |
| 1608 Lemmon St | 0.25mi | 2/1.0 (-1) | 744 (-1%) | 1mo | $20,000 | $27 | 82 |
| 1606 Lemmon St | 0.25mi | 2/1.0 (-1) | 744 (-1%) | 1mo | $20,000 | $27 | 81 |
| 1611 Lemmon St | 0.25mi | 2/1.0 (-1) | 686 (-8%) | 1mo | $20,000 | $29 | 69 |
| 1613 Lemmon St | 0.25mi | 2/1.0 (-1) | 686 (-8%) | 1mo | $20,000 | $29 | 69 |
| 1406 Lemmon St | 0.40mi | 3/1.5 | 720 (-4%) | 8mo | $155,000 | $215 | 66 |
| 1926 Wilhelm St | 0.19mi | 2/1.0 (-1) | 684 (-9%) | 7mo | $7,500 | $11 | 66 |
| 1605 Lemmon St | 0.25mi | 2/3.0 (-1) | 686 (-8%) | 1mo | $20,000 | $29 | 60 |
| 119 S Carrollton Ave | 0.59mi | 2/1.5 (-1) | 800 (+7%) | 4mo | $83,000 | $104 | 52 |
| 2214 Wilkens Ave | 0.44mi | 3/1.0 | 860 (+15%) | 9mo | $65,000 | $76 | 48 |
| 1241 Sargeant St | 0.75mi | 2/2.5 (-1) | 816 (+9%) | 4mo | $160,000 | $196 | 36 |
Match score weights: distance 35% · size 25% · config 20% · recency 20%. Top-matched comps best support the ARV.
Projected returns pro-forma
-3.0% appreciation · 7.51% rent growth · sell at horizon
- IRR
- —
- Equity multiple
- 11.76×
- Total profit
- $75,289
- Equity at exit
- $3,728
- IRR
- —
- Equity multiple
- 28.54×
- Total profit
- $192,789
- Equity at exit
- $2,162
Cash invested: $7,000 (down + closing). Projections, not guarantees.
Landlord ↔ Tenant lean methodology
- Overall (CITY)
- 12 Strongly Tenant-Friendly
- State Maryland
- 27 Tenant-Leaning · D+14
- County
- — inherits STATE
- City Baltimore
- 12 Strongly Tenant-Friendly · D+58
ZIP-level market 21223
- Rents YoY
- 7.5%
- Active inventory
- 422
- Price-to-rent
- 1.3×
Monthly cashflow live
- Estimated rent
- $1,638 high interval (Pro) →
- Mortgage (P&I)
- −$131
- Tax from tax record
- −$29 /mo · $352/yr
- Insurance
- −$10
- HOA
- −$0
- Vacancy / Maint / Mgmt
- −$344
- Net cashflow
- $1,123
Break-even live
UW: 25.0% down · 7.5% · 30yr · 1.5% tax · 5.0% vac · 8.0% maint · 8.0% mgmt
Financing live
Cash to close
- Down payment
- $6,250
- Closing costs
- $750
- Reserves months
- —
- Total cash needed
- —
Loan-product check · same deal, 3 products live
Conventional
25% down · 7.5% · 30yr
- Down + closing
- —
- Monthly P&I
- —
- Monthly cashflow
- —
- DSCR
- —
- Eligible?
- —
Personal DTI + credit; lowest rate.
DSCR
20% down · 8.5% · 30yr
- Down + closing
- —
- Monthly P&I
- —
- Monthly cashflow
- —
- DSCR
- —
- Eligible?
- —
No personal income docs; deal must DSCR.
Hard money
10% down · 12.0% · 12mo
- Down + closing
- —
- Monthly P&I
- —
- Monthly cashflow
- —
- DSCR
- —
- Eligible?
- —
Short-term bridge; refi at stabilization.
Rent comps 40 comps
| Address | Beds | Baths | Sqft | Rent | $/sqft | DOM | Units | Dist |
|---|---|---|---|---|---|---|---|---|
| 1918 W Baltimore St Baltimore, MD | 2.0–3.0 | 1.0–2.0 | 857 | $1,434 | $1.67 | 44d | 1 | 0.10mi |
| 1601 Frederick Ave Unit 3 Baltimore, MD | 2.0 | 1.0 | 1050 | $1,050 | $1.00 | 4d | 1 | 0.25mi |
| 62 N Gorman Ave Baltimore, MD | 3.0 | 2.0 | 1100 | $2,500 | $2.27 | 18d | 1 | 0.39mi |
| 1324 W Lombard St Unit 2 Baltimore, MD | 2.0 | 1.5 | 1100 | $1,450 | $1.32 | 44d | 1 | 0.44mi |
| 1324 W Lombard St Unit 1 Baltimore, MD | 2.0 | 2.0 | 1100 | $1,500 | $1.36 | 24d | 1 | 0.44mi |
| 1315 Hollins St Unit 2 Baltimore, MD | 3.0 | 2.0 | 1096 | $1,860 | $1.70 | 4d | 1 | 0.45mi |
| 1315 Hollins St Unit 2 Baltimore, MD | 3.0 | 2.0 | 1096 | $1,950 | $1.78 | 12d | 1 | 0.45mi |
| 305 S Calhoun St Baltimore, MD | 2.0 | 1.0 | 1000 | $1,300 | $1.30 | 22d | 1 | 0.46mi |
| 2516 Hollins St Baltimore, MD | 3.0 | 2.0 | 1100 | $1,700 | $1.55 | 44d | 1 | 0.53mi |
| 48 S Carrollton Ave Unit 4 Baltimore, MD | 2.0 | 1.0 | 670 | $1,600 | $2.39 | 44d | 1 | 0.55mi |
| 2540 Frederick Ave Baltimore, MD | 3.0 | 1.0 | 1075 | $1,400 | $1.30 | 24d | 1 | 0.60mi |
| 332 S Franklintown Rd Unit 2 Baltimore, MD | 2.0 | 1.0 | 776 | $795 | $1.02 | 24d | 1 | 0.64mi |
| 1215 James St Baltimore, MD | 2.0 | 1.0 | 960 | $1,500 | $1.56 | 44d | 1 | 0.72mi |
| 101 N Schroeder St Baltimore, MD | 3.0 | 1.0–2.0 | 1037 | $3,185 | $3.07 | 2d | 12 | 0.76mi |
| 1142 Sargeant St Baltimore, MD | 3.0 | 2.0 | 1080 | $1,601 | $1.48 | 2d | 1 | 0.76mi |
| 2657 Lehman St Unit 1 Baltimore, MD | 2.0 | 1.0 | 1056 | $1,000 | $0.95 | 44d | 1 | 0.78mi |
| 1127 Sargeant St Baltimore, MD | 2.0 | 1.5 | 1080 | $1,275 | $1.18 | 24d | 1 | 0.78mi |
| 1315 Harlem Ave Unit B Baltimore, MD | 2.0 | 1.0 | 900 | $1,425 | $1.58 | 24d | 1 | 0.78mi |
| 1315 Harlem Ave Unit C Baltimore, MD | 2.0 | 1.0 | 900 | $1,425 | $1.58 | 44d | 1 | 0.78mi |
| 1160 Washington Blvd Baltimore, MD | 2.0 | 1.0 | 960 | $1,575 | $1.64 | 24d | 1 | 0.79mi |
| 923 McHenry St Baltimore, MD | 3.0 | 1.0 | 1008 | $1,625 | $1.61 | 44d | 1 | 0.79mi |
| 1163 Washington Blvd Baltimore, MD | 2.0 | 2.5 | 1012 | $1,700 | $1.68 | 12d | 1 | 0.81mi |
| 1432 Carroll St Baltimore, MD | 2.0 | 1.5 | 912 | $1,900 | $2.08 | 44d | 1 | 0.82mi |
| 847 McHenry St Baltimore, MD | 2.0 | 2.0 | 952 | $1,795 | $1.89 | 4d | 1 | 0.85mi |
| 1339 W Lafayette Ave #1 Baltimore, MD | 2.0 | 2.0 | 700 | $1,600 | $2.29 | 12d | 1 | 0.90mi |
| 2815 W Mulberry St Baltimore, MD | 4.0 | 2.0 | 1040 | $2,050 | $1.97 | 44d | 1 | 0.93mi |
| 853 Reinhart St Baltimore, MD | 2.0 | 2.5 | 780 | $1,800 | $2.31 | 44d | 1 | 0.94mi |
| 805 Washington Blvd Unit B Baltimore, MD | 2.0 | 2.0 | 1106 | $1,650 | $1.49 | 20d | 1 | 1.00mi |
| 805 Washington Blvd Unit A Baltimore, MD | 2.0 | 2.0 | 1050 | $1,650 | $1.57 | 44d | 1 | 1.00mi |
| 2301 Riggs Ave Baltimore, MD | 3.0 | 2.0 | 1072 | $1,600 | $1.49 | 24d | 1 | 1.01mi |
| 519 Scott St Unit 1 Baltimore, MD | 2.0 | 2.0 | 800 | $2,000 | $2.50 | 44d | 1 | 1.04mi |
| 1125 Wicomico St Baltimore, MD | 3.0 | 3.0 | 1068 | $1,955 | $1.83 | 24d | 1 | 1.10mi |
| 1110 Shields Pl Unit 1129 Baltimore, MD | 2.0 | 1.0 | 770 | $1,100 | $1.43 | 44d | 1 | 1.16mi |
| 812 S Paca St Baltimore, MD | 3.0 | 2.0 | 990 | $1,500 | $1.52 | 12d | 1 | 1.17mi |
| 638 S Paca St Unit 2404866494 Baltimore, MD | 3.0 | 1.5 | 1100 | $2,200 | $2.00 | 44d | 1 | 1.21mi |
| 617 W Lexington St Baltimore, MD | 1.0–2.0 | 1.0 | 975 | $2,200 | $2.26 | 10d | 4 | 1.22mi |
| 1346 N Carey St Baltimore, MD | 2.0 | 1.5 | 1100 | $1,500 | $1.36 | 44d | 1 | 1.29mi |
| 1931 Griffis Ave Baltimore, MD | 2.0 | 1.0 | 912 | $1,349 | $1.48 | 4d | 1 | 1.35mi |
| 1534 N Stricker St Baltimore, MD | 2.0 | 1.5 | 900 | $1,475 | $1.64 | 15d | 1 | 1.36mi |
| 318 N Paca St Unit 10 Baltimore, MD | 2.0 | 1.0 | 600 | $1,200 | $2.00 | 22d | 1 | 1.37mi |
Listing history 39 events
-
2026-06-18days on market $25,000 Active 29 DOM
-
2026-06-17days on market $25,000 Active 28 DOM
-
2026-06-16days on market $25,000 Active 27 DOM
-
2026-06-15days on market $25,000 Active 26 DOM
-
2026-06-13days on market $25,000 Active 24 DOM
-
2026-06-09days on market $25,000 Active 20 DOM
-
2026-06-08days on market $25,000 Active 19 DOM
-
2026-06-07days on market $25,000 Active 18 DOM
-
2026-06-04days on market $25,000 Active 15 DOM
-
2026-06-03days on market $25,000 Active 14 DOM
-
2026-06-02days on market $25,000 Active 13 DOM
-
2026-06-01days on market $25,000 Active 12 DOM
-
2026-05-31days on market $25,000 Active 11 DOM
-
2026-05-20$25,000 Active
-
2026-04-27historical
-
2026-04-04price $37,000
-
2026-04-03$48,000 Active
-
2020-03-18historical
-
2019-12-17status Pending
-
2019-12-05price $12,000
-
2019-11-23price $23,000
-
2019-10-29price $5,000
-
2019-10-18price $12,000
-
2019-09-19price $5,000
-
2019-02-18price $15,000
-
2019-01-28price $5,000
-
2018-04-04price $12,000
-
2018-02-20price $5,000
-
2015-09-24$7,000 Active
-
2014-04-10historical
-
2014-04-10historical
-
2013-11-20price
-
2013-10-07Active
-
2013-10-07$11,000
-
2012-05-01soldstatus $2,000 Sold
-
2012-04-09price $4,500
-
2012-03-09price $6,500
-
2012-02-07$8,500 Active
-
2006-12-05soldstatus $100,000
ⓘ Source: listings_history table (triggers on properties + properties_extension) + one-shot
backfill from property_details.listing_events for pre-trigger history.
Tax reassessment forecast MD · Partial reset (capped growth)
- Current annual tax
- $352 · $29/mo
- Projected year-2 tax
- $352 · $29/mo
- Expected delta
- $0/yr ($0/mo · 0.0%)
ⓘ Screening estimate from a state-policy table — verify with the county assessor before closing.
Nearby sold comps map
Loading sold comps map…
Walkable amenities ~0.75 mi
Loading nearby amenities…
Taxation est. · year 1
- Rental income
- $19,659
- − Mortgage interest
- −$1,400
- − Property taxes
- −$352
- − Insurance
- −$125
- − Repairs & maintenance
- −$1,573
- − Management
- −$1,573
- − Depreciation
- −$727
- Taxable income
- $13,908
- Est. tax owed @ 24.0%
- −$3,338
- After-tax cash flow
- $10,142/yr
For passive investors: Depreciation is non-cash, so a rental often shows a tax loss while cash-flowing — sheltering income. Rental losses are passive: they offset passive income freely, and up to $25,000/yr can offset ordinary (W-2) income if you actively participate and your MAGI is under $100k (phasing out to $0 by $150k); unused losses carry forward. On sale, claimed depreciation is recaptured at up to 25%, and gains may owe capital-gains tax (a 1031 exchange can defer both). Figures are a year-1 estimate at your 24.0% rate — not tax advice; consult a CPA.
Schools (NCES district)
- District
- Baltimore City Public Schools
- NCES district ID
- 2400090
- Math proficiency
- 7% ▼ -9.00%
- Reading proficiency
- 16% ▼ -5.00%
- Median HH income
- $42,108
- Composite
- 10.08/100
- National rank
- #9805
- State rank
- #24 of 24 in MD
Livability — Baltimore
- Score
- 76/100
- State rank
- #90
- US rank
- #3396
Category grades
Schools grade is shown separately in the Schools card above.
Census & demographics
- Census place
- Baltimore, MD
- County
- Baltimore City · 558,601 people
- City population
- 588,727
- Metro
- Baltimore-Columbia-Towson, MD
- Population (ZIP)
- 19,572
- Household income
- $45,840
- Rent vs Own
- Severe rent burden
- 1755.0
Population outlook (Baltimore County) Hauer SSP2
- Today (2025)
- 624,249 people
- By 2030
- 621,541 · -0.4%
- By 2040
- 609,756 · -2.3%
- By 2050
- 597,249 · -4.3%
- By 2075
- 552,236 · -11.5%
- By 2100
- 513,934 · -17.7%
Race, ethnicity, and origin ACS 2023
- Neighborhood character
- Predominantly Black (72%)
- Race & ethnicity
- Black 72% White 16% Hispanic / Latino 7% Two or more races 6% Asian 1%
- Hispanic origin (detail)
- Mexican 3% Puerto Rican 1%
- Common ancestry
- Romanian 1%
- Foreign-born
- 8% · Canada
- Languages at home
- 90% English-only · Spanish 6% French/Haitian/Cajun 2% Other Indo-European 1%
Political lean MEDSL · Baltimore
- 2024 margin
- Solid D (+73.0) · D 85.2% · R 12.2% · Other 2.6%
- 2008→2024 swing
- -2.5pp toward R · 2008: 75.5pp · 2024: 73.0pp
- All cycles
- 2024: D+73.0 2020: D+76.6 2016: D+74.6 2012: D+76.4 2008: D+75.5
Not yet ingested
- Civics
- —
Market trends
- HPI YoY
- ▼ -97.99%
- Current HPI
- 140.5836
- Rent YoY
- ▲ 7.51%
- Metro
- Baltimore-Columbia-Towson, MD
- State GDP YoY
- ▲ 2.97%
- F500 in state
- 12
Industry mix (Fortune 500 HQ in MD)
| Industry | F500 HQs | Revenue |
|---|---|---|
| Aerospace / Defense | 1 | $71B |
|
||
| Utilities | 1 | $25B |
|
||
| Hotels | 1 | $24B |
|
||
| Consumer Goods | 1 | $7B |
|
||
| Real Estate | 1 | $6B |
|
||
| Chemicals | 1 | $2B |
|
||
Price history
-75.0% since first listed26 events — show timeline
- 2026-05-20 Listed $25,000 BRIGHT MLS
- 2026-04-27 Listing Removed — BRIGHT MLS
- 2026-04-04 Price Changed $37,000 BRIGHT MLS
- 2026-04-03 Listed $48,000 BRIGHT MLS
- 2020-03-18 Listing Removed — BRIGHT MLS
- 2019-12-17 Pending — BRIGHT MLS
- 2019-12-05 Price Changed $12,000 BRIGHT MLS
- 2019-11-23 Price Changed $23,000 BRIGHT MLS
- 2019-10-29 Price Changed $5,000 BRIGHT MLS
- 2019-10-18 Price Changed $12,000 BRIGHT MLS
- 2019-09-19 Price Changed $5,000 BRIGHT MLS
- 2019-02-18 Price Changed $15,000 BRIGHT MLS
- 2019-01-28 Price Changed $5,000 BRIGHT MLS
- 2018-04-04 Price Changed $12,000 BRIGHT MLS
- 2018-02-20 Price Changed $5,000 BRIGHT MLS
- 2015-09-24 Listed $7,000 BRIGHT MLS
- 2014-04-10 Delisted — MRIS
- 2014-04-10 Listing Removed — BRIGHT MLS
- 2013-11-20 Price Changed — MRIS
- 2013-10-07 Listed — MRIS
- 2013-10-07 Listed $11,000 BRIGHT MLS
- 2012-05-01 Sold (MLS) $2,000 MRIS
- 2012-04-09 Price Changed $4,500 MRIS
- 2012-03-09 Price Changed $6,500 MRIS
- 2012-02-07 Listed $8,500 MRIS
- 2006-12-05 Sold (Public Records) $100,000 Public Records
Property tax history
-0.4%/yrLatest (2025): $352 · +0.0% YoY. Source: county tax records.
Cash-flow waterfall
monthlySold comps — $/sqft
last 12 mo · ≤1 miLoading sold comps…