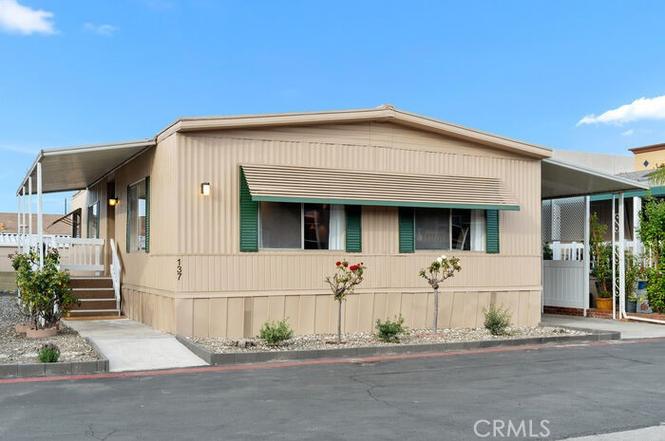
19251 Brookhurst St #137 · Huntington Beach, CA
Flood risk 5/10 · Moderate
- FEMA flood zone
- X
- Chance of flooding over 30 yrs
- 0.24%
- Est. flood insurance / yr
- $507 – $1,088
Fire risk 1/10 · Minimal
- Est. fire insurance / yr
- $659 – $1,223
Heat risk 5/10 · Moderate
- Hot days now (above 85°F)
- 7 days/yr
- Hot days in 30 yrs
- 23 days/yr
Wind risk 1/10 · Minimal
- Chance of severe wind over 30 yrs
- —
Air-quality risk 4/10 · Minor
- Unhealthy air days now
- 5 days/yr
- Unhealthy air days in 30 yrs
- 7 days/yr
Risk factors via First Street. Map © Google.
Why this score? — see what drove the A- grade
The composite is a weighted blend of 9 inputs, each scored 0–100. Each bar is that input's sub-score; the figure is the points it added to the 100-point composite (weight × sub-score).
- Cash flow +30.0/30.0
- ARV discount +15.0/15.0
- 1% rule +10.0/10.0
- DSCR +10.0/10.0
- Schools +6.5/10.0
- Livability +3.4/5.0
- Rent growth +2.8/5.0
- Condition / age +2.5/5.0
- Appreciation +0.0/10.0
$99,900
🖨 Deal sheet 📄 Offer letter ✓ Due diligence
Listing remarks
Price improvement on this beautiful home! Owner took it off the market last month to renovate. Welcome to this beautifully updated, move-in ready home located in the highly desirable community of Del Mar Estates in Huntington Beach. Offering comfort, convenience, coastal charm, and exceptional value, this light and bright residence features an inviting open floor plan designed for comfortable living and effortless entertaining. The spacious living and dining areas flow seamlessly, creating an airy atmosphere filled with natural light. The kitchen includes a newer LG energy-saving stainless steel refrigerator, and the convenient inside laundry area comes complete with a Maytag washer and dry
Key facts
- Open floor plan
- Inside laundry area
- Updated home
Tags
Property features AI
Finance
- Other: Assessments: Unknown; Rent includes: none
- Financial info: Land lease of $2,150 per month (park source)
- HOA & community: Senior community; Park: Del Mar Estates; Manager approval required for multi-unit; Pets allowed: contact manager; Community gutters
Exterior
- Parking: Covered parking; One parking space; One carport space; Private paved road frontage
- Security: Resident manager
- Utilities: Standard electric; Natural gas connected; Public/district water; Public sewer; Cable available; Electricity connected; Sewer connected
- Home design: Single-story (one level); Mobile home remains on site; Model: ILT; Updated/remodeled; Raised entry
- Construction: Aluminum exterior; No foundation specified
- Exterior features: Front porch; Patio; Community pool; Two sheds; Skirted with aluminum; Landscaped lot with garden
Interior
- Kitchen: Gas range; Dishwasher
- Bedrooms: All bedrooms on main floor; Main floor primary bedroom; Family room
- Flooring: Vinyl; Carpet; Laminate
- Bathrooms: Two full bathrooms; Master bath with double sinks; Bathtub and shower-in-tub
- Heating & cooling: Central furnace (heating)
- Interior features: Ceiling fan; Open floor plan; Garden windows; Window screens; Community spa
- Laundry & utility: Washer included; Dryer included; Washer hookup; Gas dryer hookup
Neighborhood map
What this means for you Summary
Snapshot
- This is a 2-bed/2.0-bath manufactured listed at $100k.
Deal economics
- At list price, monthly cash flow is $2k ($28k/yr) — positive.
- The deal already cash-flows at list — no discount required.
- Meets the 1% rule at list price ($4k rent vs $100k).
- Recommended offer: $91k (9.0% below list) — sets the bar for market timing.
- Cap rate 33.9% vs local median 1.6% in Huntington Beach — top-decile yield for the area; either an underpriced asset or a hidden risk that comps aren't pricing in. Stress-test before assuming the spread holds.
Location & tenants
- Location reads 67/100 on livability (#306 in CA) — a middle-class / working-renter tenant base. Strengths: employment A+, commute A-, schools B+; Watch: amenities C-, cost of living F, health & safety F.
- Huntington Beach Union High (suburban): math 65% / reading 82% proficiency, ranked #39 of 517 in CA (top 8%) — strong family-tenant draw, lease renewals of 3-5y typical.
- Market conditions: Rents rising (+1.2%/yr); 116 active listings in the ZIP; 15 comparable units currently listed for rent nearby; rentals leasing fast (median 1d on market — plan ~1-2 weeks tenant-placement turnaround); high-income renter base; 6,974 units permitted in Orange County in 2024 (3,839 in 5+ unit buildings).
- This rent runs 35% of the median local income ($131k/yr) — at the standard rent-burdened threshold; future hikes will face affordability resistance.
Forward outlook
- Local home prices are declining (-3.0%/yr); year-one equity from $691 of loan paydown is wiped out by about $3k of value loss. Plan a longer hold.
- Orange County population projected at +14% by 2050 — modest demand growth; plan on rents tracking national, not racing it.
- At projected returns (-3.0% appreciation + 1.2% rent growth), your $28k cash investment doubles in ~2 years — after that, you're playing with house money.
Negotiation context
- It's been on market 105 days — a 9% lower offer ($91k) is reasonable based on typical stale-listing flexibility.
- 7 sale attempts; this cycle's ask has dropped $20k (17%) from the opening price — seller is motivated, your offer sets the floor, not the list.
Risks & watch-outs
- Climate carrying-cost: moderate flood risk; extreme-heat days projected 7→23/yr by 2055 (HVAC capex compounding) — expect insurance premiums to compound above CPI over the hold.
Questions for the listing agent
- It's been on market 105 days. Have you received any prior offers? Is the seller open to a 9% concession, seller financing, or rate buy-down credit?
- Built in 1973 — when were the roof, HVAC, electrical panel, plumbing, and water heater last replaced?
- Why hasn't it sold? Are there any deal-killer items the seller is aware of (foundation, flood, title, zoning, code violations)?
- Is there a deadline driving the sale (1031 exchange, divorce, estate, relocation)? That informs how much negotiation room exists.
- Schools are B-rated — typically a magnet for longer-tenancy family renters. What's the average tenant stay here, and is there a school-zone premium baked into asking?
- What's the average days-on-market for RENTAL listings here right now (not sales)? A rising rental-DOM trend means longer vacancies and softer asking-rent achievability than the comps imply.
- What's the recent tenant-quality profile in this submarket — average credit score on applications, eviction rate, late-payment / NSF rate, and stable-employment percentage? A property-management company in the area should have these aggregated.
- How much new for-sale + rental construction is in the pipeline within 1–3 miles? Heavy new supply typically softens prices + rents 12–24 months out; constrained supply supports both.
Investment metrics
- 1% rule
- 3.79% ✓
- Cap rate
- 33.89%
- Cash-on-cash
- 98.56%
- DSCR
- 5.39
- GRM
- 2.2
CMA / ARV
- ARV (on-the-fly)
- $131,328
- Comps found
- 7
Show comp detail 7 sales within ~0.75 mi
| Address | Dist | Beds/Ba | Sqft | Sold | Price | $/sf | Match |
|---|---|---|---|---|---|---|---|
| 19251 Brookhurst St #137 | 0.00mi | 2/2.0 | 1,152 (0%) | 1mo | $99,000 | $86 | 99 |
| 19251 Brookhurst St #68 | 0.12mi | 2/2.0 | 1,248 (+8%) | 24mo | $125,000 | $100 | 61 |
| 19361 Brookhurst St #177 | 0.23mi | 3/2.0 (+1) | 1,250 (+8%) | 20mo | $246,950 | $198 | 53 |
| 19251 Brookhurst St #14 | 0.12mi | 3/2.0 (+1) | 1,320 (+15%) | 20mo | $151,000 | $114 | 48 |
| 19350 Ward St #54 | 0.71mi | 2/2.0 | 1,152 (0%) | 24mo | $98,000 | $85 | 47 |
| 19251 Brookhurst St #46 | 0.12mi | 3/2.0 (+1) | 1,320 (+15%) | 23mo | $165,000 | $125 | 46 |
| 19361 Brookhurst St #129 | 0.23mi | 3/2.0 (+1) | 1,320 (+15%) | 21mo | $150,000 | $114 | 43 |
Match score weights: distance 35% · size 25% · config 20% · recency 20%. Top-matched comps best support the ARV.
Projected returns pro-forma
-3.0% appreciation · 1.2% rent growth · sell at horizon
- IRR
- 97.5%
- Equity multiple
- 5.41×
- Total profit
- $123,459
- Equity at exit
- $14,895
- IRR
- 99.8%
- Equity multiple
- 10.64×
- Total profit
- $269,516
- Equity at exit
- $8,638
Cash invested: $27,972 (down + closing). Projections, not guarantees.
Landlord ↔ Tenant lean methodology
- Overall (STATE)
- 18 Strongly Tenant-Friendly
- State California
- 18 Strongly Tenant-Friendly · D+13
- County
- — inherits STATE
- City
- — inherits STATE
ZIP-level market 92646
- Rents YoY
- 1.2%
- Active inventory
- 116
- Price-to-rent
- 2.2×
Monthly cashflow live
- Estimated rent
- $3,782 high interval (Pro) →
- Mortgage (P&I)
- −$524
- Tax est. 1.5%
- −$125 /mo · $1,498/yr
- Insurance
- −$42
- HOA
- −$0
- Vacancy / Maint / Mgmt
- −$794
- Net cashflow
- $2,297
Break-even live
UW: 25.0% down · 7.5% · 30yr · 1.5% tax · 5.0% vac · 8.0% maint · 8.0% mgmt
Financing live
Cash to close
- Down payment
- $24,975
- Closing costs
- $2,997
- Reserves months
- —
- Total cash needed
- —
Loan-product check · same deal, 3 products live
Conventional
25% down · 7.5% · 30yr
- Down + closing
- —
- Monthly P&I
- —
- Monthly cashflow
- —
- DSCR
- —
- Eligible?
- —
Personal DTI + credit; lowest rate.
DSCR
20% down · 8.5% · 30yr
- Down + closing
- —
- Monthly P&I
- —
- Monthly cashflow
- —
- DSCR
- —
- Eligible?
- —
No personal income docs; deal must DSCR.
Hard money
10% down · 12.0% · 12mo
- Down + closing
- —
- Monthly P&I
- —
- Monthly cashflow
- —
- DSCR
- —
- Eligible?
- —
Short-term bridge; refi at stabilization.
Rent comps 15 comps
| Address | Beds | Baths | Sqft | Rent | $/sqft | DOM | Units | Dist |
|---|---|---|---|---|---|---|---|---|
| 19282 Salmon Ln Huntington Beach, CA | 2.0 | 1.0 | 896 | $4,500 | $5.02 | 2d | 1 | 0.23mi |
| 19775 Cambridge Ln Huntington Beach, CA | 3.0 | 2.5 | 1122 | $3,495 | $3.11 | 1d | 1 | 0.65mi |
| 19778 Cambridge Ln Huntington Beach, CA | 2.0 | 1.5 | 864 | $3,000 | $3.47 | 1d | 1 | 0.66mi |
| 9552 Bickley Dr #7 Huntington Beach, CA | 3.0 | 1.5 | 1100 | $3,500 | $3.18 | 1d | 1 | 0.71mi |
| 19822 Brookhurst St Huntington Beach, CA | 1.0–2.0 | 1.0 | 912 | $3,200 | $3.51 | 1d | 1 | 0.72mi |
| 10107 Holburn Dr Huntington Beach, CA | 3.0 | 1.5 | 1122 | $3,500 | $3.12 | 1d | 1 | 0.73mi |
| 9582 Pettswood Dr Huntington Beach, CA | 3.0 | 1.5 | 1178 | $3,700 | $3.14 | 19d | 1 | 0.77mi |
| 9582 Pettswood Dr Huntington Beach, CA | 3.0 | 1.5 | 1174 | $3,700 | $3.15 | 17d | 1 | 0.77mi |
| 9727 Adams Ave Huntington Beach, CA | 3.0 | 2.5 | 1122 | $3,300 | $2.94 | 1d | 1 | 0.86mi |
| 10172 Ascot Cir Huntington Beach, CA | 3.0 | 1.5 | 1122 | $4,500 | $4.01 | 1d | 1 | 0.89mi |
| 18229 Olympic Ct Fountain Valley, CA | 3.0 | 2.0 | 1144 | $4,300 | $3.76 | 1d | 1 | 1.01mi |
| 20152 Harbor Isle Ln Huntington Beach, CA | 3.0 | 1.0 | 965 | $10,000 | $10.36 | 21d | 1 | 1.24mi |
| 18131 S 3rd St Fountain Valley, CA | 3.0 | 2.0 | 1254 | $5,000 | $3.99 | 1d | 1 | 1.28mi |
| 9891 Hot Springs Dr Huntington Beach, CA | 3.0 | 2.0 | 1494 | $7,000 | $4.69 | 1d | 1 | 1.33mi |
| 10636 La Perla Ave Unit A Fountain Valley, CA | 2.0 | 2.0 | 935 | $3,150 | $3.37 | 1d | 1 | 1.39mi |
Listing history 15 events
-
2026-03-12price $99,900
-
2026-02-12$119,800 Active
-
2026-02-12historical
-
2026-02-11$119,800 Active
-
2026-01-22historical
-
2026-01-13status Active
-
2025-12-31historical
-
2025-12-31$119,000
-
2025-11-29historical
-
2025-10-23price $119,000
-
2025-08-31$129,900 Active
-
2025-08-07status Active
-
2025-07-31historical
-
2025-07-24status Pending Sale
-
2025-06-08$129,900 Active
ⓘ Source: listings_history table (triggers on properties + properties_extension) + one-shot
backfill from property_details.listing_events for pre-trigger history.
Climate risk First Street
- Flood 5/10 Major FEMA zone X · 24% chance over 30 yrs
- Wildfire 1/10 Low
- Heat 5/10 Major 7 d/yr ≥85°F today · 23 d/yr by 30 yrs out
- Wind 1/10 Low
- Air quality 4/10 Moderate 5 unhealthy d/yr today · 7 by 30 yrs out
Nearby sold comps map
Loading sold comps map…
Walkable amenities ~0.75 mi
Loading nearby amenities…
Taxation est. · year 1
- Rental income
- $45,383
- − Mortgage interest
- −$5,596
- − Property taxes
- −$1,498
- − Insurance
- −$500
- − Repairs & maintenance
- −$3,631
- − Management
- −$3,631
- − Depreciation
- −$2,906
- Taxable income
- $27,622
- Est. tax owed @ 24.0%
- −$6,629
- After-tax cash flow
- $20,939/yr
For passive investors: Depreciation is non-cash, so a rental often shows a tax loss while cash-flowing — sheltering income. Rental losses are passive: they offset passive income freely, and up to $25,000/yr can offset ordinary (W-2) income if you actively participate and your MAGI is under $100k (phasing out to $0 by $150k); unused losses carry forward. On sale, claimed depreciation is recaptured at up to 25%, and gains may owe capital-gains tax (a 1031 exchange can defer both). Figures are a year-1 estimate at your 24.0% rate — not tax advice; consult a CPA.
Schools (NCES district)
- District
- Huntington Beach Union High
- NCES district ID
- 0618060
- Math proficiency
- 65% ▲ 17.00%
- Reading proficiency
- 82% ▲ 8.00%
- Median HH income
- $78,159
- Composite
- 64.9/100
- National rank
- #511
- State rank
- #39 of 517 in CA
Livability — Huntington Beach
- Score
- 67/100
- State rank
- #306
- US rank
- #10298
Category grades
Schools grade is shown separately in the Schools card above.
Census & demographics
- Census place
- Huntington Beach, CA
- County
- Orange County · 3,096,323 people
- City population
- 194,835
- Metro
- Los Angeles-Long Beach-Anaheim, CA
- Population (ZIP)
- 54,615
- Household income
- $130,672
- Rent vs Own
- Severe rent burden
- 1226.0
Population outlook (Orange County) Hauer SSP2
- Today (2025)
- 3,477,456 people
- By 2030
- 3,613,117 · +3.9%
- By 2040
- 3,835,945 · +10.3%
- By 2050
- 3,968,736 · +14.1%
- By 2075
- 4,097,053 · +17.8%
- By 2100
- 3,903,633 · +12.3%
Race, ethnicity, and origin ACS 2023
- Neighborhood character
- Diverse neighborhood (Simpson 0.56)
- Race & ethnicity
- White 63% Hispanic / Latino 16% Asian 13% Two or more races 13%
- Hispanic origin (detail)
- Mexican 11%
- Common ancestry
- Italian 3% Romanian 2% Lithuanian 2%
- Foreign-born
- 15% · Vietnam, Canada, China
- Languages at home
- 80% English-only · Spanish 7% Vietnamese 5% Chinese 2%
Political lean MEDSL · Orange
- 2024 margin
- Toss-up / Even · D 49.7% · R 47.1% · Other 3.2%
- 2008→2024 swing
- +5.2pp toward D · 2008: -2.6pp · 2024: 2.6pp
- All cycles
- 2024: D+2.6 2020: D+9.0 2016: D+7.7 2012: R+8.3 2008: R+2.6
Not yet ingested
- Civics
- —
Market trends
- HPI YoY
- ▼ -1082.92%
- Current HPI
- 459.3987
- Rent YoY
- ▲ 1.20%
- Metro
- Los Angeles-Long Beach-Anaheim, CA
- State GDP YoY
- ▲ 3.21%
- F500 in state
- 116
Industry mix (Fortune 500 HQ in CA)
| Industry | F500 HQs | Revenue |
|---|---|---|
| Technology | 27 | $1,492B |
|
||
| Financial Services | 3 | $174B |
|
||
| Retail | 3 | $44B |
|
||
| Insurance | 3 | $26B |
|
||
| Media / Entertainment | 2 | $115B |
|
||
| Pharmaceuticals / Biotech | 2 | $62B |
|
||
Price history
-23.1% since first listed15 events — show timeline
- 2026-03-12 Price Changed $99,900 CRMLS
- 2026-02-12 Listing Removed — CRMLS
- 2026-02-12 Listed $119,800 CRMLS
- 2026-02-11 Listed $119,800 CRMLS
- 2026-01-22 Listing Removed — CRMLS
- 2026-01-13 Relisted — CRMLS
- 2025-12-31 Listed $119,000 CRMLS
- 2025-12-31 Listing Removed — CRMLS
- 2025-11-29 Listing Removed — CRMLS
- 2025-10-23 Price Changed $119,000 CRMLS
- 2025-08-31 Listed $129,900 CRMLS
- 2025-08-07 Relisted — CRMLS
- 2025-07-31 Listing Removed — CRMLS
- 2025-07-24 Pending — CRMLS
- 2025-06-08 Listed $129,900 CRMLS
Cash-flow waterfall
monthlySold comps — $/sqft
last 12 mo · ≤1 miLoading sold comps…