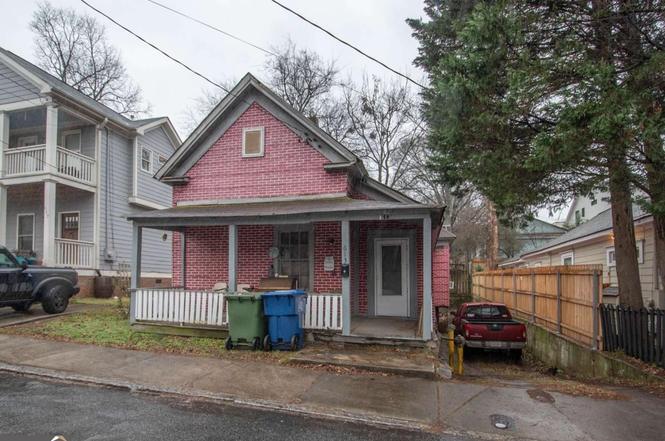
613 Mcdonald St SE · Atlanta, GA
Flood risk 1/10 · Minimal
- FEMA flood zone
- X (unshaded)
- Chance of flooding over 30 yrs
- 0.0%
- Est. flood insurance / yr
- $473 – $860
Fire risk 1/10 · Minimal
- Est. fire insurance / yr
- $963 – $1,789
Heat risk 5/10 · Moderate
- Hot days now (above 104°F)
- 7 days/yr
- Hot days in 30 yrs
- 18 days/yr
Wind risk 4/10 · Minor
- Chance of severe wind over 30 yrs
- 22.0%
Air-quality risk 4/10 · Minor
- Unhealthy air days now
- 4 days/yr
- Unhealthy air days in 30 yrs
- 6 days/yr
Risk factors via First Street. Map © Google.
Why this score? — see what drove the B- grade
The composite is a weighted blend of 9 inputs, each scored 0–100. Each bar is that input's sub-score; the figure is the points it added to the 100-point composite (weight × sub-score).
- Cash flow +25.2/30.0
- ARV discount +15.0/15.0
- DSCR +8.3/10.0
- 1% rule +5.2/10.0
- Livability +4.2/5.0
- Rent growth +3.2/5.0
- Schools +2.7/10.0
- Condition / age +2.5/5.0
- Appreciation +0.0/10.0
$299,900
🖨 Deal sheet 📄 Offer letter ✓ Due diligence
Listing remarks
This property presents a fantastic investment opportunity, ideally located near downtown Atlanta. It's within walking distance to shopping, offering great convenience for potential tenants or buyers. The home boasts a charming 3-bedroom, 1-bath layout, complete with a privacy fence for added seclusion. Additionally, the property offers a view of the downtown skyline, providing a unique urban appeal. With its prime location and desirable features, this could be a valuable addition to any portfolio or making your primary home and forever home.
Key facts
- Privacy fence
- 3,397 sq ft lot
- 2 parking spots
Tags
Neighborhood map
What this means for you Summary
Snapshot
- This is a 3-bed/1.0-bath single-family listed at $300k.
Deal economics
- At list price, monthly cash flow is $669 ($8k/yr) — positive.
- The deal already cash-flows at list — no discount required.
- Meets the 1% rule at list price ($3k rent vs $300k).
- Recommended offer: $264k (12.0% below list) — sets the bar for market timing.
- Cap rate 9.0% vs local median 3.1% in Atlanta — top-decile yield for the area; either an underpriced asset or a hidden risk that comps aren't pricing in. Stress-test before assuming the spread holds.
Location & tenants
- Location reads 83/100 on livability (#6 in GA, #919 nationally) — a professional / high-income tenant draw. Strengths: amenities A+, commute A+, housing A+; Watch: cost of living C-.
- Atlanta Public Schools (urban): math 28% / reading 35% proficiency, ranked #80 of 174 in GA (top 46%) — families likely to look elsewhere, expect single-tenant / working-renter base with shorter leases; 71% free/reduced lunch — lower-income household profile, screen leases tightly.
- Zoned schools: Parkside Elementary School (math 22% / reading 37%, grade F, #633 of 1,228 statewide, top 54%, 563 students, 45% FRL); Martin L. King Jr. Middle School (math 16% / reading 23%, grade F, #356 of 470 statewide, top 78%, 818 students, 100% FRL) — zoned schools at 73% FRL track the district average.
- Market conditions: Rents rising (+2.8%/yr); 237 active listings in the ZIP; 40 comparable units currently listed for rent nearby; rentals at typical pace (median 21d on market — plan ~3-4 weeks tenant-placement turnaround); solid renter incomes; 11,565 units permitted in Fulton County in 2024 (8,159 in 5+ unit buildings).
- This rent runs 44% of the median local income ($83k/yr) — at the standard rent-burdened threshold; future hikes will face affordability resistance.
Forward outlook
- Local home prices are declining (-3.0%/yr); year-one equity from $2k of loan paydown is wiped out by about $9k of value loss. Plan a longer hold.
- Fulton County population projected at +38% by 2050 — long-run rental-demand tailwind backs the buy-and-hold thesis.
Negotiation context
- It's been on market 151 days — a 12% lower offer ($264k) is reasonable based on typical stale-listing flexibility.
- 3 sale attempts; this cycle's ask has dropped $50k (14%) from the opening price — seller is motivated, your offer sets the floor, not the list.
- Current owner paid $16k; list at $300k implies a 1835% gain — meaningful room to come down on a strong offer.
Risks & watch-outs
- Watch-outs: built in 1920 — expect roof / HVAC / electrical / plumbing capex.
- Climate carrying-cost: extreme-heat days projected 7→18/yr by 2055 (HVAC capex compounding) — expect insurance premiums to compound above CPI over the hold.
Questions for the listing agent
- It's been on market 151 days. Have you received any prior offers? Is the seller open to a 12% concession, seller financing, or rate buy-down credit?
- Built in 1920 — when were the roof, HVAC, electrical panel, plumbing, and water heater last replaced?
- Why hasn't it sold? Are there any deal-killer items the seller is aware of (foundation, flood, title, zoning, code violations)?
- Is there a deadline driving the sale (1031 exchange, divorce, estate, relocation)? That informs how much negotiation room exists.
- What's the average days-on-market for RENTAL listings here right now (not sales)? A rising rental-DOM trend means longer vacancies and softer asking-rent achievability than the comps imply.
- What's the recent tenant-quality profile in this submarket — average credit score on applications, eviction rate, late-payment / NSF rate, and stable-employment percentage? A property-management company in the area should have these aggregated.
- How much new for-sale + rental construction is in the pipeline within 1–3 miles? Heavy new supply typically softens prices + rents 12–24 months out; constrained supply supports both.
Investment metrics
- 1% rule
- 1.02% ✓
- Cap rate
- 8.97%
- Cash-on-cash
- 9.56%
- DSCR
- 1.43
- GRM
- 8.2
CMA / ARV
- ARV (on-the-fly)
- $577,800
- Comps found
- 12
Show comp detail 12 sales within ~0.75 mi
| Address | Dist | Beds/Ba | Sqft | Sold | Price | $/sf | Match |
|---|---|---|---|---|---|---|---|
| 708 Bryan St SE | 0.20mi | 4/2.0 (+1) | 1,349 (+5%) | 3mo | $409,900 | $304 | 70 |
| 169 Powell St SE | 0.29mi | 2/1.0 (-1) | 1,139 (-11%) | 1mo | $500,000 | $439 | 62 |
| 793 Harold Ave SE | 0.42mi | 2/2.0 (-1) | 1,348 (+5%) | 2mo | $720,000 | $534 | 61 |
| 173 Berean Ave SE | 0.27mi | 3/2.0 | 1,446 (+13%) | 3mo | $650,000 | $450 | 60 |
| 173 Chester Ave SE | 0.51mi | 3/2.5 | 1,364 (+6%) | 2mo | $645,000 | $473 | 58 |
| 71 Howell St NE | 0.73mi | 2/1.0 (-1) | 1,274 (-1%) | 6mo | $425,000 | $334 | 55 |
| 114 Tye St SE | 0.41mi | 2/2.0 (-1) | 1,150 (-10%) | 1mo | $650,000 | $565 | 54 |
| 333 Stovall St SE | 0.73mi | 4/1.0 (+1) | 1,232 (-4%) | 6mo | $447,200 | $363 | 49 |
| 318 Kelly St SE | 0.74mi | 3/2.0 | 1,350 (+5%) | 6mo | $423,000 | $313 | 48 |
| 317 Stovall St SE | 0.74mi | 3/2.0 | 1,380 (+8%) | 2mo | $485,000 | $351 | 47 |
| 826 Kirkwood Ave SE | 0.51mi | 3/2.5 | 1,473 (+15%) | 8mo | $745,000 | $506 | 39 |
| 80 Randolph St NE | 0.73mi | 3/3.0 | 1,436 (+12%) | 8mo | $681,500 | $475 | 32 |
Match score weights: distance 35% · size 25% · config 20% · recency 20%. Top-matched comps best support the ARV.
Projected returns pro-forma
-3.0% appreciation · 2.84% rent growth · sell at horizon
- IRR
- -2.1%
- Equity multiple
- 0.92×
- Total profit
- $-6,642
- Equity at exit
- $44,716
- IRR
- 7.4%
- Equity multiple
- 1.55×
- Total profit
- $46,441
- Equity at exit
- $25,930
Cash invested: $83,972 (down + closing). Projections, not guarantees.
Landlord ↔ Tenant lean methodology
- Overall (STATE)
- 90 Strongly Landlord-Friendly
- State Georgia
- 90 Strongly Landlord-Friendly · R+3
- County
- — inherits STATE
- City
- — inherits STATE
ZIP-level market 30312
- Rents YoY
- 2.8%
- Active inventory
- 237
- Price-to-rent
- 8.2×
Monthly cashflow live
- Estimated rent
- $3,064 high interval (Pro) →
- Mortgage (P&I)
- −$1,573
- Tax from tax record
- −$54 /mo · $648/yr
- Insurance
- −$125
- HOA
- −$0
- Vacancy / Maint / Mgmt
- −$643
- Net cashflow
- $669
Break-even live
UW: 25.0% down · 7.5% · 30yr · 1.5% tax · 5.0% vac · 8.0% maint · 8.0% mgmt
Financing live
Cash to close
- Down payment
- $74,975
- Closing costs
- $8,997
- Reserves months
- —
- Total cash needed
- —
Loan-product check · same deal, 3 products live
Conventional
25% down · 7.5% · 30yr
- Down + closing
- —
- Monthly P&I
- —
- Monthly cashflow
- —
- DSCR
- —
- Eligible?
- —
Personal DTI + credit; lowest rate.
DSCR
20% down · 8.5% · 30yr
- Down + closing
- —
- Monthly P&I
- —
- Monthly cashflow
- —
- DSCR
- —
- Eligible?
- —
No personal income docs; deal must DSCR.
Hard money
10% down · 12.0% · 12mo
- Down + closing
- —
- Monthly P&I
- —
- Monthly cashflow
- —
- DSCR
- —
- Eligible?
- —
Short-term bridge; refi at stabilization.
Rent comps 40 comps
| Address | Beds | Baths | Sqft | Rent | $/sqft | DOM | Units | Dist |
|---|---|---|---|---|---|---|---|---|
| 630 Woodward Ave SE Atlanta, GA | 2.0 | 1.0 | 1253 | $2,700 | $2.15 | 21d | 1 | 0.03mi |
| 249 Powell St SE Atlanta, GA | 3.0 | 2.0 | 1800 | $3,500 | $1.94 | 24d | 1 | 0.14mi |
| 647 Bryan St SE Atlanta, GA | 2.0 | 2.0 | 1500 | $3,500 | $2.33 | 18d | 1 | 0.14mi |
| 189 Berean Ave SE Atlanta, GA | 2.0 | 1.5 | 996 | $3,200 | $3.21 | 20d | 1 | 0.23mi |
| 720 Mollie St SE Atlanta, GA | 3.0 | 2.0 | 1500 | $5,000 | $3.33 | 20d | 1 | 0.27mi |
| 465 Memorial Dr SE Atlanta, GA | 2.0 | 2.0 | 1081 | $2,470 | $2.28 | 24d | 1 | 0.29mi |
| 465 Memorial Dr SE Unit 436 Atlanta, GA | 2.0 | 2.0 | 1031 | $2,121 | $2.06 | 21d | 1 | 0.29mi |
| 155 Savannah St SE Atlanta, GA | 2.0 | 2.0 | 1028 | $5,500 | $5.35 | 7d | 1 | 0.30mi |
| 777 Memorial Dr SE Atlanta, GA | 3.0 | 1.0–2.0 | 1005 | $3,069 | $3.05 | 1d | 22 | 0.34mi |
| 170 Boulevard SE Unit H112 Atlanta, GA | 2.0 | 1.0 | 1399 | $2,650 | $1.89 | 24d | 1 | 0.34mi |
| 780 Memorial Dr SE Atlanta, GA | 3.0 | 1.0–2.0 | 920 | $2,919 | $3.17 | 1d | 21 | 0.34mi |
| 170 Boulevard SE Apt H506 Atlanta, GA | 2.0 | 2.0 | 1326 | $3,600 | $2.71 | 24d | 1 | 0.35mi |
| 170 Boulevard SE Apt H306 Atlanta, GA | 2.0 | 2.0 | 1008 | $3,000 | $2.98 | 3d | 1 | 0.35mi |
| 170 Boulevard SE Apt H306 Atlanta, GA | 2.0 | 2.0 | 1008 | $3,000 | $2.98 | 20d | 1 | 0.35mi |
| 770 Glenwood Ave SE Atlanta, GA | 1.0–2.0 | 1.0–2.0 | 996 | $2,465 | $2.47 | 2d | 10 | 0.35mi |
| 730 Glenwood Ave SE Atlanta, GA | 1.0–2.0 | 1.0–2.5 | 1032 | $3,399 | $3.29 | 1d | 16 | 0.36mi |
| 745 Kirkwood Ave SE Atlanta, GA | 3.0 | 3.5 | 1812 | $5,500 | $3.04 | 21d | 1 | 0.37mi |
| 133 Estoria St SE Atlanta, GA | 2.0 | 2.5 | 1491 | $6,200 | $4.16 | 24d | 1 | 0.39mi |
| 523 SE BLVD Unit B Atlanta, GA | 2.0 | 2.0 | 1275 | $2,500 | $1.96 | 21d | 1 | 0.41mi |
| 438 Cherokee Ave SE #1 Atlanta, GA | 2.0 | 2.0 | 1200 | $2,300 | $1.92 | 24d | 1 | 0.42mi |
| 685 Wylie St SE Atlanta, GA | 2.0 | 2.0 | 1434 | $5,200 | $3.63 | 21d | 1 | 0.42mi |
| 67 Daniel St SE Atlanta, GA | 4.0 | 2.0 | 1650 | $1,999 | $1.21 | 24d | 1 | 0.49mi |
| 626 DeKalb Ave SE Atlanta, GA | 1.0–2.0 | 1.0–2.0 | 971 | $2,404 | $2.47 | 1d | 11 | 0.51mi |
| 670 DeKalb Ave NE Atlanta, GA | 3.0 | 1.0–2.0 | 1121 | $4,327 | $3.86 | 1d | 35 | 0.52mi |
| 174 Chester Ave SE #50 Atlanta, GA | 2.0 | 2.5 | 1220 | $3,200 | $2.62 | 24d | 1 | 0.54mi |
| 25 Bradley St SE Atlanta, GA | 2.0 | 1.0 | 950 | $1,495 | $1.57 | 18d | 1 | 0.55mi |
| 25 Bradley St SE Atlanta, GA | 2.0 | 1.0 | 950 | $1,495 | $1.57 | 24d | 1 | 0.55mi |
| 240 Grant St SE Atlanta, GA | 2.0 | 1.0–2.0 | 801 | $2,236 | $2.79 | 2d | 22 | 0.55mi |
| 49 Boulevard SE Atlanta, GA | 1.0–3.0 | 1.0–2.0 | 957 | $2,499 | $2.61 | 1d | 23 | 0.56mi |
| 860 Glenwood Ave SE Atlanta, GA | 2.0 | 1.0–2.0 | 863 | $2,320 | $2.69 | 1d | 20 | 0.57mi |
| 807 Field St SE Atlanta, GA | 2.0 | 1.0 | 1690 | $2,600 | $1.54 | 24d | 1 | 0.57mi |
| 880 Glenwood Ave SE Atlanta, GA | 1.0–2.0 | 1.0–2.0 | 942 | $1,925 | $2.04 | 1d | 12 | 0.58mi |
| 97 Selman St SE Atlanta, GA | 3.0 | 2.0 | 1363 | $3,695 | $2.71 | 24d | 1 | 0.61mi |
| 728 Eloise Way SE Atlanta, GA | 2.0 | 2.5 | 1564 | $2,999 | $1.92 | 21d | 1 | 0.63mi |
| 230 Bill Kennedy Way SE Atlanta, GA | 2.0 | 1.0–2.5 | 1062 | $3,019 | $2.84 | 1d | 42 | 0.63mi |
| 419 Chamberlain St SE Atlanta, GA | 2.0 | 1.0 | 1050 | $1,433 | $1.36 | 7d | 2 | 0.65mi |
| 44 Krog St NE Atlanta, GA | 2.0 | 2.0 | 842 | $3,645 | $4.33 | 1d | 11 | 0.68mi |
| 982 Memorial Dr SE Atlanta, GA | 2.0 | 1.0–2.0 | 682 | $2,355 | $3.45 | 24d | 17 | 0.68mi |
| 72 Kenyon St SE Unit 72 Atlanta, GA | 2.0 | 1.0 | 1320 | $2,490 | $1.89 | 24d | 1 | 0.69mi |
| 659 Auburn Ave NE Atlanta, GA | 1.0–2.0 | 1.0 | 935 | $4,800 | $5.13 | 1d | 2 | 0.69mi |
Listing history 9 events
-
2026-01-14status Under Contract
-
2026-01-07status Price Change
-
2026-01-07price $299,900
-
2025-12-23status Under Contract
-
2025-08-01$350,000 New
-
2025-07-31historical
-
2025-01-29$350,000 New
-
1986-01-23soldstatus $15,500
-
1985-12-30soldstatus $15,500
ⓘ Source: listings_history table (triggers on properties + properties_extension) + one-shot
backfill from property_details.listing_events for pre-trigger history.
Tax reassessment forecast GA · Resets to sale price
- Current annual tax
- $648 · $54/mo
- Projected year-2 tax
- $2,759 · $230/mo
- Expected delta
- +$2,111/yr (+$176/mo · 325.8%)
ⓘ Screening estimate from a state-policy table — verify with the county assessor before closing.
Climate risk First Street
- Flood 1/10 Low FEMA zone X (unshaded) · 0% chance over 30 yrs
- Wildfire 1/10 Low
- Heat 5/10 Major 7 d/yr ≥104°F today · 18 d/yr by 30 yrs out
- Wind 4/10 Moderate 22% chance of damaging wind over 30 yrs
- Air quality 4/10 Moderate 4 unhealthy d/yr today · 6 by 30 yrs out
Nearby sold comps map
Loading sold comps map…
Walkable amenities ~0.75 mi
Loading nearby amenities…
Taxation est. · year 1
- Rental income
- $36,767
- − Mortgage interest
- −$16,799
- − Property taxes
- −$648
- − Insurance
- −$1,500
- − Repairs & maintenance
- −$2,941
- − Management
- −$2,941
- − Depreciation
- −$8,724
- Taxable income
- $3,213
- Est. tax owed @ 24.0%
- −$771
- After-tax cash flow
- $7,255/yr
For passive investors: Depreciation is non-cash, so a rental often shows a tax loss while cash-flowing — sheltering income. Rental losses are passive: they offset passive income freely, and up to $25,000/yr can offset ordinary (W-2) income if you actively participate and your MAGI is under $100k (phasing out to $0 by $150k); unused losses carry forward. On sale, claimed depreciation is recaptured at up to 25%, and gains may owe capital-gains tax (a 1031 exchange can defer both). Figures are a year-1 estimate at your 24.0% rate — not tax advice; consult a CPA.
Schools (NCES district)
- District
- Atlanta Public Schools
- NCES district ID
- 1300120
- Math proficiency
- 28% ▼ -6.00%
- Reading proficiency
- 35% ▼ -2.00%
- Median HH income
- $48,306
- Composite
- 27.27/100
- National rank
- #7006
- State rank
- #80 of 174 in GA
Livability — Atlanta
- Score
- 83/100
- State rank
- #6
- US rank
- #919
Category grades
Schools grade is shown separately in the Schools card above.
Census & demographics
- Census place
- Atlanta, GA
- County
- Fulton County · 1,094,430 people
- City population
- 629,525
- Metro
- Atlanta-Sandy Springs-Alpharetta, GA
- Population (ZIP)
- 26,942
- Household income
- $82,779
- Rent vs Own
- Severe rent burden
- 2010.0
Population outlook (Fulton County) Hauer SSP2
- Today (2025)
- 1,203,707 people
- By 2030
- 1,299,706 · +8.0%
- By 2040
- 1,488,256 · +23.6%
- By 2050
- 1,664,580 · +38.3%
- By 2075
- 2,036,072 · +69.2%
- By 2100
- 2,222,402 · +84.6%
Race, ethnicity, and origin ACS 2023
- Neighborhood character
- Diverse neighborhood (Simpson 0.62)
- Race & ethnicity
- Black 46% White 41% Hispanic / Latino 6% Two or more races 5% Asian 4%
- Hispanic origin (detail)
- Mexican 2%
- Common ancestry
- Romanian 2% Lithuanian 1% Slovak 1%
- Foreign-born
- 9% · Canada
- Languages at home
- 88% English-only · Spanish 5% Other Indo-European 1% Chinese 1%
Political lean MEDSL · Fulton
- 2024 margin
- Solid D (+44.9) · D 71.9% · R 27.0% · Other 1.1%
- 2008→2024 swing
- +9.8pp toward D · 2008: 35.0pp · 2024: 44.9pp
- All cycles
- 2024: D+44.9 2020: D+46.4 2016: D+42.1 2012: D+29.6 2008: D+35.0
Not yet ingested
- Civics
- —
Market trends
- HPI YoY
- ▼ -507.19%
- Current HPI
- 240.8692
- Rent YoY
- ▲ 2.84%
- Metro
- Atlanta-Sandy Springs-Alpharetta, GA
- State GDP YoY
- ▲ 2.66%
- F500 in state
- 28
Industry mix (Fortune 500 HQ in GA)
| Industry | F500 HQs | Revenue |
|---|---|---|
| Paper / Packaging | 2 | $29B |
|
||
| Retail | 1 | $160B |
|
||
| Transportation / Logistics | 1 | $91B |
|
||
| Airlines | 1 | $62B |
|
||
| Consumer Goods | 1 | $47B |
|
||
| Utilities | 1 | $25B |
|
||
Price history
+1834.8% since first listed9 events — show timeline
- 2026-01-14 Pending — GAMLS
- 2026-01-07 Relisted — GAMLS
- 2026-01-07 Price Changed $299,900 GAMLS
- 2025-12-23 Pending — GAMLS
- 2025-08-01 Listed $350,000 GAMLS
- 2025-07-31 Listing Removed — GAMLS
- 2025-01-29 Listed $350,000 GAMLS
- 1986-01-23 Sold (Public Records) $15,500 Public Records
- 1985-12-30 Sold (Public Records) $15,500 Public Records
Property tax history
+7.2%/yrLatest (2025): $648 · -1.6% YoY. Source: county tax records.
Cash-flow waterfall
monthlySold comps — $/sqft
last 12 mo · ≤1 miLoading sold comps…