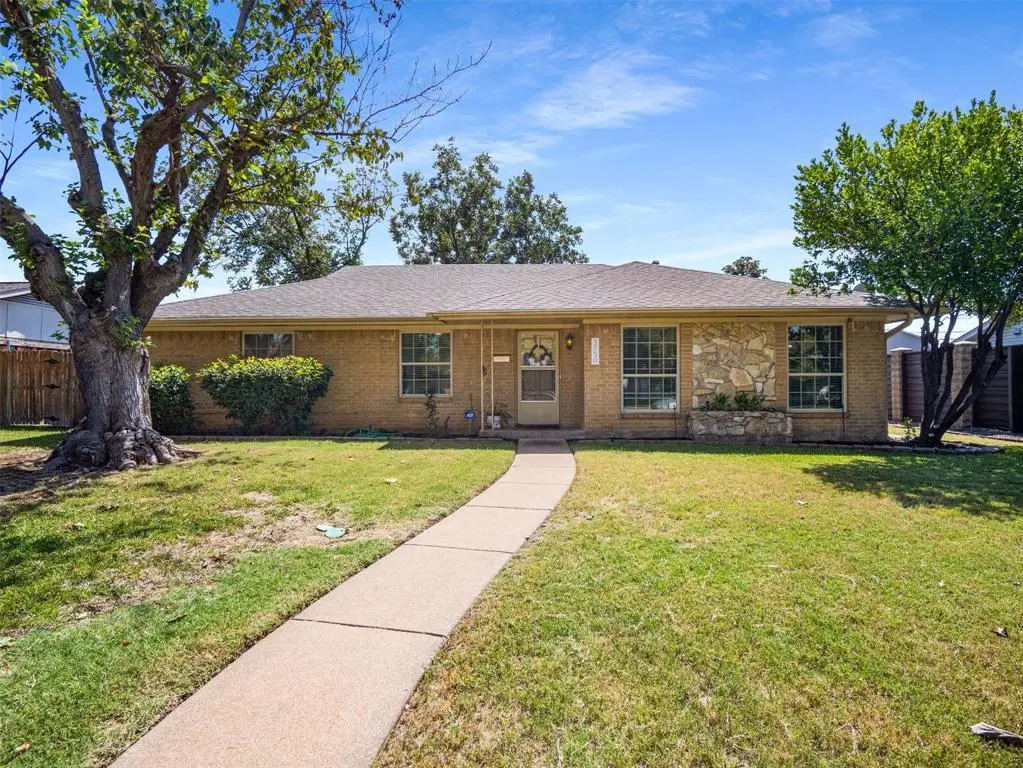
3750 Ridgeoak Way · Farmers Branch, TX
Flood risk 1/10 · Minimal
- FEMA flood zone
- X (unshaded)
- Chance of flooding over 30 yrs
- 0.0%
- Est. flood insurance / yr
- $507 – $1,088
Fire risk 1/10 · Minimal
- Est. fire insurance / yr
- $1,222 – $2,270
Heat risk 7/10 · Major
- Hot days now (above 109°F)
- 7 days/yr
- Hot days in 30 yrs
- 23 days/yr
Wind risk 6/10 · Moderate
- Chance of severe wind over 30 yrs
- 27.0%
Air-quality risk 3/10 · Minor
- Unhealthy air days now
- 3 days/yr
- Unhealthy air days in 30 yrs
- 4 days/yr
Risk factors via First Street. Map © Google.
Why this score? — see what drove the D grade
The composite is a weighted blend of 9 inputs, each scored 0–100. Each bar is that input's sub-score; the figure is the points it added to the 100-point composite (weight × sub-score).
- ARV discount +15.0/15.0
- Cash flow +9.7/30.0
- Livability +3.8/5.0
- 1% rule +3.3/10.0
- Schools +2.8/10.0
- DSCR +2.7/10.0
- Condition / age +2.5/5.0
- Rent growth +2.1/5.0
- Appreciation +0.0/10.0
$385,000
🖨 Deal sheet (PDF) 📄 Offer letter ✓ Due diligence
Listing remarks
Must See to Appreciate This Beauty! Step inside this charming and inviting home featuring a stunning custom wall-to-wall bookshelf that adds both character and functionality. The spacious layout offers an eat-in kitchen and a generous dining area or flex space, providing endless possibilities for family gatherings, a home office, playroom, or additional living space. Enjoy relaxing evenings or entertaining guests on the covered patio, overlooking a large backyard with plenty of room for outdoor activities, cookouts, and making lasting memories. Home Features: Custom wall-to-wall built-in bookshelf, Spacious eat-in kitchen, Large dining area or flexible bonus space, Covered patio for year-ro
Key facts
- Dining area
- Covered patio
- Eat-in kitchen
Tags
Property features AI
Finance
- Other: Listing is Active Under Contract; Possession at closing/funding
- Financial info: Accepts Cash, Conventional, FHA, and VA financing; Treat as clear loan type; No second mortgage reported
- HOA & community: No homeowners association
Exterior
- Parking: Attached 2-car garage; 2 covered parking spaces; Garage faces rear
- Security: No surveillance devices present
- Utilities: City water; Not in a municipal utility district
- Home design: Single family residence; One story
- Construction: Built in 1966; No smart home features reported
- Exterior features: Lot in Country Club Estates subdivision; Lot smaller than 0.5 acre (approximately 0.229 acres); Directions: From 635, exit Marsh Lane, go north, turn right on Ridgeoak Way; property will be on the right
Interior
- Kitchen: Dishwasher; Garbage disposal; Eat-in kitchen
- Bedrooms: Primary bedroom (level 1) with fireplace; Three additional bedrooms (level 1)
- Flooring: No flooring details provided
- Bathrooms: Two full bathrooms
- Heating & cooling: No heating or cooling details provided
- Interior features: Decorative lighting; Eat-in kitchen; Built-in cabinets in living room; Fireplace in primary bedroom; One living area; One dining area; Five total rooms
- Laundry & utility: No specific laundry details provided
Neighborhood map
What this means for you Summary
Snapshot
- This is a 3-bed/2.0-bath single-family listed at $385k.
Deal economics
- At list price, monthly cash flow is $-253 ($-3k/yr) — negative.
- To cash-flow at today's rent, offer at most $340k (11.6% below list).
- To meet the 1% rule (rent ≥ 1% of price), the offer needs to be $319k (17.3% below list).
- Recommended offer: $319k (17.3% below list) — sets the bar for 1% rule.
- Cap rate 5.5% vs local median 2.8% in Farmers Branch — top-decile yield for the area; either an underpriced asset or a hidden risk that comps aren't pricing in. Stress-test before assuming the spread holds.
Location & tenants
- Location reads 76/100 on livability (#100 in TX, #3,379 nationally) — a middle-class / working-renter tenant base. Strengths: employment A+, cost of living A+, housing A+; Watch: commute F.
- Dallas ISD (urban): math 31% / reading 36% proficiency, ranked #559 of 826 in TX (top 68%) — families likely to look elsewhere, expect single-tenant / working-renter base with shorter leases; 83% free/reduced lunch — lower-income household profile, screen leases tightly.
- Zoned schools: Tom C Gooch El (math 52% / reading 47%, grade D, #865 of 4,322 statewide, top 21%, 373 students, 87% FRL); Thomas C Marsh Middle (math 23% / reading 24%, grade F, #1,317 of 1,662 statewide, top 80%, 762 students, 95% FRL); W T White H S (math 14% / reading 28%, grade F, #1,385 of 1,632 statewide, top 85%, 2,149 students, 79% FRL) — zoned schools at 87% FRL track the district average.
- Market conditions: Rents soft (-1.7%/yr); 75 active listings in the ZIP; 39 comparable units currently listed for rent nearby; rentals at typical pace (median 15d on market — plan ~3-4 weeks tenant-placement turnaround); high-income renter base; 12,577 units permitted in Dallas County in 2024 (6,829 in 5+ unit buildings).
- This rent runs 32% of the median local income ($120k/yr) — at the standard rent-burdened threshold; future hikes will face affordability resistance.
Forward outlook
- Local home prices are declining (-3.0%/yr); year-one equity from $3k of loan paydown is wiped out by about $12k of value loss. Plan a longer hold.
- Dallas County population projected at +35% by 2050 — long-run rental-demand tailwind backs the buy-and-hold thesis.
Negotiation context
- Only 12 days on market — expect competitive offers; lowballing is unlikely to land.
- 5 sale attempts since 15y ago with the ask held roughly flat each time — persistent listings suggest the price (not the market) is what's stuck; bring a comps-based counter.
Risks & watch-outs
- Climate carrying-cost: major wind risk, 27% chance of damaging wind over 30y; extreme-heat days projected 7→23/yr by 2055 (HVAC capex compounding) — expect insurance premiums to compound above CPI over the hold.
Questions for the listing agent
- What do current leases actually rent for vs. the listed asking? Can we see a recent rent roll and the last 12 months of T-12 income?
- Built in 1966 — when were the roof, HVAC, electrical panel, plumbing, and water heater last replaced?
- Is there a deadline driving the sale (1031 exchange, divorce, estate, relocation)? That informs how much negotiation room exists.
- Schools are D-rated, which usually means shorter tenancies and higher turnover. Who's the typical renter profile here, and what's been the actual vacancy rate?
- The area grade is low — what's the realistic commute time and amenity access for the typical tenant pool here? Any planned neighborhood developments (good or bad) we should know about?
- What's the average days-on-market for RENTAL listings here right now (not sales)? A rising rental-DOM trend means longer vacancies and softer asking-rent achievability than the comps imply.
- What's the recent tenant-quality profile in this submarket — average credit score on applications, eviction rate, late-payment / NSF rate, and stable-employment percentage? A property-management company in the area should have these aggregated.
- How much new for-sale + rental construction is in the pipeline within 1–3 miles? Heavy new supply typically softens prices + rents 12–24 months out; constrained supply supports both.
Investment metrics
- 1% rule
- 0.83% ✗
- Cap rate
- 5.50%
- Cash-on-cash
- -2.82%
- DSCR
- 0.87
- GRM
- 10.1
CMA / ARV
- ARV (median comp)
- $469,693
- List price
- $385,000
- Delta
- -15.90%
- Verdict
- UNDERPRICED
- Comps
- 20 within 1.0 mi
Show comp detail 12 sales within ~0.75 mi
| Address | Dist | Beds/Ba | Sqft | Sold | Price | $/sf | Match |
|---|---|---|---|---|---|---|---|
| 3726 Ridgeoak Way | 0.07mi | 3/2.0 | 1,844 (-3%) | 5mo | $375,000 | $203 | 87 |
| 3906 Ridgeoak Way | 0.17mi | 3/2.0 | 1,914 (+1%) | 7mo | $459,900 | $240 | 86 |
| 3838 Crestpark Dr | 0.18mi | 3/2.0 | 2,008 (+6%) | 2mo | $459,000 | $229 | 80 |
| 3807 Blue Trace Ln | 0.27mi | 4/2.0 (+1) | 1,970 (+4%) | 5mo | $550,000 | $279 | 72 |
| 12303 Cedar Bend Dr | 0.27mi | 3/3.0 | 2,019 (+6%) | 2mo | $699,900 | $347 | 71 |
| 12540 High Meadow Dr | 0.24mi | 3/2.5 | 1,719 (-10%) | 3mo | $669,000 | $389 | 68 |
| 3758 Blue Trace Ln | 0.23mi | 3/2.0 | 2,099 (+10%) | 7mo | $449,000 | $214 | 66 |
| 3946 Candlenut Ln | 0.49mi | 3/2.5 | 2,012 (+6%) | 3mo | $595,000 | $296 | 63 |
| 3445 High Vista Dr | 0.72mi | 3/2.0 | 1,930 (+2%) | 3mo | $530,000 | $275 | 62 |
| 3949 Royal Palms Ct | 0.59mi | 3/2.0 | 2,090 (+10%) | 2mo | $595,000 | $285 | 54 |
| 12511 Keyport Dr | 0.66mi | 4/3.0 (+1) | 1,963 (+3%) | 4mo | $400,000 | $204 | 52 |
| 3708 Crown Shore Dr | 0.50mi | 4/2.5 (+1) | 2,140 (+13%) | 5mo | $549,999 | $257 | 45 |
Match score weights: distance 35% · size 25% · config 20% · recency 20%. Top-matched comps best support the ARV.
Projected returns pro-forma
-3.0% appreciation · 0.0% rent growth · sell at horizon
- IRR
- -24.5%
- Equity multiple
- 0.19×
- Total profit
- $-87,738
- Equity at exit
- $57,405
- IRR
- -33.0%
- Equity multiple
- -0.23×
- Total profit
- $-132,783
- Equity at exit
- $33,288
Cash invested: $107,800 (down + closing). Projections, not guarantees.
Landlord ↔ Tenant lean methodology
- Overall (STATE)
- 87 Strongly Landlord-Friendly
- State Texas
- 87 Strongly Landlord-Friendly · R+5
- County
- — inherits STATE
- City
- — inherits STATE
ZIP-level market 75244
- Rents YoY
- -1.7%
- Active inventory
- 75
- Price-to-rent
- 10.1×
Monthly cashflow live
- Estimated rent
- $3,186 high interval (Pro) →
- Mortgage (P&I)
- −$2,019
- Tax from tax record
- −$591 /mo · $7,087/yr
- Insurance
- −$160
- HOA
- −$0
- Vacancy / Maint / Mgmt
- −$669
- Net cashflow
- $-253
Break-even live
Sensitivity live
| Price | -10% $-35 | -5% $-144 | +0% $-253 | +5% $-362 | +10% $-471 |
|---|---|---|---|---|---|
| Rent | -10% $-505 | -5% $-379 | +0% $-253 | +5% $-127 | +10% $-2 |
| Rate | -1.0pp $-59 | -0.5pp $-155 | base $-253 | +0.5pp $-353 | +1.0pp $-455 |
UW: 25.0% down · 7.5% · 30yr · 1.5% tax · 5.0% vac · 8.0% maint · 8.0% mgmt
Financing live
Cash to close
- Down payment
- $96,250
- Closing costs
- $11,550
- Reserves months
- —
- Total cash needed
- —
Loan-product check · same deal, 3 products live
Conventional
25% down · 7.5% · 30yr
- Down + closing
- —
- Monthly P&I
- —
- Monthly cashflow
- —
- DSCR
- —
- Eligible?
- —
Personal DTI + credit; lowest rate.
DSCR
20% down · 8.5% · 30yr
- Down + closing
- —
- Monthly P&I
- —
- Monthly cashflow
- —
- DSCR
- —
- Eligible?
- —
No personal income docs; deal must DSCR.
Hard money
10% down · 12.0% · 12mo
- Down + closing
- —
- Monthly P&I
- —
- Monthly cashflow
- —
- DSCR
- —
- Eligible?
- —
Short-term bridge; refi at stabilization.
Rent comps 39 comps
| Address | Beds | Baths | Sqft | Rent | $/sqft | DOM | Units | Dist |
|---|---|---|---|---|---|---|---|---|
| 3827 Clubway Ln Dallas, TX | 3.0 | 2.0 | 2262 | $3,450 | $1.53 | 1d | 1 | 0.13mi |
| 3827 Clubway Ln Dallas, TX | 3.0 | 2.0 | 2262 | $3,450 | $1.53 | 9d | 1 | 0.13mi |
| 12408 Cedar Bend Dr Dallas, TX | 4.0 | 2.5 | 2396 | $4,300 | $1.79 | 20d | 1 | 0.18mi |
| 12607 Gaslite Cir Dallas, TX | 4.0 | 2.0 | 1950 | $3,100 | $1.59 | 15d | 1 | 0.25mi |
| 12220 Hightower Pl Dallas, TX | 4.0 | 2.0 | 2179 | $3,399 | $1.56 | 4d | 1 | 0.32mi |
| 12220 Hightower Pl Dallas, TX | 4.0 | 2.0 | 2179 | $3,399 | $1.56 | 9d | 1 | 0.32mi |
| 3625 Janlyn Ln Dallas, TX | 4.0 | 2.0 | 1824 | $3,150 | $1.73 | 19d | 1 | 0.34mi |
| 12372 High Meadow Dr Dallas, TX | 4.0 | 3.0 | 2400 | $3,199 | $1.33 | 23d | 1 | 0.39mi |
| 3600 Janlyn Ln Farmers Branch, TX | 4.0 | 2.0 | 1824 | $3,150 | $1.73 | 19d | 1 | 0.41mi |
| 4014 Kerr Cir Dallas, TX | 3.0 | 2.0 | 2107 | $4,000 | $1.90 | 9d | 1 | 0.44mi |
| 13030 Mitchwin Rd Dallas, TX | 3.0 | 2.5 | 1846 | $2,950 | $1.60 | 45d | 1 | 0.48mi |
| 4147 Rosser Sq Dallas, TX | 2.0 | 2.0 | 1268 | $2,675 | $2.11 | 9d | 1 | 0.53mi |
| 4079 Calculus Dr Dallas, TX | 4.0 | 2.5 | 2251 | $3,850 | $1.71 | 9d | 1 | 0.54mi |
| 3737 High Vista Dr Dallas, TX | 1.0–3.0 | 1.0–2.0 | 990 | $1,875 | $1.89 | 1d | 11 | 0.54mi |
| 3612 High Bluff Dr Dallas, TX | 4.0 | 2.0 | 1810 | $2,850 | $1.57 | 9d | 1 | 0.56mi |
| 4040 Valley View Ln Farmers Branch, TX | 3.0 | 1.0–2.0 | 1102 | $3,874 | $3.52 | 1d | 65 | 0.62mi |
| 3439 High Mesa Dr Dallas, TX | 3.0 | 2.0 | 1504 | $3,000 | $1.99 | 45d | 1 | 0.65mi |
| 12005 Cromwell Dr Dallas, TX | 4.0 | 3.0 | 2008 | $8,750 | $4.36 | 23d | 1 | 0.84mi |
| 3772 Weeburn Dr Dallas, TX | 3.0 | 2.0 | 2253 | $4,900 | $2.17 | 1d | 1 | 0.88mi |
| 3643 Midpines Dr Dallas, TX | 3.0 | 2.0 | 2271 | $3,300 | $1.45 | 45d | 1 | 0.93mi |
| 3332 Brockway Dr Dallas, TX | 3.0 | 2.0 | 1776 | $2,650 | $1.49 | 14d | 1 | 0.95mi |
| 3737 Vitruvian Way Addison, TX | 3.0 | 1.0–2.0 | 926 | $2,596 | $2.80 | 0d | 99 | 1.00mi |
| 3154 Brincrest Dr Dallas, TX | 4.0 | 2.5 | 2389 | $3,250 | $1.36 | 7d | 1 | 1.03mi |
| 13342 Midway RD Whitesboro, TX | 2.0 | 1.0–2.0 | 931 | $3,320 | $3.57 | 1d | 36 | 1.05mi |
| 3850 Vitruvian Way Addison, TX | 2.0 | 1.0–2.5 | 946 | $2,655 | $2.81 | 0d | 35 | 1.06mi |
| 4068 Winsor Dr Dallas, TX | 3.0 | 2.5 | 2105 | $5,600 | $2.66 | 45d | 1 | 1.11mi |
| 3414 Winged Foot Ct Dallas, TX | 4.0 | 3.0 | 2281 | $4,100 | $1.80 | 45d | 1 | 1.14mi |
| 4000 Sigma Rd Dallas, TX | 1.0–3.0 | 1.0–2.0 | 1145 | $2,617 | $2.28 | 0d | 17 | 1.15mi |
| 3970 Vitruvian Way Addison, TX | 2.0 | 2.0 | 1384 | $2,100 | $1.52 | 45d | 1 | 1.15mi |
| 3970 Vitruvian Way Unit 1007 Addison, TX | 2.0 | 2.0 | 1358 | $1,822 | $1.34 | 45d | 1 | 1.15mi |
| 3990 Vitruvian Way Addison, TX | 1.0–2.0 | 1.0–2.5 | 1153 | $3,171 | $2.75 | 1d | 32 | 1.20mi |
| 4016 Vitruvian Way Addison, TX | 2.0 | 2.0 | 1363 | $2,054 | $1.51 | 45d | 1 | 1.28mi |
| 3170 Golfing Green Dr Dallas, TX | 3.0 | 2.0 | 1790 | $5,500 | $3.07 | 45d | 1 | 1.33mi |
| 3117 Longbow Ct Dallas, TX | 3.0 | 2.0 | 1364 | $2,500 | $1.83 | 45d | 1 | 1.36mi |
| 3543 Jubilee Trl Dallas, TX | 3.0 | 2.0 | 2005 | $4,200 | $2.09 | 9d | 1 | 1.37mi |
| 3648 Jubilee Trl Dallas, TX | 3.0 | 2.0 | 1766 | $4,350 | $2.46 | 9d | 1 | 1.38mi |
| 3227 Rolling Knoll Dr Dallas, TX | 4.0 | 2.5 | 2549 | $3,750 | $1.47 | 45d | 1 | 1.39mi |
| 2972 Maydelle Ln Dallas, TX | 3.0 | 2.0 | 1736 | $2,750 | $1.58 | 14d | 1 | 1.43mi |
| 11353 Coral Hills Dr Dallas, TX | 3.0 | 2.0 | 1488 | $2,950 | $1.98 | 45d | 1 | 1.46mi |
Listing history 26 events
-
2026-06-18status $385,000 Pending 12 DOM
-
2026-06-17days on market $385,000 Active Option Contract 12 DOM
-
2026-06-16days on market $385,000 Active Option Contract 11 DOM
-
2026-06-15days on market $385,000 Active Option Contract 10 DOM
-
2026-06-13days on market $385,000 Active Option Contract 8 DOM
-
2026-06-10status $385,000 Active Option Contract 4 DOM
-
2026-06-09status $385,000 Pending 4 DOM
-
2026-06-08days on market $385,000 Active 4 DOM
-
2026-06-07remarks 699-char remark
-
2026-06-07pricedays on market $385,000 Active 3 DOM
-
2026-05-31days on market $395,000 Active 144 DOM
-
2026-04-06price $395,000 1346-char remark
-
2026-01-30price $410,000 1346-char remark
-
2026-01-07$420,000 Active 1346-char remark
-
2026-01-06historical
-
2025-12-03price $420,000
-
2025-10-01$425,000 Active
-
2017-05-22soldstatus
-
2017-05-19soldstatus Sold
-
2017-05-13status Pending
-
2017-04-21historical Active Option Contract
-
2017-04-14$259,000 Active
-
2012-02-25historical
-
2011-10-23$160,000 Active
-
2007-11-16soldstatus
-
1984-03-16soldstatus
ⓘ Source: listings_history table (triggers on properties + properties_extension) + one-shot
backfill from property_details.listing_events for pre-trigger history.
Tax reassessment forecast TX · Resets to sale price
- Current annual tax
- $7,087 · $591/mo
- Projected year-2 tax
- $7,087 · $591/mo
- Expected delta
- $0/yr ($0/mo · 0.0%)
ⓘ Screening estimate from a state-policy table — verify with the county assessor before closing.
Climate risk First Street
- Flood 1/10 Low FEMA zone X (unshaded) · 0% chance over 30 yrs
- Wildfire 1/10 Low
- Heat 7/10 Severe 7 d/yr ≥109°F today · 23 d/yr by 30 yrs out
- Wind 6/10 Major 27% chance of damaging wind over 30 yrs
- Air quality 3/10 Moderate 3 unhealthy d/yr today · 4 by 30 yrs out
Nearby sold comps map
Loading sold comps map…
Walkable amenities ~0.75 mi
Loading nearby amenities…
Taxation est. · year 1
- Rental income
- $38,229
- − Mortgage interest
- −$21,566
- − Property taxes
- −$7,087
- − Insurance
- −$1,925
- − Repairs & maintenance
- −$3,058
- − Management
- −$3,058
- − Depreciation
- −$11,200
- Taxable loss
- −$9,666
- Est. tax savings @ 24.0%
- +$2,320
- After-tax cash flow
- $-719/yr
For passive investors: Depreciation is non-cash, so a rental often shows a tax loss while cash-flowing — sheltering income. Rental losses are passive: they offset passive income freely, and up to $25,000/yr can offset ordinary (W-2) income if you actively participate and your MAGI is under $100k (phasing out to $0 by $150k); unused losses carry forward. On sale, claimed depreciation is recaptured at up to 25%, and gains may owe capital-gains tax (a 1031 exchange can defer both). Figures are a year-1 estimate at your 24.0% rate — not tax advice; consult a CPA.
Schools (NCES district)
- District
- Dallas ISD
- NCES district ID
- 4816230
- Math proficiency
- 31% ▼ -16.00%
- Reading proficiency
- 36% ▼ -4.00%
- Median HH income
- $42,881
- Composite
- 28.41/100
- National rank
- #6763
- State rank
- #559 of 826 in TX
Livability — Farmers Branch
- Score
- 76/100
- State rank
- #100
- US rank
- #3379
Category grades
Schools grade is shown separately in the Schools card above.
Census & demographics
- Census place
- Farmers Branch, TX
- County
- Dallas County · 2,612,404 people
- City population
- 32,961
- Metro
- Dallas-Fort Worth-Arlington, TX
- Population (ZIP)
- 13,389
- Household income
- $120,286
- Rent vs Own
- Severe rent burden
- 699.0
Population outlook (Dallas County) Hauer SSP2
- Today (2025)
- 2,979,839 people
- By 2030
- 3,191,823 · +7.1%
- By 2040
- 3,619,611 · +21.5%
- By 2050
- 4,026,915 · +35.1%
- By 2075
- 4,957,073 · +66.4%
- By 2100
- 5,508,725 · +84.9%
Race, ethnicity, and origin ACS 2023
- Neighborhood character
- Diverse neighborhood (Simpson 0.63)
- Race & ethnicity
- White 56% Hispanic / Latino 23% Two or more races 15% Black 8% Asian 7%
- Hispanic origin (detail)
- Mexican 17% Puerto Rican 1%
- Common ancestry
- Slovak 2% Serbian 2% Lithuanian 1%
- Foreign-born
- 19% · Canada, China, Vietnam
- Languages at home
- 71% English-only · Spanish 17% Arabic 4% Other Asian/Pacific 2%
Political lean MEDSL · Dallas
- 2024 margin
- Strong D (+22.2) · D 60.2% · R 38.0% · Other 1.8%
- 2008→2024 swing
- +6.9pp toward D · 2008: 15.3pp · 2024: 22.2pp
- All cycles
- 2024: D+22.2 2020: D+31.6 2016: D+26.2 2012: D+15.4 2008: D+15.3
Not yet ingested
- Civics
- —
Market trends
- HPI YoY
- ▼ -397.33%
- Current HPI
- 348.7896
- Rent YoY
- ▼ -1.70%
- Metro
- Dallas-Fort Worth-Arlington, TX
- State GDP YoY
- ▲ 3.95%
- F500 in state
- 110
Industry mix (Fortune 500 HQ in TX)
| Industry | F500 HQs | Revenue |
|---|---|---|
| Energy | 16 | $1,198B |
|
||
| Technology | 5 | $198B |
|
||
| Engineering / Construction | 4 | $72B |
|
||
| Energy Services | 3 | $60B |
|
||
| Utilities | 3 | $41B |
|
||
| Healthcare | 2 | $330B |
|
||
Price history
+140.6% since first listed21 events — show timeline
- 2026-06-17 Pending — NTREIS
- 2026-06-09 Contingent — NTREIS
- 2026-06-09 Pending — NTREIS
- 2026-06-05 Price Changed $385,000 NTREIS
- 2026-06-04 Listed $395,000 NTREIS
- 2026-06-01 Listing Removed — NTREIS
- 2026-04-06 Price Changed $395,000 NTREIS
- 2026-01-30 Price Changed $410,000 NTREIS
- 2026-01-07 Listed $420,000 NTREIS
- 2026-01-06 Listing Removed — NTREIS
- 2025-12-03 Price Changed $420,000 NTREIS
- 2025-10-01 Listed $425,000 NTREIS
- 2017-05-22 Sold (Public Records) — Public Records
- 2017-05-19 Sold (MLS) — NTREIS
- 2017-05-13 Pending — NTREIS
- 2017-04-21 Contingent — NTREIS
- 2017-04-14 Listed $259,000 NTREIS
- 2012-02-25 Listing Removed — NTREIS
- 2011-10-23 Listed $160,000 NTREIS
- 2007-11-16 Sold (Public Records) — Public Records
- 1984-03-16 Sold (Public Records) — Public Records
Property tax history
+4.4%/yrLatest (2025): $7,087 · -0.1% YoY. Source: county tax records.
Cash-flow waterfall
monthlySold comps — $/sqft
last 12 mo · ≤1 miLoading sold comps…