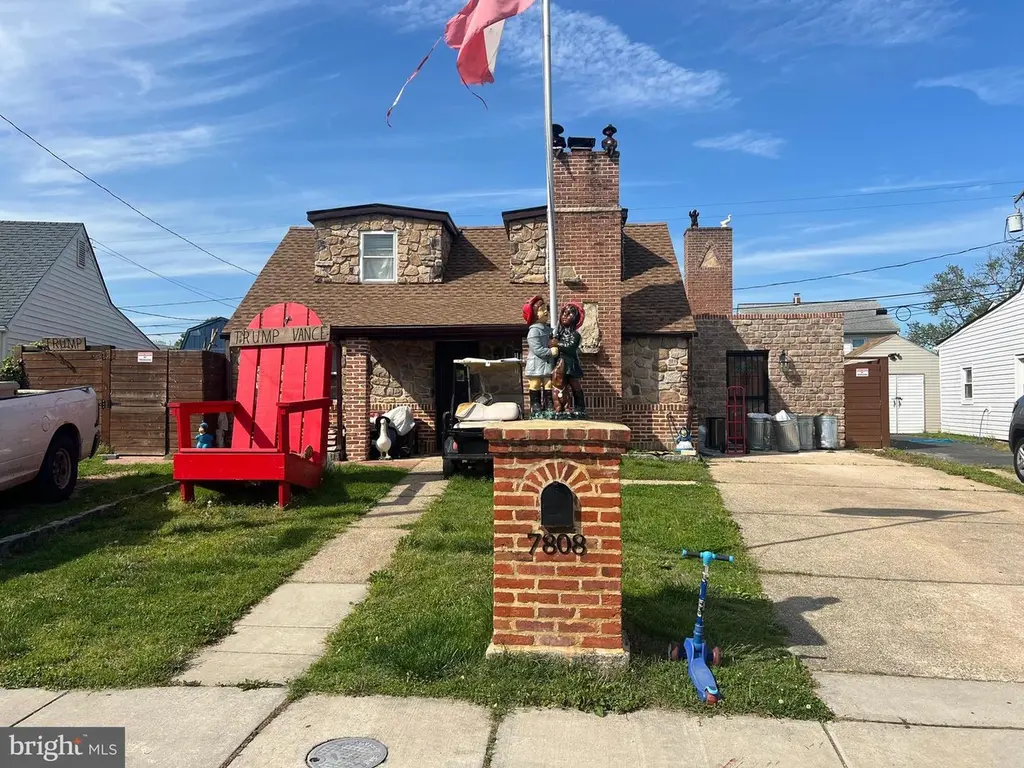
7808 Meath · Dundalk, MD
Flood risk 6/10 · Moderate
- FEMA flood zone
- X (unshaded)
- Chance of flooding over 30 yrs
- 0.57%
- Est. flood insurance / yr
- $507 – $1,088
Fire risk 1/10 · Minimal
- Est. fire insurance / yr
- $755 – $1,403
Heat risk 8/10 · Major
- Hot days now (above 103°F)
- 7 days/yr
- Hot days in 30 yrs
- 15 days/yr
Wind risk 6/10 · Moderate
- Chance of severe wind over 30 yrs
- 63.0%
Air-quality risk 5/10 · Moderate
- Unhealthy air days now
- 6 days/yr
- Unhealthy air days in 30 yrs
- 8 days/yr
Risk factors via First Street. Map © Google.
Why this score? — see what drove the D+ grade
The composite is a weighted blend of 9 inputs, each scored 0–100. Each bar is that input's sub-score; the figure is the points it added to the 100-point composite (weight × sub-score).
- ARV discount +15.0/15.0
- Cash flow +14.5/30.0
- DSCR +4.4/10.0
- Livability +4.2/5.0
- 1% rule +4.0/10.0
- Rent growth +2.5/5.0
- Condition / age +2.5/5.0
- Schools +2.3/10.0
- Appreciation +0.0/10.0
$248,000
🖨 Deal sheet 📄 Offer letter ✓ Due diligence
Listing remarks
Welcome to this spacious single-family home in the heart of Dundalk featuring 4 bedrooms and 2 full bathrooms! Offering over 1,500 square feet of living space, this home provides plenty of room for comfortable everyday living and entertaining. Situated on a generous lot, the property features a functional layout, ample storage, and endless potential to make it your own. Conveniently located near shopping, dining, parks, major commuter routes, and local schools. A great opportunity for homeowners or investors alike! Roof-Brand new in 2026, kitchen renovated two years ago with tile, new paint and stained cabinets, bathrooms updated with new tub and tile, Property includes an outdoor pizza ove
Key facts
- 6,254 sq ft lot
- Built 1943
- Listed 20 days
Property features AI
Finance
- HOA & community: Other fees billed monthly
Exterior
- Parking: Off-street parking; Driveway
- Utilities: Public water; Public sewer; Electric cooling fuel; Natural gas for heating and hot water
- Home design: Detached property; Single-story plus upper level (multi-story layout implied)
- Construction: Brick construction; Slab foundation
- Exterior features: Extensive hardscape; Outside shower; Patio(s) (brick); Fully fenced yard; Shed
Interior
- Kitchen: Kitchen included (open to dining area)
- Bedrooms: Two bedrooms on the main level; Two bedrooms on the first upper level
- Bathrooms: Two full bathrooms (one on main level, one on first upper level)
- Heating & cooling: Forced air heating; Natural gas heating fuel; Central air conditioning; Ceiling fan cooling; Natural gas hot water
- Interior features: Combination kitchen and dining area; Tub with shower; Built-in shelving/cabinets; Ceiling fan(s); Dining area; First-floor bedroom/entry-level bedroom; Living Room; Master Bedroom; Bedroom 2; Kitchen
- Laundry & utility: Laundry on upper floor
Neighborhood map
What this means for you Summary
Snapshot
- This is a 4-bed/2.0-bath single-family listed at $248k.
Deal economics
- At list price, monthly cash flow is $54 ($654/yr) — positive.
- The deal already cash-flows at list — no discount required.
- To meet the 1% rule (rent ≥ 1% of price), the offer needs to be $223k (10.1% below list).
- Recommended offer: $223k (10.1% below list) — sets the bar for 1% rule.
Location & tenants
- Location reads 85/100 on livability (#16 in MD, #510 nationally) — a professional / high-income tenant draw. Strengths: amenities A+, commute A+, housing A+; Watch: crime F.
- Baltimore County Public Schools (suburban): math 15% / reading 34% proficiency, ranked #11 of 24 in MD (top 46%) — low school quality limits family demand, transient renter base, plan for 1-2y turnover.
- Market conditions: Rents soft (-0.1%/yr); 236 active listings in the ZIP; 24 comparable units currently listed for rent nearby; rentals at typical pace (median 24d on market — plan ~3-4 weeks tenant-placement turnaround); 46% of comp listings sitting > 30 days — soft ceiling on asking rent; 1,511 units permitted in Baltimore County in 2024 (643 in 5+ unit buildings).
- This rent runs 42% of the median local income ($64k/yr) — at the standard rent-burdened threshold; future hikes will face affordability resistance.
Forward outlook
- Local home prices are declining (-3.0%/yr); year-one equity from $2k of loan paydown is wiped out by about $7k of value loss. Plan a longer hold.
- Baltimore County population projected at +12% by 2050 — modest demand growth; plan on rents tracking national, not racing it.
Negotiation context
- It's been on market 20 days — a 2% lower offer ($244k) is reasonable based on typical stale-listing flexibility.
- 2 sale attempts since 22y ago with the ask held roughly flat each time — persistent listings suggest the price (not the market) is what's stuck; bring a comps-based counter.
- Current owner paid $80k; list at $248k implies a 210% gain — meaningful room to come down on a strong offer.
Risks & watch-outs
- Watch-outs: built in 1943 — expect roof / HVAC / electrical / plumbing capex.
- Climate carrying-cost: major flood risk; major wind risk, 63% chance of damaging wind over 30y; extreme-heat days projected 7→15/yr by 2055 (HVAC capex compounding) — expect insurance premiums to compound above CPI over the hold.
Questions for the listing agent
- Built in 1943 — when were the roof, HVAC, electrical panel, plumbing, and water heater last replaced?
- Is there a deadline driving the sale (1031 exchange, divorce, estate, relocation)? That informs how much negotiation room exists.
- Schools are A-rated — typically a magnet for longer-tenancy family renters. What's the average tenant stay here, and is there a school-zone premium baked into asking?
- Crime grade is F in this area — have there been break-ins, vandalism, or insurance claims at this property in the last 3 years? What carrier currently insures it and at what premium?
- The area grade is low — what's the realistic commute time and amenity access for the typical tenant pool here? Any planned neighborhood developments (good or bad) we should know about?
- What's the average days-on-market for RENTAL listings here right now (not sales)? A rising rental-DOM trend means longer vacancies and softer asking-rent achievability than the comps imply.
- What's the recent tenant-quality profile in this submarket — average credit score on applications, eviction rate, late-payment / NSF rate, and stable-employment percentage? A property-management company in the area should have these aggregated.
- How much new for-sale + rental construction is in the pipeline within 1–3 miles? Heavy new supply typically softens prices + rents 12–24 months out; constrained supply supports both.
Investment metrics
- 1% rule
- 0.90% ✗
- Cap rate
- 6.56%
- Cash-on-cash
- 0.94%
- DSCR
- 1.04
- GRM
- 9.3
CMA / ARV
- ARV (median comp)
- $299,897
- List price
- $248,000
- Delta
- -17.31%
- Verdict
- UNDERPRICED
- Comps
- 20 within 1.0 mi
Show comp detail 11 sales within ~0.75 mi
| Address | Dist | Beds/Ba | Sqft | Sold | Price | $/sf | Match |
|---|---|---|---|---|---|---|---|
| 3412 Sollers Point Rd | 0.17mi | 4/2.0 | 1,634 (+8%) | 8mo | $330,000 | $202 | 73 |
| 8218 Longpoint | 0.47mi | 4/2.0 | 1,495 (-1%) | 15mo | $285,000 | $191 | 63 |
| 3511 Loganview Dr | 0.25mi | 4/2.0 | 1,350 (-11%) | 12mo | $310,000 | $230 | 60 |
| 3128 Liberty Pkwy | 0.48mi | 3/2.0 (-1) | 1,428 (-6%) | 7mo | $295,000 | $207 | 57 |
| 8108 Dundalk Ave | 0.34mi | 3/1.0 (-1) | 1,313 (-13%) | 2mo | $220,000 | $168 | 51 |
| 3010 Baybriar Rd | 0.52mi | 4/2.0 | 1,425 (-6%) | 20mo | $310,000 | $218 | 49 |
| 3423 Loganview Dr | 0.39mi | 4/2.0 | 1,365 (-10%) | 22mo | $315,000 | $231 | 47 |
| 8109 Murray Point Rd | 0.39mi | 4/1.0 | 1,657 (+9%) | 24mo | $310,000 | $187 | 43 |
| 8000 Dundalk Ave | 0.30mi | 3/2.0 (-1) | 1,325 (-13%) | 21mo | $264,000 | $199 | 42 |
| 2114 Merritt Blvd | 0.63mi | 3/1.0 (-1) | 1,411 (-7%) | 21mo | $272,750 | $193 | 33 |
| 3119 Yorkway | 0.46mi | 3/2.0 (-1) | 1,307 (-14%) | 22mo | $287,500 | $220 | 32 |
Match score weights: distance 35% · size 25% · config 20% · recency 20%. Top-matched comps best support the ARV.
Projected returns pro-forma
-3.0% appreciation · 0.0% rent growth · sell at horizon
- IRR
- -18.2%
- Equity multiple
- 0.38×
- Total profit
- $-43,224
- Equity at exit
- $36,978
- IRR
- -17.8%
- Equity multiple
- 0.16×
- Total profit
- $-58,309
- Equity at exit
- $21,443
Cash invested: $69,440 (down + closing). Projections, not guarantees.
Landlord ↔ Tenant lean methodology
- Overall (STATE)
- 27 Tenant-Leaning
- State Maryland
- 27 Tenant-Leaning · D+14
- County
- — inherits STATE
- City
- — inherits STATE
ZIP-level market 21222
- Rents YoY
- -0.1%
- Active inventory
- 236
- Price-to-rent
- 9.3×
Monthly cashflow live
- Estimated rent
- $2,230 high interval (Pro) →
- Mortgage (P&I)
- −$1,301
- Tax from tax record
- −$303 /mo · $3,642/yr
- Insurance
- −$103
- HOA
- −$0
- Vacancy / Maint / Mgmt
- −$468
- Net cashflow
- $54
Break-even live
UW: 25.0% down · 7.5% · 30yr · 1.5% tax · 5.0% vac · 8.0% maint · 8.0% mgmt
Financing live
Cash to close
- Down payment
- $62,000
- Closing costs
- $7,440
- Reserves months
- —
- Total cash needed
- —
Loan-product check · same deal, 3 products live
Conventional
25% down · 7.5% · 30yr
- Down + closing
- —
- Monthly P&I
- —
- Monthly cashflow
- —
- DSCR
- —
- Eligible?
- —
Personal DTI + credit; lowest rate.
DSCR
20% down · 8.5% · 30yr
- Down + closing
- —
- Monthly P&I
- —
- Monthly cashflow
- —
- DSCR
- —
- Eligible?
- —
No personal income docs; deal must DSCR.
Hard money
10% down · 12.0% · 12mo
- Down + closing
- —
- Monthly P&I
- —
- Monthly cashflow
- —
- DSCR
- —
- Eligible?
- —
Short-term bridge; refi at stabilization.
Rent comps 24 comps
| Address | Beds | Baths | Sqft | Rent | $/sqft | DOM | Units | Dist |
|---|---|---|---|---|---|---|---|---|
| 3413 Yardley Dr Dundalk, MD | 4.0 | 2.0 | 1185 | $2,400 | $2.03 | 43d | 1 | 0.34mi |
| 8220 Cornwall Rd Dundalk, MD | 3.0 | 2.0 | 1125 | $1,775 | $1.58 | 43d | 1 | 0.49mi |
| 123 Walnut Ave Dundalk, MD | 4.0 | 2.0 | 1513 | $2,100 | $1.39 | 2d | 1 | 0.52mi |
| 217 Center St Dundalk, MD | 3.0 | 1.5 | 1280 | $1,575 | $1.23 | 4d | 1 | 0.57mi |
| 8252 Longpoint Rd Dundalk, MD | 4.0 | 2.0 | 1216 | $1,950 | $1.60 | 3d | 1 | 0.62mi |
| 8252 Longpoint Rd Dundalk, MD | 4.0 | 2.0 | 1216 | $2,050 | $1.69 | 16d | 1 | 0.62mi |
| 511 Avondale Rd Dundalk, MD | 2.0–4.0 | 1.0–2.0 | 1146 | $2,250 | $1.96 | 1d | 69 | 0.64mi |
| 8453 Stansbury Lake Dr Dundalk, MD | 3.0 | 2.5 | 2076 | $3,500 | $1.69 | 43d | 1 | 0.66mi |
| 2959 Liberty Pkwy Dundalk, MD | 3.0 | 2.0 | 1479 | $2,150 | $1.45 | 43d | 1 | 0.68mi |
| 3231 Dundalk Ave Dundalk, MD | 3.0 | 2.0 | 1630 | $2,000 | $1.23 | 4d | 1 | 0.77mi |
| 1915 Merritt Blvd Dundalk, MD | 3.0 | 2.0 | 1208 | $2,500 | $2.07 | 43d | 1 | 0.97mi |
| 78 N Dundalk Ave Dundalk, MD | 4.0 | 2.0 | 1545 | $2,200 | $1.42 | 23d | 1 | 1.02mi |
| 2624 Liberty Pkwy Dundalk, MD | 3.0 | 1.5 | 1110 | $1,856 | $1.67 | 43d | 1 | 1.06mi |
| 2020 Dineen Dr Dundalk, MD | 3.0 | 1.5 | 1258 | $1,850 | $1.47 | 4d | 1 | 1.11mi |
| 12 Leeway Dundalk, MD | 3.0 | 1.0 | 1358 | $1,750 | $1.29 | 43d | 1 | 1.12mi |
| 1964 Frames Rd Dundalk, MD | 3.0 | 2.0 | 1528 | $2,400 | $1.57 | 43d | 1 | 1.18mi |
| 8499 Lynch Rd Dundalk, MD | 1.0–3.0 | 1.0–2.0 | 950 | $2,202 | $2.32 | 1d | 32 | 1.18mi |
| 1930 Frames Rd Dundalk, MD | 3.0 | 2.0 | 1152 | $2,099 | $1.82 | 4d | 1 | 1.24mi |
| 7109 Foundry St Dundalk, MD | 4.0 | 4.5 | 2080 | $3,200 | $1.54 | 43d | 1 | 1.32mi |
| 1917 Searles Rd Dundalk, MD | 3.0 | 1.5 | 1955 | $1,679 | $0.86 | 43d | 1 | 1.33mi |
| 1907 Penhall Rd Dundalk, MD | 3.0 | 2.0 | 1536 | $2,300 | $1.50 | 23d | 1 | 1.36mi |
| 6537 Baltimore Ave Baltimore, MD | 3.0 | 1.0 | 1272 | $1,700 | $1.34 | 2d | 1 | 1.40mi |
| 266 Saint Helena Ave Dundalk, MD | 3.0 | 1.0 | 1305 | $1,900 | $1.46 | 12d | 1 | 1.41mi |
| 1760 Langport Ave Dundalk, MD | 3.0 | 1.5 | 1600 | $1,795 | $1.12 | 43d | 1 | 1.48mi |
Listing history 5 events
-
2026-05-06$259,000 Active 747-char remark
-
2004-05-18soldstatus $79,900
-
2004-05-11soldstatus $79,900
-
2004-03-12historical
-
2004-03-01$79,900
ⓘ Source: listings_history table (triggers on properties + properties_extension) + one-shot
backfill from property_details.listing_events for pre-trigger history.
Tax reassessment forecast MD · Partial reset (capped growth)
- Current annual tax
- $3,642 · $303/mo
- Projected year-2 tax
- $3,642 · $303/mo
- Expected delta
- $0/yr ($0/mo · 0.0%)
ⓘ Screening estimate from a state-policy table — verify with the county assessor before closing.
Climate risk First Street
- Flood 6/10 Major FEMA zone X (unshaded) · 57% chance over 30 yrs
- Wildfire 1/10 Low
- Heat 8/10 Severe 7 d/yr ≥103°F today · 15 d/yr by 30 yrs out
- Wind 6/10 Major 63% chance of damaging wind over 30 yrs
- Air quality 5/10 Major 6 unhealthy d/yr today · 8 by 30 yrs out
Nearby sold comps map
Loading sold comps map…
Walkable amenities ~0.75 mi
Loading nearby amenities…
Taxation est. · year 1
- Rental income
- $26,762
- − Mortgage interest
- −$13,892
- − Property taxes
- −$3,642
- − Insurance
- −$1,240
- − Repairs & maintenance
- −$2,141
- − Management
- −$2,141
- − Depreciation
- −$7,215
- Taxable loss
- −$3,508
- Est. tax savings @ 24.0%
- +$842
- After-tax cash flow
- $1,496/yr
For passive investors: Depreciation is non-cash, so a rental often shows a tax loss while cash-flowing — sheltering income. Rental losses are passive: they offset passive income freely, and up to $25,000/yr can offset ordinary (W-2) income if you actively participate and your MAGI is under $100k (phasing out to $0 by $150k); unused losses carry forward. On sale, claimed depreciation is recaptured at up to 25%, and gains may owe capital-gains tax (a 1031 exchange can defer both). Figures are a year-1 estimate at your 24.0% rate — not tax advice; consult a CPA.
Schools (NCES district)
- District
- Baltimore County Public Schools
- NCES district ID
- 2400120
- Math proficiency
- 15% ▼ -16.00%
- Reading proficiency
- 34% ▼ -5.00%
- Median HH income
- $66,746
- Composite
- 23.17/100
- National rank
- #7948
- State rank
- #11 of 24 in MD
Livability — Dundalk
- Score
- 85/100
- State rank
- #16
- US rank
- #510
Category grades
Schools grade is shown separately in the Schools card above.
Census & demographics
- Census place
- Dundalk, MD
- County
- Baltimore County · 769,527 people
- City population
- 59,407
- Metro
- Baltimore-Columbia-Towson, MD
- Population (ZIP)
- 59,407
- Household income
- $64,141
- Rent vs Own
- Severe rent burden
- 2566.0
Population outlook (Baltimore County) Hauer SSP2
- Today (2025)
- 885,518 people
- By 2030
- 909,272 · +2.7%
- By 2040
- 951,547 · +7.5%
- By 2050
- 990,955 · +11.9%
- By 2075
- 1,086,411 · +22.7%
- By 2100
- 1,135,078 · +28.2%
Race, ethnicity, and origin ACS 2023
- Neighborhood character
- Diverse neighborhood (Simpson 0.60)
- Race & ethnicity
- White 59% Black 18% Hispanic / Latino 15% Two or more races 7% Asian 2% Native American 1%
- Hispanic origin (detail)
- Mexican 3% Puerto Rican 2%
- Common ancestry
- Romanian 7% Lithuanian 1% Italian 1%
- Foreign-born
- 9% · Canada
- Languages at home
- 85% English-only · Spanish 11% Other Indo-European 2% Arabic 1%
Political lean MEDSL · Baltimore
- 2024 margin
- Strong D (+24.5) · D 61.0% · R 36.5% · Other 2.5%
- 2008→2024 swing
- +9.9pp toward D · 2008: 14.6pp · 2024: 24.5pp
- All cycles
- 2024: D+24.5 2020: D+27.0 2016: D+17.4 2012: D+16.4 2008: D+14.6
Not yet ingested
- Civics
- —
Market trends
- HPI YoY
- ▼ -251.44%
- Current HPI
- 228.4218
- Rent YoY
- ▼ -0.09%
- Metro
- Baltimore-Columbia-Towson, MD
- State GDP YoY
- ▲ 2.97%
- F500 in state
- 12
Industry mix (Fortune 500 HQ in MD)
| Industry | F500 HQs | Revenue |
|---|---|---|
| Aerospace / Defense | 1 | $71B |
|
||
| Utilities | 1 | $25B |
|
||
| Hotels | 1 | $24B |
|
||
| Consumer Goods | 1 | $7B |
|
||
| Real Estate | 1 | $6B |
|
||
| Chemicals | 1 | $2B |
|
||
Price history
+210.4% since first listed7 events — show timeline
- 2026-05-28 Listing Removed — BRIGHT MLS
- 2026-05-22 Price Changed $248,000 BRIGHT MLS
- 2026-05-06 Listed $259,000 BRIGHT MLS
- 2004-05-18 Sold (Public Records) $79,900 Public Records
- 2004-05-11 Sold (MLS) $79,900 MRIS
- 2004-03-12 Delisted — MRIS
- 2004-03-01 Listed $79,900 MRIS
Property tax history
+1.6%/yrLatest (2025): $3,642 · +3.7% YoY. Source: county tax records.
Cash-flow waterfall
monthlySold comps — $/sqft
last 12 mo · ≤1 miLoading sold comps…