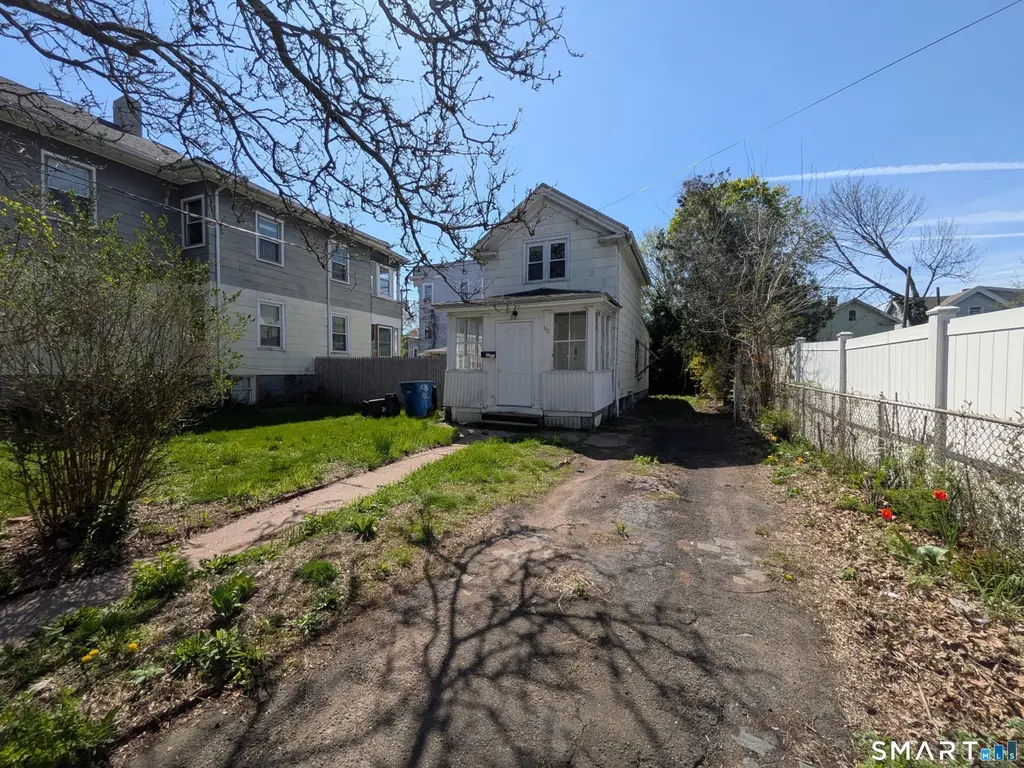
172 Carlisle St · New Haven, CT
Flood risk 1/10 · Minimal
- FEMA flood zone
- X (unshaded)
- Chance of flooding over 30 yrs
- 0.0%
- Est. flood insurance / yr
- $473 – $860
Fire risk 1/10 · Minimal
- Est. fire insurance / yr
- $829 – $1,539
Heat risk 7/10 · Major
- Hot days now (above 99°F)
- 7 days/yr
- Hot days in 30 yrs
- 16 days/yr
Wind risk 6/10 · Moderate
- Chance of severe wind over 30 yrs
- 58.0%
Air-quality risk 5/10 · Moderate
- Unhealthy air days now
- 6 days/yr
- Unhealthy air days in 30 yrs
- 8 days/yr
Risk factors via First Street. Map © Google.
Why this score? — see what drove the C grade
The composite is a weighted blend of 9 inputs, each scored 0–100. Each bar is that input's sub-score; the figure is the points it added to the 100-point composite (weight × sub-score).
- Cash flow +23.5/30.0
- Appreciation +9.9/10.0
- DSCR +7.6/10.0
- 1% rule +5.8/10.0
- Livability +4.0/5.0
- Rent growth +3.3/5.0
- Condition / age +2.5/5.0
- ARV discount +1.6/15.0
- Schools +1.5/10.0
$215,000
🖨 Deal sheet 📄 Offer letter ✓ Due diligence
Listing remarks
Welcome to 172 Carlisle Street in New Haven, a great opportunity to own a single-family home ideal for a first-time buyer or small family looking to put down roots. This 2-bedroom, 1-bath home offers a functional layout with plenty of natural light and is ready for your personal touch. The property is currently vacant, allowing for a smooth and flexible transition for its next owner. Step outside to a private backyard with the potential to be transformed into a beautiful outdoor space-perfect for entertaining, relaxing, or creating your own garden retreat. Conveniently located near major roads, downtown New Haven, and local amenities, this home combines affordability, accessibility, and opp
Key facts
- Vacant property
- Private backyard
- Near major roads
Tags
Property features AI
Exterior
- Parking: Paved driveway parking; 2 total parking spaces
- Utilities: Public water connected; Public sewer connected; Fuel tank located in basement
- Home design: Single-family home
- Construction: Frame construction; Asbestos siding; Asphalt shingle roof; Concrete foundation; White exterior color
- Exterior features: Level lot; Private paved driveway
Interior
- Kitchen: Oven/Range; Refrigerator
- Bedrooms: 2 bedrooms
- Bathrooms: 1 full bathroom
- Heating & cooling: Hot air heating; Natural gas and oil fuel options; 50-gallon hot water tank
- Interior features: 4 total rooms; Basement with crawl space, full finish and hatchway
- Laundry & utility: Laundry in basement / lower level
Neighborhood map
What this means for you Summary
Snapshot
- This is a 2-bed/1.0-bath single-family listed at $215k.
Deal economics
- At list price, monthly cash flow is $402 ($5k/yr) — positive.
- The deal already cash-flows at list — no discount required.
- Meets the 1% rule at list price ($2k rent vs $215k).
- Recommended offer: $209k (3.0% below list) — sets the bar for market timing.
- Cap rate 8.5% vs local median 4.8% in New Haven — top-decile yield for the area; either an underpriced asset or a hidden risk that comps aren't pricing in. Stress-test before assuming the spread holds.
Location & tenants
- Location reads 79/100 on livability (#31 in CT, #2,190 nationally) — a middle-class / working-renter tenant base. Strengths: amenities A+, commute A+, health & safety A+; Watch: employment D, crime F.
- New Haven School District (urban): math 12% / reading 25% proficiency, ranked #147 of 153 in CT (top 96%) — low school quality limits family demand, transient renter base, plan for 1-2y turnover; 66% free/reduced lunch — lower-income household profile, screen leases tightly.
- Zoned schools: Hill Central Music Academy (math 3% / reading 9%, grade F, #544 of 553 statewide, top 98%, 423 students, 86% FRL); Wilbur Cross High School (math 17% / reading 37%, grade F, #147 of 194 statewide, top 78%, 1,633 students, 76% FRL) — zoned schools average 81% FRL vs 66% district-wide (16 pts higher); higher-poverty schools than district average — tighter screening recommended.
- Market conditions: Rents rising (+3.3%/yr); 46 active listings in the ZIP; 40 comparable units currently listed for rent nearby; rentals at typical pace (median 15d on market — plan ~3-4 weeks tenant-placement turnaround); 1,059 units permitted in South Central Connecticut Planning Region in 2024 (779 in 5+ unit buildings).
- At $2,317/mo this rent would consume 56% of the median local household income ($50k/yr) (locally 1321% of renters already pay >50% of income on rent) — very limited rent-growth headroom before tenants either downsize or default.
Forward outlook
- In year one you build about $23k of equity ($1k loan paydown + $21k appreciation (9.8% local appreciation)).
- At projected returns (9.8% appreciation + 3.3% rent growth), your $60k cash investment doubles in ~3 years — after that, you're playing with house money.
- By year 2, paydown + projected appreciation supports a ~$36k cash-out refi (75% LTV) — recoverable capital for the next deal without selling this one.
Negotiation context
- It's been on market 46 days — a 3% lower offer ($209k) is reasonable based on typical stale-listing flexibility.
- Current owner paid $55k; list at $215k implies a 291% gain — meaningful room to come down on a strong offer.
Risks & watch-outs
- Watch-outs: built in 1900 — expect roof / HVAC / electrical / plumbing capex.
- Climate carrying-cost: major wind risk, 58% chance of damaging wind over 30y; extreme-heat days projected 7→16/yr by 2055 (HVAC capex compounding) — expect insurance premiums to compound above CPI over the hold.
Questions for the listing agent
- It's been on market 46 days. Have you received any prior offers? Is the seller open to a 3% concession, seller financing, or rate buy-down credit?
- Built in 1900 — when were the roof, HVAC, electrical panel, plumbing, and water heater last replaced?
- Is there a deadline driving the sale (1031 exchange, divorce, estate, relocation)? That informs how much negotiation room exists.
- Schools are D-rated, which usually means shorter tenancies and higher turnover. Who's the typical renter profile here, and what's been the actual vacancy rate?
- Crime grade is F in this area — have there been break-ins, vandalism, or insurance claims at this property in the last 3 years? What carrier currently insures it and at what premium?
- What's the average days-on-market for RENTAL listings here right now (not sales)? A rising rental-DOM trend means longer vacancies and softer asking-rent achievability than the comps imply.
- What's the recent tenant-quality profile in this submarket — average credit score on applications, eviction rate, late-payment / NSF rate, and stable-employment percentage? A property-management company in the area should have these aggregated.
- How much new for-sale + rental construction is in the pipeline within 1–3 miles? Heavy new supply typically softens prices + rents 12–24 months out; constrained supply supports both.
Investment metrics
- 1% rule
- 1.08% ✓
- Cap rate
- 8.54%
- Cash-on-cash
- 8.01%
- DSCR
- 1.36
- GRM
- 7.7
CMA / ARV
- ARV (median comp)
- $190,221
- List price
- $215,000
- Delta
- 13.03%
- Verdict
- OVERPRICED
- Comps
- 4 within 1.0 mi
Show comp detail 1 sale within ~0.75 mi
| Address | Dist | Beds/Ba | Sqft | Sold | Price | $/sf | Match |
|---|---|---|---|---|---|---|---|
| 28 Salem St | 0.03mi | 2/1.0 | 748 (+6%) | 7mo | $168,000 | $225 | 82 |
Match score weights: distance 35% · size 25% · config 20% · recency 20%. Top-matched comps best support the ARV.
Projected returns pro-forma
9.81% appreciation · 3.3% rent growth · sell at horizon
- IRR
- 29.9%
- Equity multiple
- 3.34×
- Total profit
- $140,603
- Equity at exit
- $190,709
- IRR
- 26.1%
- Equity multiple
- 7.56×
- Total profit
- $394,620
- Equity at exit
- $408,140
Cash invested: $60,200 (down + closing). Projections, not guarantees.
Landlord ↔ Tenant lean methodology
- Overall (STATE)
- 27 Tenant-Leaning
- State Connecticut
- 27 Tenant-Leaning · D+7
- County
- — inherits STATE
- City
- — inherits STATE
ZIP-level market 06519
- Home prices YoY
- 2.7%
- Rents YoY
- 3.3%
- Active inventory
- 46
- Price-to-rent
- 7.7×
Monthly cashflow live
- Estimated rent
- $2,317 high interval (Pro) →
- Mortgage (P&I)
- −$1,127
- Tax from tax record
- −$211 /mo · $2,536/yr
- Insurance
- −$90
- HOA
- −$0
- Vacancy / Maint / Mgmt
- −$487
- Net cashflow
- $402
Break-even live
UW: 25.0% down · 7.5% · 30yr · 1.5% tax · 5.0% vac · 8.0% maint · 8.0% mgmt
Financing live
Cash to close
- Down payment
- $53,750
- Closing costs
- $6,450
- Reserves months
- —
- Total cash needed
- —
Loan-product check · same deal, 3 products live
Conventional
25% down · 7.5% · 30yr
- Down + closing
- —
- Monthly P&I
- —
- Monthly cashflow
- —
- DSCR
- —
- Eligible?
- —
Personal DTI + credit; lowest rate.
DSCR
20% down · 8.5% · 30yr
- Down + closing
- —
- Monthly P&I
- —
- Monthly cashflow
- —
- DSCR
- —
- Eligible?
- —
No personal income docs; deal must DSCR.
Hard money
10% down · 12.0% · 12mo
- Down + closing
- —
- Monthly P&I
- —
- Monthly cashflow
- —
- DSCR
- —
- Eligible?
- —
Short-term bridge; refi at stabilization.
Rent comps 40 comps
| Address | Beds | Baths | Sqft | Rent | $/sqft | DOM | Units | Dist |
|---|---|---|---|---|---|---|---|---|
| 440 Howard Ave Unit 3 New Haven, CT | 1.0 | 1.0 | 648 | $1,500 | $2.31 | 43d | 1 | 0.20mi |
| 148 Rosette St New Haven, CT | 3.0 | 1.0 | 625 | $2,100 | $3.36 | 14d | 1 | 0.30mi |
| 69 Frank St Unit 1 New Haven, CT | 2.0 | 1.0 | 694 | $1,800 | $2.59 | 3d | 1 | 0.35mi |
| 69 Frank St Unit 3 New Haven, CT | 2.0 | 1.0 | 694 | $1,725 | $2.49 | 3d | 1 | 0.35mi |
| 9 Tower Ln New Haven, CT | 3.0 | 1.0–2.0 | 1054 | $4,345 | $4.12 | 2d | 74 | 0.38mi |
| 32 Redfield St Unit 2 New Haven, CT | 2.0 | 1.0 | 696 | $1,700 | $2.44 | 23d | 1 | 0.43mi |
| 32 Redfield St New Haven, CT | 2.0 | 1.0 | 620 | $1,750 | $2.82 | 43d | 1 | 0.43mi |
| 196 Crown St New Haven, CT | 1.0–3.0 | 1.0 | 993 | $2,225 | $2.24 | 2d | 2 | 0.67mi |
| 90 Crown St New Haven, CT | 2.0 | 1.0–2.0 | 780 | $2,435 | $3.12 | 43d | 7 | 0.68mi |
| 274 Crown St New Haven, CT | 2.0 | 1.0–2.5 | 1155 | $4,279 | $3.70 | 3d | 28 | 0.71mi |
| 152 Temple St New Haven, CT | 1.0 | 1.0 | 632 | $2,877 | $4.55 | 3d | 1 | 0.73mi |
| 20 Fair St New Haven, CT | 2.0 | 1.0–2.0 | 921 | $3,985 | $4.32 | 2d | 146 | 0.74mi |
| 37 Center St New Haven, CT | 1.0 | 1.0 | 675 | $2,450 | $3.63 | 43d | 3 | 0.74mi |
| 271 Crown St Unit 271-1 New Haven, CT | 1.0 | 1.0 | 550 | $1,695 | $3.08 | 19d | 1 | 0.74mi |
| 87 Union St New Haven, CT | 4.0 | 1.0–4.0 | 959 | $3,519 | $3.67 | 3d | 16 | 0.78mi |
| 32 High St New Haven, CT | 1.0 | 1.0 | 415 | $2,562 | $6.17 | 21d | 10 | 0.78mi |
| 265 College St New Haven, CT | 2.0 | 1.0–1.5 | 821 | $3,355 | $4.09 | 2d | 62 | 0.79mi |
| 804 Chapel St Unit 203 New Haven, CT | 1.0 | 1.0 | 700 | $2,000 | $2.86 | 3d | 1 | 0.79mi |
| 804 Chapel St Unit 302 New Haven, CT | 1.0 | 1.0 | 700 | $2,000 | $2.86 | 23d | 1 | 0.79mi |
| 270 College St Unit 3 New Haven, CT | 1.0 | 1.0 | 400 | $2,000 | $5.00 | 14d | 1 | 0.79mi |
| 360 State St New Haven, CT | 3.0 | 1.0–2.0 | 907 | $3,975 | $4.38 | 2d | 63 | 0.82mi |
| 129 Church St New Haven, CT | 1.0 | 1.0 | 455 | $1,875 | $4.12 | 23d | 1 | 0.83mi |
| 630 Chapel St New Haven, CT | 2.0 | 1.0–2.0 | 827 | $3,668 | $4.44 | 3d | 21 | 0.83mi |
| 122 Court St Unit 406 New Haven, CT | 2.0 | 1.0 | 750 | $2,350 | $3.13 | 43d | 1 | 0.87mi |
| 199 Wooster St New Haven, CT | 1.0 | 1.0 | 772 | $1,772 | $2.29 | 23d | 2 | 0.89mi |
| 105 Court St New Haven, CT | 1.0 | 1.0 | 583 | $2,160 | $3.70 | 14d | 7 | 0.89mi |
| 202 Park St Unit 1 New Haven, CT | 1.0 | 1.0 | 650 | $1,695 | $2.61 | 14d | 1 | 0.92mi |
| 98 Olive St New Haven, CT | 1.0–2.0 | 1.0 | 708 | $2,495 | $3.52 | 14d | 3 | 0.94mi |
| 5 Gilbert Ave Unit 3 New Haven, CT | 2.0 | 1.0 | 650 | $1,700 | $2.62 | 3d | 1 | 0.95mi |
| 541 Chapel St Unit B New Haven, CT | 1.0 | 1.5 | 709 | $1,750 | $2.47 | 21d | 1 | 1.00mi |
| 120 Wooster St Unit P New Haven, CT | 1.0 | 1.0 | 490 | $1,450 | $2.96 | 2d | 1 | 1.01mi |
| 43 Chestnut St New Haven, CT | 1.0 | 1.0 | 695 | $1,925 | $2.77 | 23d | 1 | 1.01mi |
| 43 Chestnut St #307 New Haven, CT | 1.0 | 1.0 | 585 | $1,890 | $3.23 | 14d | 1 | 1.01mi |
| 284 Orange St Unit 204 New Haven, CT | 1.0 | 1.0 | 749 | $2,200 | $2.94 | 21d | 1 | 1.03mi |
| 98 Howe St New Haven, CT | 1.0 | 1.0 | 420 | $1,700 | $4.05 | 14d | 1 | 1.04mi |
| 98 Howe St Unit 5 New Haven, CT | 1.0 | 1.0 | 700 | $1,800 | $2.57 | 23d | 1 | 1.04mi |
| 227 Church St New Haven, CT | 2.0 | 1.0–2.0 | 742 | $4,095 | $5.52 | 3d | 26 | 1.05mi |
| 104 Howe St New Haven, CT | 2.0 | 1.0–2.0 | 732 | $3,295 | $4.50 | 11d | 7 | 1.05mi |
| 245 Dwight St Unit 2 New Haven, CT | 1.0 | 1.0 | 550 | $1,900 | $3.45 | 43d | 1 | 1.11mi |
| 260 Dwight St New Haven, CT | 1.0–3.0 | 1.0 | 655 | $2,325 | $3.55 | 19d | 1 | 1.16mi |
Listing history 17 events
-
2026-06-18days on market $215,000 Active 46 DOM
-
2026-06-17days on market $215,000 Active 45 DOM
-
2026-06-16days on market $215,000 Active 44 DOM
-
2026-06-15days on market $215,000 Active 43 DOM
-
2026-06-14days on market $215,000 Active 41 DOM
-
2026-06-13days on market $215,000 Active 40 DOM
-
2026-06-10days on market $215,000 Active 38 DOM
-
2026-06-09days on market $215,000 Active 37 DOM
-
2026-06-08days on market $215,000 Active 36 DOM
-
2026-06-07days on market $215,000 Active 35 DOM
-
2026-06-05days on market $215,000 Active 32 DOM
-
2026-06-03days on market $215,000 Active 31 DOM
-
2026-06-03days on market $215,000 Active 30 DOM
-
2026-06-01days on market $215,000 Active 29 DOM
-
2026-05-31days on market $215,000 Active 28 DOM
-
2026-04-24$215,000 Active 842-char remark
-
1987-05-05soldstatus $55,000
ⓘ Source: listings_history table (triggers on properties + properties_extension) + one-shot
backfill from property_details.listing_events for pre-trigger history.
Tax reassessment forecast CT · Partial reset (capped growth)
- Current annual tax
- $2,536 · $211/mo
- Projected year-2 tax
- $3,568 · $297/mo
- Expected delta
- +$1,032/yr (+$86/mo · 40.7%)
ⓘ Screening estimate from a state-policy table — verify with the county assessor before closing.
Climate risk First Street
- Flood 1/10 Low FEMA zone X (unshaded) · 0% chance over 30 yrs
- Wildfire 1/10 Low
- Heat 7/10 Severe 7 d/yr ≥99°F today · 16 d/yr by 30 yrs out
- Wind 6/10 Major 58% chance of damaging wind over 30 yrs
- Air quality 5/10 Major 6 unhealthy d/yr today · 8 by 30 yrs out
Nearby sold comps map
Loading sold comps map…
Walkable amenities ~0.75 mi
Loading nearby amenities…
Taxation est. · year 1
- Rental income
- $27,805
- − Mortgage interest
- −$12,043
- − Property taxes
- −$2,536
- − Insurance
- −$1,075
- − Repairs & maintenance
- −$2,224
- − Management
- −$2,224
- − Depreciation
- −$6,255
- Taxable income
- $1,447
- Est. tax owed @ 24.0%
- −$347
- After-tax cash flow
- $4,478/yr
For passive investors: Depreciation is non-cash, so a rental often shows a tax loss while cash-flowing — sheltering income. Rental losses are passive: they offset passive income freely, and up to $25,000/yr can offset ordinary (W-2) income if you actively participate and your MAGI is under $100k (phasing out to $0 by $150k); unused losses carry forward. On sale, claimed depreciation is recaptured at up to 25%, and gains may owe capital-gains tax (a 1031 exchange can defer both). Figures are a year-1 estimate at your 24.0% rate — not tax advice; consult a CPA.
Schools (NCES district)
- District
- New Haven School District
- NCES district ID
- 0902790
- Math proficiency
- 12% ▼ -10.00%
- Reading proficiency
- 25% ▼ -10.00%
- Median HH income
- $38,058
- Composite
- 15.48/100
- National rank
- #9308
- State rank
- #147 of 153 in CT
Livability — New Haven
- Score
- 79/100
- State rank
- #31
- US rank
- #2190
Category grades
Schools grade is shown separately in the Schools card above.
Census & demographics
- Census place
- New Haven, CT
- County
- New Haven County · 688,236 people
- City population
- 132,813
- Metro
- New Haven-Milford, CT
- Population (ZIP)
- 15,605
- Household income
- $49,619
- Rent vs Own
- Severe rent burden
- 1321.0
Population outlook (South Central Connecticut County) Hauer SSP2
- By 2040
- 608,362
Race, ethnicity, and origin ACS 2023
- Neighborhood character
- Diverse neighborhood (Simpson 0.67)
- Race & ethnicity
- Hispanic / Latino 49% Black 26% White 15% Two or more races 13% Asian 4% Native American 1%
- Hispanic origin (detail)
- Mexican 15% Puerto Rican 25% Dominican 3%
- Common ancestry
- Romanian 1% Lithuanian 1%
- Foreign-born
- 25% · Canada, Jamaica, China
- Languages at home
- 50% English-only · Spanish 42% Other Indo-European 4% Arabic 1%
Political lean MEDSL · South Central Connecticut
- 2024 margin
- Strong D (+20.1) · D 59.0% · R 38.9% · Other 2.1%
- All cycles
- 2024: D+20.1
Not yet ingested
- Civics
- —
Market trends
- HPI YoY
- ▲ 9.81%
- Current HPI
- 377.4885
- Rent YoY
- ▲ 3.30%
- Metro
- New Haven-Milford, CT
- State GDP YoY
- ▲ 1.06%
- F500 in state
- 38
Industry mix (Fortune 500 HQ in CT)
| Industry | F500 HQs | Revenue |
|---|---|---|
| Industrial Machinery | 4 | $38B |
|
||
| Insurance | 3 | $71B |
|
||
| Financial Services | 2 | $25B |
|
||
| Transportation / Logistics | 2 | $18B |
|
||
| Healthcare | 1 | $247B |
|
||
| Telecommunications | 1 | $55B |
|
||
Price history
+290.9% since first listed2 events — show timeline
- 2026-04-24 Listed $215,000 Smart MLS
- 1987-05-05 Sold (Public Records) $55,000 Public Records
Property tax history
+4.4%/yrLatest (2023): $2,536 · -6.4% YoY. Source: county tax records.
Cash-flow waterfall
monthlySold comps — $/sqft
last 12 mo · ≤1 miLoading sold comps…