276 Ledgemere Pt · Castleton Four Corners, VT
Flood risk 1/10 · Minimal
- FEMA flood zone
- X (unshaded)
- Chance of flooding over 30 yrs
- 0.0%
- Est. flood insurance / yr
- $473 – $860
Fire risk 3/10 · Minor
- Est. fire insurance / yr
- $480 – $892
Heat risk 2/10 · Minimal
- Hot days now (above 93°F)
- 7 days/yr
- Hot days in 30 yrs
- 17 days/yr
Wind risk 2/10 · Minimal
- Chance of severe wind over 30 yrs
- 2.0%
Air-quality risk 1/10 · Minimal
- Unhealthy air days now
- 0 days/yr
- Unhealthy air days in 30 yrs
- 0 days/yr
Risk factors via First Street. Map © Google.
Why this score? — see what drove the B+ grade
The composite is a weighted blend of 9 inputs, each scored 0–100. Each bar is that input's sub-score; the figure is the points it added to the 100-point composite (weight × sub-score).
- Cash flow +30.0/30.0
- 1% rule +10.0/10.0
- DSCR +10.0/10.0
- Appreciation +8.1/10.0
- ARV discount +7.5/15.0
- Schools +5.0/10.0
- Rent growth +2.5/5.0
- Livability +2.5/5.0
- Condition / age +2.5/5.0
$149,900
🖨 Deal sheet 📄 Offer letter ✓ Due diligence
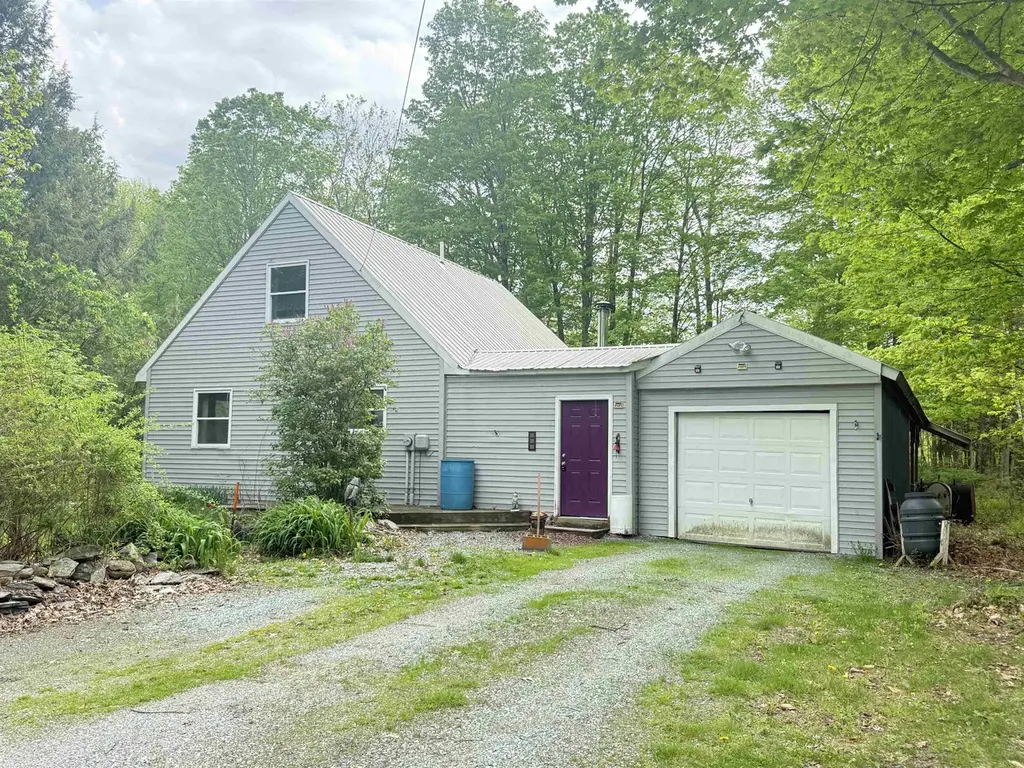
Listing remarks
Enjoy Lake Bomoseen views from this 2-bedroom, 2-bath Cape-style home situated on a quiet private road in Hubbardton. Built in 2003 and offering 1,248 sq. ft. of living space, this home features a practical layout, sound structure, yard space, convenient on-site parking, a drilled well, and septic already in place. Shared dock space is located just down and across the street, providing an excellent opportunity to enjoy the lake lifestyle without being directly waterfront. The property is ready for cosmetic improvements, making it a great option for buyers looking to personalize a home, build equity, or create their ideal Vermont getaway. Whether you’re seeking a full-time residence, s
Key facts
- Quiet private road
- Shared dock space
- Lake access
Tags
Property features AI
Exterior
- Parking: Dirt and gravel driveway
- Utilities: Drilled well; On-site septic; Circuit breaker electrical service; High-speed internet available; Cable and telephone available
- Home design: Cape-style home; Existing construction; Facing information not provided; Entry level information not provided
- Construction: Built in 2003; Wood frame construction with vinyl siding; Metal roof; Basement crawl space (unfinished) with walkout access
- Exterior features: Lake access (cross a street to access); Dock access; Lake view / Water view; Mountain view; Wooded setting; Walking trails nearby; Near ATV trail; Near paths
Interior
- Kitchen: Dishwasher; Warming drawer
- Bedrooms: Two bedrooms (both on the main level)
- Flooring: Carpet; Laminate
- Bathrooms: One full bathroom (main level); One half bathroom (main level)
- Heating & cooling: Oil heating with baseboard hot water
- Interior features: Mudroom; Living room; Dining room; Kitchen; 8 total rooms
Neighborhood map
What this means for you Summary
Snapshot
- This is a 2-bed/1.5-bath manufactured listed at $150k.
Deal economics
- At list price, monthly cash flow is $1k ($13k/yr) — positive.
- The deal already cash-flows at list — no discount required.
- Meets the 1% rule at list price ($3k rent vs $150k).
Location & tenants
- Location reads: area grade B — affects rentability + tenant quality, not the cash-flow math above.
- Market conditions: 7 active listings in the ZIP; 90 units permitted in Rutland County in 2024 (0 in 5+ unit buildings).
Forward outlook
- In year one you build about $10k of equity ($1k loan paydown + $9k appreciation (6.1% local appreciation)).
- Rutland County population projected at -28% by 2050 — secular population decline; favor cash flow + early exit over multi-decade hold.
- At projected returns (6.1% appreciation + 3.0% rent growth), your $42k cash investment doubles in ~2 years — after that, you're playing with house money.
- By year 4, paydown + projected appreciation supports a ~$35k cash-out refi (75% LTV) — recoverable capital for the next deal without selling this one.
Negotiation context
- Only 5 days on market — expect competitive offers; lowballing is unlikely to land.
Questions for the listing agent
- Is there a deadline driving the sale (1031 exchange, divorce, estate, relocation)? That informs how much negotiation room exists.
- What's the average days-on-market for RENTAL listings here right now (not sales)? A rising rental-DOM trend means longer vacancies and softer asking-rent achievability than the comps imply.
- What's the recent tenant-quality profile in this submarket — average credit score on applications, eviction rate, late-payment / NSF rate, and stable-employment percentage? A property-management company in the area should have these aggregated.
- How much new for-sale + rental construction is in the pipeline within 1–3 miles? Heavy new supply typically softens prices + rents 12–24 months out; constrained supply supports both.
Investment metrics
- 1% rule
- 1.82% ✓
- Cap rate
- 14.88%
- Cash-on-cash
- 30.67%
- DSCR
- 2.36
- GRM
- 4.6
CMA / ARV
No comps found within radius.
Projected returns pro-forma
6.14% appreciation · 3.0% rent growth · sell at horizon
- IRR
- 41.7%
- Equity multiple
- 3.69×
- Total profit
- $112,881
- Equity at exit
- $95,511
- IRR
- 38.7%
- Equity multiple
- 7.63×
- Total profit
- $278,362
- Equity at exit
- $174,318
Cash invested: $41,972 (down + closing). Projections, not guarantees.
Landlord ↔ Tenant lean methodology
- Overall (STATE)
- 41 Moderately Tenant-Leaning
- State Vermont
- 41 Moderately Tenant-Leaning · D+15
- County
- — inherits STATE
- City
- — inherits STATE
ZIP-level market 05732
- Home prices YoY
- 1.9%
- Active inventory
- 7
- Price-to-rent
- 4.6×
Monthly cashflow live
- Estimated rent
- $2,732 medium interval (Pro) →
- Mortgage (P&I)
- −$786
- Tax from tax record
- −$237 /mo · $2,848/yr
- Insurance
- −$62
- HOA
- −$0
- Vacancy / Maint / Mgmt
- −$574
- Net cashflow
- $1,073
Break-even live
UW: 25.0% down · 7.5% · 30yr · 1.5% tax · 5.0% vac · 8.0% maint · 8.0% mgmt
Financing live
Cash to close
- Down payment
- $37,475
- Closing costs
- $4,497
- Reserves months
- —
- Total cash needed
- —
Loan-product check · same deal, 3 products live
Conventional
25% down · 7.5% · 30yr
- Down + closing
- —
- Monthly P&I
- —
- Monthly cashflow
- —
- DSCR
- —
- Eligible?
- —
Personal DTI + credit; lowest rate.
DSCR
20% down · 8.5% · 30yr
- Down + closing
- —
- Monthly P&I
- —
- Monthly cashflow
- —
- DSCR
- —
- Eligible?
- —
No personal income docs; deal must DSCR.
Hard money
10% down · 12.0% · 12mo
- Down + closing
- —
- Monthly P&I
- —
- Monthly cashflow
- —
- DSCR
- —
- Eligible?
- —
Short-term bridge; refi at stabilization.
Listing history 1 events
-
2026-05-20$149,900 Active
ⓘ Source: listings_history table (triggers on properties + properties_extension) + one-shot
backfill from property_details.listing_events for pre-trigger history.
Tax reassessment forecast VT · Partial reset (capped growth)
- Current annual tax
- $2,848 · $237/mo
- Projected year-2 tax
- $2,848 · $237/mo
- Expected delta
- $0/yr ($0/mo · 0.0%)
ⓘ Screening estimate from a state-policy table — verify with the county assessor before closing.
Climate risk First Street
- Flood 1/10 Low FEMA zone X (unshaded) · 0% chance over 30 yrs
- Wildfire 3/10 Moderate
- Heat 2/10 Low 7 d/yr ≥93°F today · 17 d/yr by 30 yrs out
- Wind 2/10 Low 2% chance of damaging wind over 30 yrs
- Air quality 1/10 Low 0 unhealthy d/yr today · 0 by 30 yrs out
Nearby sold comps map
Loading sold comps map…
Walkable amenities ~0.75 mi
Loading nearby amenities…
Taxation est. · year 1
- Rental income
- $32,790
- − Mortgage interest
- −$8,397
- − Property taxes
- −$2,848
- − Insurance
- −$750
- − Repairs & maintenance
- −$2,623
- − Management
- −$2,623
- − Depreciation
- −$4,361
- Taxable income
- $11,189
- Est. tax owed @ 24.0%
- −$2,685
- After-tax cash flow
- $10,188/yr
For passive investors: Depreciation is non-cash, so a rental often shows a tax loss while cash-flowing — sheltering income. Rental losses are passive: they offset passive income freely, and up to $25,000/yr can offset ordinary (W-2) income if you actively participate and your MAGI is under $100k (phasing out to $0 by $150k); unused losses carry forward. On sale, claimed depreciation is recaptured at up to 25%, and gains may owe capital-gains tax (a 1031 exchange can defer both). Figures are a year-1 estimate at your 24.0% rate — not tax advice; consult a CPA.
Schools (NCES district)
No district data.
Livability — Castleton Four Corners
No livability data for this city. (Only ~50 U.S. cities are tracked.)
Census & demographics
- Population (ZIP)
- 1,229
Population outlook (Rutland County) Hauer SSP2
- Today (2025)
- 55,307 people
- By 2030
- 52,364 · -5.3%
- By 2040
- 45,751 · -17.3%
- By 2050
- 39,627 · -28.4%
- By 2075
- 29,080 · -47.4%
- By 2100
- 20,673 · -62.6%
Race, ethnicity, and origin ACS 2023
- Neighborhood character
- Predominantly White (97%)
- Race & ethnicity
- White 97% Two or more races 3%
- Common ancestry
- Lithuanian 31% Romanian 7% Scandinavian 2%
- Foreign-born
- 1%
- Languages at home
- 97% English-only · Spanish 3%
Political lean MEDSL · Rutland
- 2024 margin
- Lean D (+5.3) · D 51.3% · R 46.0% · Other 2.7%
- 2008→2024 swing
- -19.3pp toward R · 2008: 24.6pp · 2024: 5.3pp
- All cycles
- 2024: D+5.3 2020: D+10.5 2016: D+4.2 2012: D+22.0 2008: D+24.6
Not yet ingested
- Civics
- —
Market trends
- HPI YoY
- ▲ 6.14%
- Current HPI
- 329.7223
- Rent YoY
- —
- Metro
- —
- State GDP YoY
- —
- F500 in state
- 0
Price history
1 event — show timeline
- 2026-05-20 Listed $149,900 PrimeMLS
Property tax history
+2.9%/yrLatest (2024): $2,848 · +11.0% YoY. Source: county tax records.
Cash-flow waterfall
monthlySold comps — $/sqft
last 12 mo · ≤1 miLoading sold comps…