 Duplex
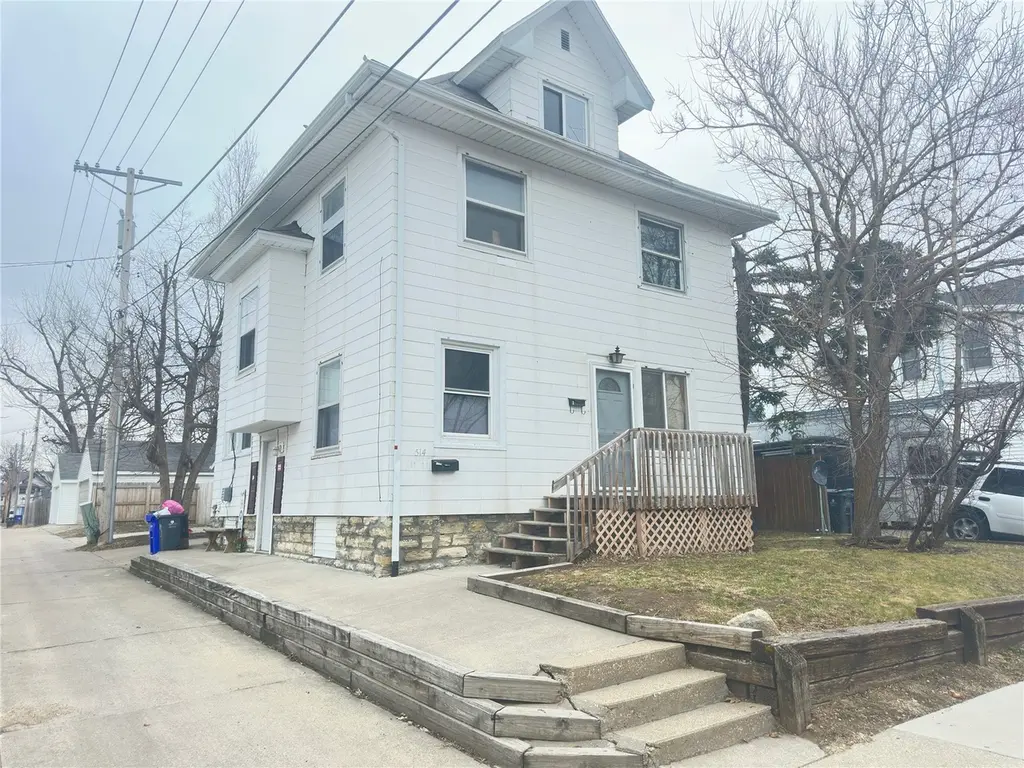
514 16th St St NE · Cedar Rapids, IA
Flood risk 1/10 · Minimal
- FEMA flood zone
- X (unshaded)
- Chance of flooding over 30 yrs
- 0.0%
- Est. flood insurance / yr
- $473 – $860
Fire risk 1/10 · Minimal
- Est. fire insurance / yr
- $902 – $1,676
Heat risk 3/10 · Minor
- Hot days now (above 104°F)
- 7 days/yr
- Hot days in 30 yrs
- 15 days/yr
Wind risk 2/10 · Minimal
- Chance of severe wind over 30 yrs
- —
Air-quality risk 2/10 · Minimal
- Unhealthy air days now
- 0 days/yr
- Unhealthy air days in 30 yrs
- 1 days/yr
Risk factors via First Street. Map © Google.
Why this score? — see what drove the B+ grade
The composite is a weighted blend of 9 inputs, each scored 0–100. Each bar is that input's sub-score; the figure is the points it added to the 100-point composite (weight × sub-score).
- Cash flow +30.0/30.0
- ARV discount +10.2/15.0
- 1% rule +10.0/10.0
- DSCR +10.0/10.0
- Rent growth +5.0/5.0
- Schools +4.7/10.0
- Livability +3.9/5.0
- Condition / age +2.5/5.0
- Appreciation +0.0/10.0
$130,000
🖨 Deal sheet 📄 Offer letter ✓ Due diligence
Multi-family units
County records classify this as Multi-Family (2-4 Unit). Listing-text estimate: 2 units. confirmed
Listing remarks MLS
This duplex is being offered at an estimated 12% cap rate based on current income and expenses, supported by city averages and signed leases. The property is currently configured as one year-leased 4-bedroom unit (leased at $1575 non subsidized) and one efficiency unit (leased at $525), which has been there for 10+ years, but could easily be converted into one 2-bedroom unit and one 2–3 bedroom unit. The unfinished attic also provides additional potential for future living space. The property sits well with excellent natural water drainage. Conveniently located close to downtown, two colleges, and highway access, making tenant demand strong and vacancy concerns minimal. Total gross income totals $25,200, with expenses totalling $9258. Currently, all utilities are in the owner's name, but could be split up to reduce expenses.
Key facts
- Highway access
- Unfinished attic
- Close to downtown
Tags
Neighborhood map
What this means for you Summary
Snapshot
- This is a 1×4bd/1ba + 1×1bd/1ba units multifamily listed at $130k.
Deal economics
- At list price, monthly cash flow is $1k ($13k/yr) — positive. Per door: $530/mo.
- The deal already cash-flows at list — no discount required.
- Meets the 1% rule at list price ($2k rent vs $130k).
- Recommended offer: $118k (9.0% below list) — sets the bar for market timing.
- Cap rate 16.1% vs local median 3.5% in Cedar Rapids — top-decile yield for the area; either an underpriced asset or a hidden risk that comps aren't pricing in. Stress-test before assuming the spread holds.
Location & tenants
- Location reads 78/100 on livability (#134 in IA, #2,474 nationally) — a middle-class / working-renter tenant base. Strengths: cost of living A+, housing A+, health & safety A+; Watch: crime C-, commute F.
- Cedar Rapids Community School District (urban): math 50% / reading 59% proficiency, ranked #265 of 289 in IA (top 92%) — acceptable for families but not a draw, mixed tenant base, ~2y average lease.
- Market conditions: Rents rising fast (+11.0%/yr); 286 active listings in the ZIP; 7 comparable units currently listed for rent nearby; rentals lingering (median 44d on market — plan ~5-8 weeks vacancy on turnover, expect pricing pressure); 57% of comp listings sitting > 30 days — soft ceiling on asking rent; 1,023 units permitted in Linn County in 2024 (456 in 5+ unit buildings).
- This rent runs 40% of the median local income ($73k/yr) — at the standard rent-burdened threshold; future hikes will face affordability resistance.
Forward outlook
- Local home prices are declining (-3.0%/yr); year-one equity from $899 of loan paydown is wiped out by about $4k of value loss. Plan a longer hold.
- Linn County population projected at +16% by 2050 — long-run rental-demand tailwind backs the buy-and-hold thesis.
- At projected returns (-3.0% appreciation + 8.0% rent growth), your $36k cash investment doubles in ~4 years — after that, you're playing with house money.
Negotiation context
- It's been on market 100 days — a 9% lower offer ($118k) is reasonable based on typical stale-listing flexibility.
- 2 sale attempts since 2y ago with the ask held roughly flat each time — persistent listings suggest the price (not the market) is what's stuck; bring a comps-based counter.
- Current owner paid $100k; 30% above their basis — modest negotiation headroom, anchor on the comps not their cost.
Risks & watch-outs
- Watch-outs: built in 1910 — expect roof / HVAC / electrical / plumbing capex.
Questions for the listing agent
- It's been on market 100 days. Have you received any prior offers? Is the seller open to a 9% concession, seller financing, or rate buy-down credit?
- Can we see the unit-by-unit rent roll, current vacancy, and any below-market leases? What's the average tenancy length?
- What capital expenditures (roof, boiler, parking lot, exteriors) have been made in the last 5 years, and what's planned in the next 2?
- Built in 1910 — when were the roof, HVAC, electrical panel, plumbing, and water heater last replaced?
- Why hasn't it sold? Are there any deal-killer items the seller is aware of (foundation, flood, title, zoning, code violations)?
- Is there a deadline driving the sale (1031 exchange, divorce, estate, relocation)? That informs how much negotiation room exists.
- Schools are B-rated — typically a magnet for longer-tenancy family renters. What's the average tenant stay here, and is there a school-zone premium baked into asking?
- What's the average days-on-market for RENTAL listings here right now (not sales)? A rising rental-DOM trend means longer vacancies and softer asking-rent achievability than the comps imply.
- What's the recent tenant-quality profile in this submarket — average credit score on applications, eviction rate, late-payment / NSF rate, and stable-employment percentage? A property-management company in the area should have these aggregated.
- How much new apartment / multifamily construction is in the pipeline within 1–3 miles? Heavy new supply (>2% of stock underway) typically softens rents 12–24 months out; light construction supports rent growth.
Investment metrics
- 1% rule
- 1.89% ✓
- Cap rate
- 16.08%
- Cash-on-cash
- 34.96%
- DSCR
- 2.56
- GRM
- 4.4
CMA / ARV
- ARV (median comp)
- $138,386
- List price
- $130,000
- Delta
- -6.06%
- Verdict
- FAIR
- Comps
- 20 within 1.0 mi
Projected returns pro-forma
-3.0% appreciation · 8.0% rent growth · sell at horizon
- IRR
- 36.0%
- Equity multiple
- 2.63×
- Total profit
- $59,477
- Equity at exit
- $19,383
- IRR
- 45.2%
- Equity multiple
- 6.44×
- Total profit
- $197,899
- Equity at exit
- $11,240
Cash invested: $36,400 (down + closing). Projections, not guarantees.
Landlord ↔ Tenant lean methodology
- Overall (STATE)
- 83 Strongly Landlord-Friendly
- State Iowa
- 83 Strongly Landlord-Friendly · R+6
- County
- — inherits STATE
- City
- — inherits STATE
ZIP-level market 52402
- Rents YoY
- 11.0%
- Active inventory
- 286
- Price-to-rent
- 7.0×
Monthly cashflow live
- Estimated rent
- $2,454 medium interval (Pro) →
- Mortgage (P&I)
- −$682
- Tax from tax record
- −$142 /mo · $1,706/yr
- Insurance
- −$54
- HOA
- −$0
- Vacancy / Maint / Mgmt
- −$515
- Net cashflow
- $1,061
Break-even live
2-unit breakdown (identical units grouped — click to expand)
| Units | Beds | Baths | Est. rent |
|---|---|---|---|
| 1× unit | 4 | 1 | $1,550 |
| 1× unit | 1 | 1 | $904 |
| Total (2 units) | $2,454 | ||
UW: 25.0% down · 7.5% · 30yr · 1.5% tax · 5.0% vac · 8.0% maint · 8.0% mgmt
Financing live
Cash to close
- Down payment
- $32,500
- Closing costs
- $3,900
- Reserves months
- —
- Total cash needed
- —
Loan-product check · same deal, 3 products live
Conventional
25% down · 7.5% · 30yr
- Down + closing
- —
- Monthly P&I
- —
- Monthly cashflow
- —
- DSCR
- —
- Eligible?
- —
Personal DTI + credit; lowest rate.
DSCR
20% down · 8.5% · 30yr
- Down + closing
- —
- Monthly P&I
- —
- Monthly cashflow
- —
- DSCR
- —
- Eligible?
- —
No personal income docs; deal must DSCR.
Hard money
10% down · 12.0% · 12mo
- Down + closing
- —
- Monthly P&I
- —
- Monthly cashflow
- —
- DSCR
- —
- Eligible?
- —
Short-term bridge; refi at stabilization.
Rent comps 7 comps
| Address | Beds | Baths | Sqft | Rent | $/sqft | DOM | Units | Dist |
|---|---|---|---|---|---|---|---|---|
| 511 23rd St NE Cedar Rapids, IA | 2.0 | 1.0 | 888 | $1,500 | $1.69 | 43d | 1 | 0.77mi |
| 1220 Sierra Dr NE Cedar Rapids, IA | 1.0–2.0 | 1.0–2.0 | 985 | $1,000 | $1.02 | 43d | 1 | 0.99mi |
| 730 Wellington St SE Cedar Rapids, IA | 3.0 | 1.0 | 1366 | $1,325 | $0.97 | 21d | 1 | 1.05mi |
| 906 10th St SE Cedar Rapids, IA | 1.0–2.0 | 1.0–2.0 | 890 | $1,300 | $1.46 | 13d | 6 | 1.11mi |
| 1017 19th St SE Cedar Rapids, IA | 3.0 | 1.0 | 946 | $1,100 | $1.16 | 43d | 1 | 1.35mi |
| 1127 34th St NE Cedar Rapids, IA | 3.0 | 2.0 | 1152 | $1,385 | $1.20 | 43d | 1 | 1.37mi |
| 306 29th Street Dr SE Cedar Rapids, IA | 2.0 | 1.0 | 1100 | $850 | $0.77 | 21d | 1 | 1.48mi |
Listing history 22 events
-
2026-06-17days on market $130,000 Active 100 DOM
-
2026-06-16days on market $130,000 Active 99 DOM
-
2026-06-15days on market $130,000 Active 98 DOM
-
2026-06-14days on market $130,000 Active 96 DOM
-
2026-06-13days on market $130,000 Active 95 DOM
-
2026-06-10days on market $130,000 Active 93 DOM
-
2026-06-09days on market $130,000 Active 92 DOM
-
2026-06-08days on market $130,000 Active 91 DOM
-
2026-06-07days on market $130,000 Active 90 DOM
-
2026-06-05days on market $130,000 Active 87 DOM
-
2026-06-03days on market $130,000 Active 86 DOM
-
2026-06-02days on market $130,000 Active 85 DOM
-
2026-06-01days on market $130,000 Active 84 DOM
-
2026-05-31days on market $130,000 Active 83 DOM
-
2026-05-30days on market $130,000 Active 82 DOM
-
2026-03-09$130,000 Active 842-char remark
Show marketing remark (842 chars)
This duplex is being offered at an estimated 12% cap rate based on current income and expenses, supported by city averages and signed leases. The property is currently configured as one year-leased 4-bedroom unit (leased at $1575 non subsidized) and one efficiency unit (leased at $525), which has been there for 10+ years, but could easily be converted into one 2-bedroom unit and one 2–3 bedroom unit. The unfinished attic also provides additional potential for future living space. The property sits well with excellent natural water drainage. Conveniently located close to downtown, two colleges, and highway access, making tenant demand strong and vacancy concerns minimal. Total gross income totals $25,200, with expenses totalling $9258. Currently, all utilities are in the owner's name, but could be split up to reduce expenses.
-
2024-09-11soldstatus $100,000
-
2024-09-04soldstatus $100,000 Closed 124-char remark
Show marketing remark (124 chars)
Both units have long-term renters, 24+ hours notice to show. 1st Level Efficiency $475/month, Upstairs 3-Bedroom $850/month.
-
2024-08-04status Pending 124-char remark
Show marketing remark (124 chars)
Both units have long-term renters, 24+ hours notice to show. 1st Level Efficiency $475/month, Upstairs 3-Bedroom $850/month.
-
2024-07-31price $102,000 124-char remark
Show marketing remark (124 chars)
Both units have long-term renters, 24+ hours notice to show. 1st Level Efficiency $475/month, Upstairs 3-Bedroom $850/month.
-
2024-07-22price $112,000 124-char remark
Show marketing remark (124 chars)
Both units have long-term renters, 24+ hours notice to show. 1st Level Efficiency $475/month, Upstairs 3-Bedroom $850/month.
-
2024-07-12$120,000 Active 124-char remark
Show marketing remark (124 chars)
Both units have long-term renters, 24+ hours notice to show. 1st Level Efficiency $475/month, Upstairs 3-Bedroom $850/month.
ⓘ Source: listings_history table (triggers on properties + properties_extension) + one-shot
backfill from property_details.listing_events for pre-trigger history.
Tax reassessment forecast IA · Partial reset (capped growth)
- Current annual tax
- $1,706 · $142/mo
- Projected year-2 tax
- $1,874 · $156/mo
- Expected delta
- +$168/yr (+$14/mo · 9.8%)
ⓘ Screening estimate from a state-policy table — verify with the county assessor before closing.
Climate risk First Street
- Flood 1/10 Low FEMA zone X (unshaded) · 0% chance over 30 yrs
- Wildfire 1/10 Low
- Heat 3/10 Moderate 7 d/yr ≥104°F today · 15 d/yr by 30 yrs out
- Wind 2/10 Low
- Air quality 2/10 Low 0 unhealthy d/yr today · 1 by 30 yrs out
Nearby sold comps map
Loading sold comps map…
Walkable amenities ~0.75 mi
Loading nearby amenities…
Taxation est. · year 1
- Rental income
- $29,448
- − Mortgage interest
- −$7,282
- − Property taxes
- −$1,706
- − Insurance
- −$650
- − Repairs & maintenance
- −$2,356
- − Management
- −$2,356
- − Depreciation
- −$3,782
- Taxable income
- $11,316
- Est. tax owed @ 24.0%
- −$2,716
- After-tax cash flow
- $10,011/yr
For passive investors: Depreciation is non-cash, so a rental often shows a tax loss while cash-flowing — sheltering income. Rental losses are passive: they offset passive income freely, and up to $25,000/yr can offset ordinary (W-2) income if you actively participate and your MAGI is under $100k (phasing out to $0 by $150k); unused losses carry forward. On sale, claimed depreciation is recaptured at up to 25%, and gains may owe capital-gains tax (a 1031 exchange can defer both). Figures are a year-1 estimate at your 24.0% rate — not tax advice; consult a CPA.
Schools (NCES district)
- District
- Cedar Rapids Community School District
- NCES district ID
- 1906540
- Math proficiency
- 50% ▼ -12.00%
- Reading proficiency
- 59% ▼ -6.00%
- Median HH income
- $53,568
- Composite
- 46.82/100
- National rank
- #2378
- State rank
- #265 of 289 in IA
Livability — Cedar Rapids
- Score
- 78/100
- State rank
- #134
- US rank
- #2474
Category grades
Schools grade is shown separately in the Schools card above.
Census & demographics
- Census place
- Cedar Rapids, IA
- County
- Linn County · 179,860 people
- City population
- 137,154
- Metro
- Cedar Rapids, IA
- Population (ZIP)
- 42,938
- Household income
- $73,439
- Rent vs Own
- Severe rent burden
- 971.0
Population outlook (Linn County) Hauer SSP2
- Today (2025)
- 239,589 people
- By 2030
- 248,587 · +3.8%
- By 2040
- 264,817 · +10.5%
- By 2050
- 278,685 · +16.3%
- By 2075
- 311,754 · +30.1%
- By 2100
- 336,773 · +40.6%
Race, ethnicity, and origin ACS 2023
- Neighborhood character
- Predominantly White (77%)
- Race & ethnicity
- White 77% Two or more races 7% Black 6% Asian 6% Hispanic / Latino 4%
- Common ancestry
- Portuguese 4% Lithuanian 2% Iranian 2%
- Foreign-born
- 8% · Canada, Philippines, China
- Languages at home
- 89% English-only · Spanish 3% Other Indo-European 3% Other Asian/Pacific 2%
Political lean MEDSL · Linn
- 2024 margin
- Lean D (+9.9) · D 54.2% · R 44.3% · Other 1.4%
- 2008→2024 swing
- -11.6pp toward R · 2008: 21.5pp · 2024: 9.9pp
- All cycles
- 2024: D+9.9 2020: D+13.7 2016: D+9.0 2012: D+17.6 2008: D+21.5
Not yet ingested
- Civics
- —
Market trends
- HPI YoY
- ▼ -133.31%
- Current HPI
- 201.7061
- Rent YoY
- ▲ 10.97%
- Metro
- Cedar Rapids, IA
- State GDP YoY
- ▲ 2.48%
- F500 in state
- 4
Industry mix (Fortune 500 HQ in IA)
| Industry | F500 HQs | Revenue |
|---|---|---|
| Financial Services | 1 | $16B |
|
||
| Retail / Convenience | 1 | $15B |
|
||
Price history
+8.3% since first listed7 events — show timeline
- 2026-03-09 Listed $130,000 CRAAR, CDRMLS
- 2024-09-11 Sold (Public Records) $100,000 Public Records
- 2024-09-04 Sold (MLS) $100,000 CRAAR, CDRMLS
- 2024-08-04 Pending — CRAAR, CDRMLS
- 2024-07-31 Price Changed $102,000 CRAAR, CDRMLS
- 2024-07-22 Price Changed $112,000 CRAAR, CDRMLS
- 2024-07-12 Listed $120,000 CRAAR, CDRMLS
Property tax history
+4.5%/yrLatest (2025): $1,706 · +10.2% YoY. Source: county tax records.
Cash-flow waterfall
monthlySold comps — $/sqft
last 12 mo · ≤1 miLoading sold comps…