5306 Cinnamon Ln · Princeton, TX
Flood risk 1/10 · Minimal
- FEMA flood zone
- X (unshaded)
- Chance of flooding over 30 yrs
- 0.0%
- Est. flood insurance / yr
- $507 – $1,088
Fire risk 3/10 · Minor
- Est. fire insurance / yr
- $1,222 – $2,270
Heat risk 7/10 · Major
- Hot days now (above 110°F)
- 7 days/yr
- Hot days in 30 yrs
- 24 days/yr
Wind risk 6/10 · Moderate
- Chance of severe wind over 30 yrs
- 27.0%
Air-quality risk 3/10 · Minor
- Unhealthy air days now
- 3 days/yr
- Unhealthy air days in 30 yrs
- 3 days/yr
Risk factors via First Street. Map © Google.
Why this score? — see what drove the D+ grade
The composite is a weighted blend of 9 inputs, each scored 0–100. Each bar is that input's sub-score; the figure is the points it added to the 100-point composite (weight × sub-score).
- ARV discount +15.0/15.0
- Cash flow +14.1/30.0
- DSCR +4.3/10.0
- 1% rule +4.2/10.0
- Schools +4.2/10.0
- Livability +3.1/5.0
- Rent growth +2.2/5.0
- Condition / age +1.0/5.0
- Appreciation +0.0/10.0
$249,349
🖨 Deal sheet (PDF) 📄 Offer letter ✓ Due diligence
Listing remarks MLS
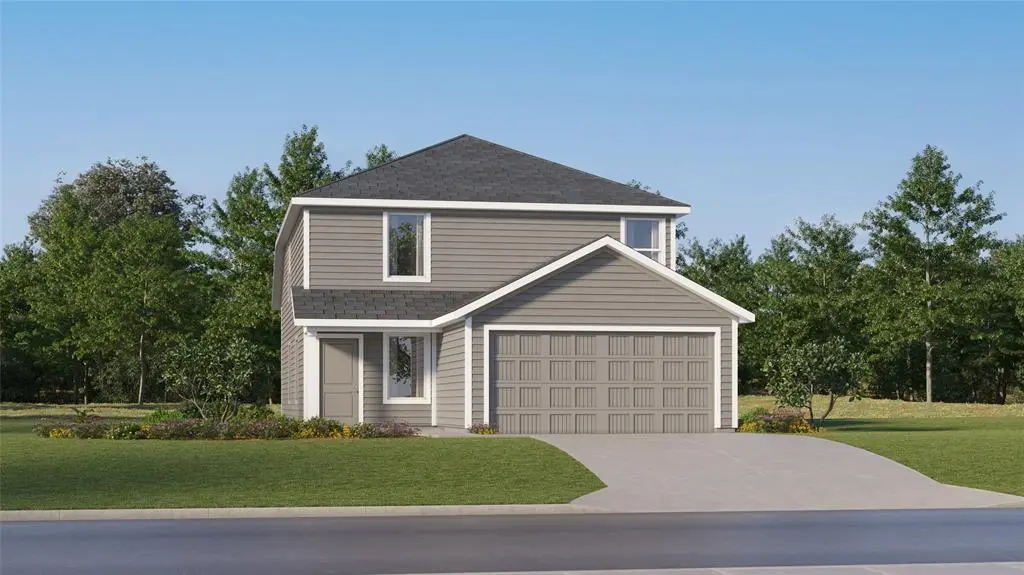
$22,650 OFF – MOTHERS DAY SPECIAL! LENNAR - Acorn South- Morrow Floorplan Prices, dimensions and features may vary and are subject to change. Photos are for illustrative purposes only.
Key facts
- 4,400 sq ft lot
- 2 garage spots
- Built 2026
Neighborhood map
What this means for you Summary
Snapshot
- This is a 4-bed/2.0-bath single-family listed at $249k. Condition is rated poor.
Deal economics
- At list price, monthly cash flow is $37 ($447/yr) — positive.
- The deal already cash-flows at list — no discount required.
- To meet the 1% rule (rent ≥ 1% of price), the offer needs to be $230k (7.6% below list).
- Recommended offer: $230k (7.6% below list) — sets the bar for 1% rule.
- Cap rate 6.5% vs local median 4.5% in Princeton — top-decile yield for the area; either an underpriced asset or a hidden risk that comps aren't pricing in. Stress-test before assuming the spread holds.
Location & tenants
- Location reads 62/100 on livability (#969 in TX) — a middle-class / working-renter tenant base. Strengths: employment A+, housing A+, cost of living A; Watch: schools C-, amenities F, commute F.
- Princeton ISD (suburban): math 51% / reading 47% proficiency, ranked #188 of 826 in TX (top 23%) — families likely to look elsewhere, expect single-tenant / working-renter base with shorter leases.
- Market conditions: Rents soft (-1.0%/yr); 1404 active listings in the ZIP; 40 comparable units currently listed for rent nearby; rentals at typical pace (median 25d on market — plan ~3-4 weeks tenant-placement turnaround); 45% of comp listings sitting > 30 days — soft ceiling on asking rent; solid renter incomes; 19,194 units permitted in Collin County in 2024 (3,988 in 5+ unit buildings).
Forward outlook
- Local home prices are declining (-3.0%/yr); year-one equity from $2k of loan paydown is wiped out by about $7k of value loss. Plan a longer hold.
- Collin County population projected at +60% by 2050 — long-run rental-demand tailwind backs the buy-and-hold thesis.
Negotiation context
- Only 11 days on market — expect competitive offers; lowballing is unlikely to land.
- 2 sale attempts; this cycle's ask has dropped $16k (6%) from the opening price — seller is motivated, your offer sets the floor, not the list.
Risks & watch-outs
- Climate carrying-cost: major wind risk, 27% chance of damaging wind over 30y; extreme-heat days projected 7→24/yr by 2055 (HVAC capex compounding) — expect insurance premiums to compound above CPI over the hold.
Questions for the listing agent
- Have any recent inspections been done? Can we get a copy of the seller's disclosures and any deferred-maintenance estimates?
- What does the HOA fee cover, when was the last increase, and are there any pending special assessments or reserve-fund shortfalls?
- Is there a deadline driving the sale (1031 exchange, divorce, estate, relocation)? That informs how much negotiation room exists.
- The area grade is low — what's the realistic commute time and amenity access for the typical tenant pool here? Any planned neighborhood developments (good or bad) we should know about?
- What's the average days-on-market for RENTAL listings here right now (not sales)? A rising rental-DOM trend means longer vacancies and softer asking-rent achievability than the comps imply.
- What's the recent tenant-quality profile in this submarket — average credit score on applications, eviction rate, late-payment / NSF rate, and stable-employment percentage? A property-management company in the area should have these aggregated.
- How much new for-sale + rental construction is in the pipeline within 1–3 miles? Heavy new supply typically softens prices + rents 12–24 months out; constrained supply supports both.
Investment metrics
- 1% rule
- 0.92% ✗
- Cap rate
- 6.47%
- Cash-on-cash
- 0.64%
- DSCR
- 1.03
- GRM
- 9.0
CMA / ARV
- ARV (median comp)
- $422,266
- List price
- $249,349
- Delta
- -40.95%
- Verdict
- UNDERPRICED
- Comps
- 20 within 1.0 mi
Show comp detail 9 sales within ~0.75 mi
| Address | Dist | Beds/Ba | Sqft | Sold | Price | $/sf | Match |
|---|---|---|---|---|---|---|---|
| 10650 County Road 491 | 0.61mi | 4/3.0 | 1,834 (-2%) | 3mo | $380,000 | $207 | 62 |
| 795 Jupe Way | 0.65mi | 4/2.0 | 1,753 (-6%) | 2mo | $312,889 | $178 | 58 |
| 510 Weller Rd | 0.00mi | 4/3.5 | 2,139 (+15%) | 14mo | $394,990 | $185 | 58 |
| 722 Jupe Way | 0.70mi | 4/2.0 | 1,753 (-6%) | 2mo | $299,000 | $171 | 55 |
| 664 Jupe Way | 0.47mi | 4/2.0 | 1,753 (-6%) | 16mo | $341,547 | $195 | 55 |
| 808 Sicily Blvd | 0.47mi | 4/2.5 | 1,674 (-10%) | 13mo | $391,949 | $234 | 48 |
| 677 Jupe Way | 0.70mi | 4/2.0 | 1,675 (-10%) | 9mo | $317,630 | $190 | 43 |
| 10405 County Road 491 | 0.39mi | 3/2.0 (-1) | 2,121 (+14%) | 19mo | $475,000 | $224 | 38 |
| 1216 Desert Willow Dr | 0.40mi | 3/2.0 (-1) | 1,602 (-14%) | 24mo | $323,999 | $202 | 33 |
Match score weights: distance 35% · size 25% · config 20% · recency 20%. Top-matched comps best support the ARV.
Projected returns pro-forma
-3.0% appreciation · 0.0% rent growth · sell at horizon
- IRR
- -18.8%
- Equity multiple
- 0.36×
- Total profit
- $-44,717
- Equity at exit
- $37,179
- IRR
- -19.3%
- Equity multiple
- 0.12×
- Total profit
- $-61,694
- Equity at exit
- $21,559
Cash invested: $69,818 (down + closing). Projections, not guarantees.
Landlord ↔ Tenant lean methodology
- Overall (STATE)
- 87 Strongly Landlord-Friendly
- State Texas
- 87 Strongly Landlord-Friendly · R+5
- County
- — inherits STATE
- City
- — inherits STATE
ZIP-level market 75407
- Home prices YoY
- -30.3%
- Rents YoY
- -1.0%
- Active inventory
- 1404
- Price-to-rent
- 9.0×
Monthly cashflow live
- Estimated rent
- $2,304 high interval (Pro) →
- Mortgage (P&I)
- −$1,308
- Tax est. 1.5%
- −$312 /mo · $3,740/yr
- Insurance
- −$104
- HOA
- −$60
- Vacancy / Maint / Mgmt
- −$484
- Net cashflow
- $37
Break-even live
Sensitivity live
| Price | -10% $210 | -5% $123 | +0% $37 | +5% $-49 | +10% $-135 |
|---|---|---|---|---|---|
| Rent | -10% $-145 | -5% $-54 | +0% $37 | +5% $128 | +10% $219 |
| Rate | -1.0pp $163 | -0.5pp $101 | base $37 | +0.5pp $-27 | +1.0pp $-93 |
UW: 25.0% down · 7.5% · 30yr · 1.5% tax · 5.0% vac · 8.0% maint · 8.0% mgmt
Financing live
Cash to close
- Down payment
- $62,337
- Closing costs
- $7,480
- Reserves months
- —
- Total cash needed
- —
Loan-product check · same deal, 3 products live
Conventional
25% down · 7.5% · 30yr
- Down + closing
- —
- Monthly P&I
- —
- Monthly cashflow
- —
- DSCR
- —
- Eligible?
- —
Personal DTI + credit; lowest rate.
DSCR
20% down · 8.5% · 30yr
- Down + closing
- —
- Monthly P&I
- —
- Monthly cashflow
- —
- DSCR
- —
- Eligible?
- —
No personal income docs; deal must DSCR.
Hard money
10% down · 12.0% · 12mo
- Down + closing
- —
- Monthly P&I
- —
- Monthly cashflow
- —
- DSCR
- —
- Eligible?
- —
Short-term bridge; refi at stabilization.
Rent comps 40 comps
| Address | Beds | Baths | Sqft | Rent | $/sqft | DOM | Units | Dist |
|---|---|---|---|---|---|---|---|---|
| 7008 Vining DR Princeton, TX | 4.0 | 3.0 | 1510 | $2,500 | $1.66 | 44d | 1 | 0.03mi |
| 750 Jupe Way Princeton, TX | 4.0 | 3.0 | 2500 | $2,300 | $0.92 | 44d | 1 | 0.68mi |
| 1567 Dukeswood Dr Princeton, TX | 3.0 | 2.5 | 2429 | $2,575 | $1.06 | 18d | 1 | 0.69mi |
| 663 Saxony Dr Princeton, TX | 4.0 | 2.0 | 2209 | $2,100 | $0.95 | 44d | 1 | 0.78mi |
| 663 Saxony Dr Princeton, TX | 4.0 | 2.0 | 2209 | $2,250 | $1.02 | 25d | 1 | 0.78mi |
| 649 Saxony Dr Princeton, TX | 4.0 | 2.0 | 1674 | $2,100 | $1.25 | 13d | 1 | 0.79mi |
| 622 Saxony Dr Princeton, TX | 3.0 | 2.0 | 1567 | $2,000 | $1.28 | 44d | 1 | 0.82mi |
| 149 Princeton Xrds Princeton, TX | 1.0–3.0 | 1.0–2.0 | 980 | $1,914 | $1.95 | 2d | 23 | 0.88mi |
| 353 Princewood Dr Princeton, TX | 4.0 | 2.0 | 1753 | $1,950 | $1.11 | 44d | 1 | 0.94mi |
| 461 Princewood Dr Princeton, TX | 3.0 | 2.0 | 1749 | $1,750 | $1.00 | 25d | 1 | 0.94mi |
| 2304 Dahlia Way Princeton, TX | 4.0 | 2.0 | 2006 | $2,125 | $1.06 | 18d | 1 | 0.97mi |
| 200 Lake Rdg Princeton, TX | 4.0 | 2.5 | 2586 | $2,300 | $0.89 | 2d | 1 | 1.00mi |
| 205 Lake Rdg Princeton, TX | 4.0 | 2.0 | 2025 | $2,195 | $1.08 | 44d | 1 | 1.01mi |
| 346 Boroughbridge Dr Princeton, TX | 4.0 | 2.5 | 2500 | $1,975 | $0.79 | 44d | 1 | 1.04mi |
| 264 Moonstone Way Princeton, TX | 4.0 | 2.0 | 1803 | $1,795 | $1.00 | 16d | 1 | 1.05mi |
| 291 Wandering Stream Way Princeton, TX | 4.0 | 2.0 | 1803 | $1,875 | $1.04 | 44d | 1 | 1.06mi |
| 1823 Dahlia Way Princeton, TX | 4.0 | 2.0 | 1803 | $1,950 | $1.08 | 8d | 1 | 1.08mi |
| 219 Golden Sands Ln Princeton, TX | 4.0 | 2.0 | 1800 | $1,795 | $1.00 | 17d | 1 | 1.10mi |
| 248 Enchanted Way Princeton, TX | 4.0 | 2.0 | 2006 | $1,999 | $1.00 | 44d | 1 | 1.12mi |
| 281 Moonstone Way Princeton, TX | 4.0 | 2.0 | 1803 | $1,895 | $1.05 | 13d | 1 | 1.12mi |
| 280 Moonstone Way Princeton, TX | 4.0 | 2.0 | 1800 | $1,900 | $1.06 | 5d | 1 | 1.13mi |
| 1917 Lilac Dr Princeton, TX | 4.0 | 2.0 | 1850 | $2,045 | $1.11 | 44d | 1 | 1.13mi |
| 304 Wandering Stream Way Princeton, TX | 4.0 | 2.0 | 1803 | $1,875 | $1.04 | 44d | 1 | 1.14mi |
| 263 Honeysuckle Ln Princeton, TX | 4.0 | 2.0 | 1800 | $1,850 | $1.03 | 44d | 1 | 1.14mi |
| 265 Honeysuckle Ln Princeton, TX | 4.0 | 2.5 | 2171 | $2,195 | $1.01 | 44d | 1 | 1.15mi |
| 250 N Boorman Ln Princeton, TX | 1.0–3.0 | 1.0–2.0 | 936 | $4,619 | $4.93 | 2d | 1 | 1.16mi |
| 306 Golden Sands Ln Princeton, TX | 4.0 | 2.5 | 1811 | $1,995 | $1.10 | 44d | 1 | 1.20mi |
| 311 Clear Springs St Princeton, TX | 4.0 | 2.5 | 2577 | $2,245 | $0.87 | 44d | 1 | 1.21mi |
| 1717 Cotton Blossom Ln Princeton, TX | 3.0 | 2.0 | 1924 | $1,900 | $0.99 | 19d | 1 | 1.21mi |
| 1715 Cotton Blossom Ln Princeton, TX | 4.0 | 2.0 | 2006 | $2,099 | $1.05 | 44d | 1 | 1.21mi |
| 613 Grenada Lake Dr Princeton, TX | 4.0 | 3.0 | 2395 | $3,025 | $1.26 | 3d | 1 | 1.22mi |
| 605 Grenada Lake Dr Princeton, TX | 3.0 | 2.0 | 1563 | $1,925 | $1.23 | 16d | 1 | 1.23mi |
| 1707 Cotton Blossom Ln Princeton, TX | 4.0 | 2.0 | 1811 | $2,095 | $1.16 | 5d | 1 | 1.23mi |
| 313 Sweet Pea Ln Princeton, TX | 4.0 | 2.0 | 1802 | $1,900 | $1.05 | 3d | 1 | 1.26mi |
| 305 Turquoise Ln Princeton, TX | 4.0 | 2.0 | 1811 | $1,850 | $1.02 | 13d | 1 | 1.28mi |
| 882 Breakwater Dr Princeton, TX | 4.0 | 2.5 | 1824 | $2,250 | $1.23 | 22d | 1 | 1.29mi |
| 200 Cole St Princeton, TX | 1.0–3.0 | 1.0–2.0 | 960 | $1,799 | $1.87 | 44d | 23 | 1.29mi |
| 200 Cole St Princeton, TX | 1.0–3.0 | 1.0–2.0 | 960 | $1,733 | $1.80 | 2d | 9 | 1.29mi |
| 858 Breakwater Dr Princeton, TX | 4.0 | 3.0 | 2395 | $2,200 | $0.92 | 44d | 1 | 1.29mi |
| 846 Breakwater Dr Princeton, TX | 3.0 | 2.5 | 1824 | $2,000 | $1.10 | 3d | 1 | 1.29mi |
HOA detail
- Monthly dues
- $60 · $720/yr
Listing history 5 events
-
2026-05-12status Pending 192-char remark
Show marketing remark (192 chars)
$22,650 OFF – MOTHERS DAY SPECIAL! LENNAR - Acorn South- Morrow Floorplan Prices, dimensions and features may vary and are subject to change. Photos are for illustrative purposes only.
-
2026-05-05price $249,349 192-char remark
Show marketing remark (192 chars)
$22,650 OFF – MOTHERS DAY SPECIAL! LENNAR - Acorn South- Morrow Floorplan Prices, dimensions and features may vary and are subject to change. Photos are for illustrative purposes only.
-
2026-05-05status Active 192-char remark
Show marketing remark (192 chars)
$22,650 OFF – MOTHERS DAY SPECIAL! LENNAR - Acorn South- Morrow Floorplan Prices, dimensions and features may vary and are subject to change. Photos are for illustrative purposes only.
-
2026-03-08status Pending 192-char remark
Show marketing remark (192 chars)
$22,650 OFF – MOTHERS DAY SPECIAL! LENNAR - Acorn South- Morrow Floorplan Prices, dimensions and features may vary and are subject to change. Photos are for illustrative purposes only.
-
2026-03-04$264,999 Active 192-char remark
Show marketing remark (192 chars)
$22,650 OFF – MOTHERS DAY SPECIAL! LENNAR - Acorn South- Morrow Floorplan Prices, dimensions and features may vary and are subject to change. Photos are for illustrative purposes only.
ⓘ Source: listings_history table (triggers on properties + properties_extension) + one-shot
backfill from property_details.listing_events for pre-trigger history.
Climate risk First Street
- Flood 1/10 Low FEMA zone X (unshaded) · 0% chance over 30 yrs
- Wildfire 3/10 Moderate
- Heat 7/10 Severe 7 d/yr ≥110°F today · 24 d/yr by 30 yrs out
- Wind 6/10 Major 27% chance of damaging wind over 30 yrs
- Air quality 3/10 Moderate 3 unhealthy d/yr today · 3 by 30 yrs out
Nearby sold comps map
Loading sold comps map…
Walkable amenities ~0.75 mi
Loading nearby amenities…
Taxation est. · year 1
- Rental income
- $27,652
- − Mortgage interest
- −$13,967
- − Property taxes
- −$3,740
- − Insurance
- −$1,247
- − Repairs & maintenance
- −$2,212
- − Management
- −$2,212
- − HOA
- −$720
- − Depreciation
- −$7,254
- Taxable loss
- −$3,701
- Est. tax savings @ 24.0%
- +$888
- After-tax cash flow
- $1,335/yr
For passive investors: Depreciation is non-cash, so a rental often shows a tax loss while cash-flowing — sheltering income. Rental losses are passive: they offset passive income freely, and up to $25,000/yr can offset ordinary (W-2) income if you actively participate and your MAGI is under $100k (phasing out to $0 by $150k); unused losses carry forward. On sale, claimed depreciation is recaptured at up to 25%, and gains may owe capital-gains tax (a 1031 exchange can defer both). Figures are a year-1 estimate at your 24.0% rate — not tax advice; consult a CPA.
Condition & rehab AI · 1 photo
This home requires extensive repairs and maintenance, including major work on the exterior siding, roof, and landscaping. Significant improvements are needed to increase its resale and rental value.
Repairs flagged
- Major exterior siding — The siding is visibly weathered and discolored, indicating significant damage.
- Major roof — The roof appears to have missing shingles or significant damage, which is not visible in the photo but is implied by the overall condition of the home.
- Major landscaping — The landscaping is overgrown and unkempt, which detracts from the curb appeal of the home.
Value-add opportunities
- Resale paint exterior — Painting the exterior can significantly improve the home's curb appeal and resale value.
- Resale repair roof — Repairing the roof can address a major issue and improve the home's overall condition.
- Both landscape — Landscape improvements can enhance curb appeal and attract potential buyers or renters.
- Resale paint interior walls — Painting interior walls can freshen up the home and make it more appealing to potential buyers.
- Resale repair exterior siding — Repairing the exterior siding can improve the home's appearance and increase its resale value.
- Rental repair HVAC/mechanicals — Repairing HVAC/mechanicals can improve the home's comfort and attract renters.
- Resale repair kitchen/bath — Repairing the kitchen and bathrooms can improve the home's functionality and increase its resale value.
- Resale repair flooring — Repairing flooring can improve the home's appearance and increase its resale value.
- Resale repair interior walls/paint — Repairing interior walls and painting can improve the home's appearance and increase its resale value.
- Resale repair systems — Repairing systems can improve the home's functionality and increase its resale value.
Renovation cost estimate screening
| Repair item | Severity | Est. cost |
|---|---|---|
| exterior siding · The siding is visibly weathered and discolored, indicating significant damage. | Major | $15,000–50,000 |
| roof · The roof appears to have missing shingles or significant damage, which is not visible in the photo but is implied by the overall condition of the home. | Major | $15,000–50,000 |
| landscaping · The landscaping is overgrown and unkempt, which detracts from the curb appeal of the home. | Major | $15,000–50,000 |
| Total estimated repair cost · 3 items | $45,000–150,000 |
Value-add ROI direction
- Resale paint exterior — Painting the exterior can significantly improve the home's curb appeal and resale value. ↑
- Resale repair roof — Repairing the roof can address a major issue and improve the home's overall condition. ↑
- Both landscape — Landscape improvements can enhance curb appeal and attract potential buyers or renters. ↑
- Resale paint interior walls — Painting interior walls can freshen up the home and make it more appealing to potential buyers. ↑
- Resale repair exterior siding — Repairing the exterior siding can improve the home's appearance and increase its resale value. ↑
- Rental repair HVAC/mechanicals — Repairing HVAC/mechanicals can improve the home's comfort and attract renters. ↑
- Resale repair kitchen/bath — Repairing the kitchen and bathrooms can improve the home's functionality and increase its resale value. ↑
- Resale repair flooring — Repairing flooring can improve the home's appearance and increase its resale value. ↑
- Resale repair interior walls/paint — Repairing interior walls and painting can improve the home's appearance and increase its resale value. ↑
- Resale repair systems — Repairing systems can improve the home's functionality and increase its resale value. ↑
ⓘ Cost ranges are severity-bucket heuristics (US national rule-of-thumb). Get contractor quotes + a written scope before underwriting a rehab budget.
Schools (NCES district)
- District
- Princeton ISD
- NCES district ID
- 4835850
- Math proficiency
- 51% ▼ -8.00%
- Reading proficiency
- 47% ▬ 0.00%
- Median HH income
- $54,827
- Composite
- 42.44/100
- National rank
- #3226
- State rank
- #188 of 826 in TX
Livability — Princeton
- Score
- 62/100
- State rank
- #969
- US rank
- #17215
Category grades
Schools grade is shown separately in the Schools card above.
Census & demographics
- County
- Collin County · 1,159,394 people
- City population
- 34,171
- Metro
- Dallas-Fort Worth-Arlington, TX
- Population (ZIP)
- 34,171
- Household income
- $100,037
- Rent vs Own
- Severe rent burden
- 368.0
Population outlook (Collin County) Hauer SSP2
- Today (2025)
- 1,210,074 people
- By 2030
- 1,358,201 · +12.2%
- By 2040
- 1,654,061 · +36.7%
- By 2050
- 1,937,359 · +60.1%
- By 2075
- 2,567,039 · +112.1%
- By 2100
- 2,952,048 · +144.0%
Race, ethnicity, and origin ACS 2023
- Neighborhood character
- Diverse neighborhood (Simpson 0.66)
- Race & ethnicity
- White 47% Hispanic / Latino 30% Black 17% Two or more races 10% Asian 4% Native American 1%
- Hispanic origin (detail)
- Mexican 26%
- Common ancestry
- Lithuanian 2% Romanian 1% Russian 1%
- Foreign-born
- 15% · Canada, China, Mexico
- Languages at home
- 70% English-only · Spanish 22% Other Indo-European 2% Other Asian/Pacific 1%
Political lean MEDSL · Collin
- 2024 margin
- R (+11.1) · D 43.1% · R 54.3% · Other 2.6%
- 2008→2024 swing
- +14.4pp toward D · 2008: -25.6pp · 2024: -11.1pp
- All cycles
- 2024: R+11.1 2020: R+4.3 2016: R+17.0 2012: R+31.6 2008: R+25.6
Not yet ingested
- Civics
- —
Market trends
- HPI YoY
- ▼ -103.99%
- Current HPI
- 238.9373
- Rent YoY
- ▼ -1.02%
- Metro
- Dallas-Fort Worth-Arlington, TX
- State GDP YoY
- ▲ 3.95%
- F500 in state
- 110
Industry mix (Fortune 500 HQ in TX)
| Industry | F500 HQs | Revenue |
|---|---|---|
| Energy | 16 | $1,198B |
|
||
| Technology | 5 | $198B |
|
||
| Engineering / Construction | 4 | $72B |
|
||
| Energy Services | 3 | $60B |
|
||
| Utilities | 3 | $41B |
|
||
| Healthcare | 2 | $330B |
|
||
Price history
-5.9% since first listed5 events — show timeline
- 2026-05-12 Pending — NTREIS
- 2026-05-05 Price Changed $249,349 NTREIS
- 2026-05-05 Relisted — NTREIS
- 2026-03-08 Pending — NTREIS
- 2026-03-04 Listed $264,999 NTREIS
Cash-flow waterfall
monthlySold comps — $/sqft
last 12 mo · ≤1 miLoading sold comps…