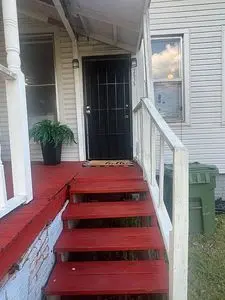
 Duplex
2513 Plum St · Montgomery, AL
Flood risk 1/10 · Minimal
- FEMA flood zone
- X (unshaded)
- Chance of flooding over 30 yrs
- 0.0%
- Est. flood insurance / yr
- $507 – $1,088
Fire risk 1/10 · Minimal
- Est. fire insurance / yr
- $916 – $1,700
Heat risk 7/10 · Major
- Hot days now (above 107°F)
- 7 days/yr
- Hot days in 30 yrs
- 19 days/yr
Wind risk 8/10 · Major
- Chance of severe wind over 30 yrs
- 80.0%
Air-quality risk 3/10 · Minor
- Unhealthy air days now
- 4 days/yr
- Unhealthy air days in 30 yrs
- 4 days/yr
Risk factors via First Street. Map © Google.
Why this score? — see what drove the B- grade
The composite is a weighted blend of 9 inputs, each scored 0–100. Each bar is that input's sub-score; the figure is the points it added to the 100-point composite (weight × sub-score).
- Cash flow +30.0/30.0
- 1% rule +10.0/10.0
- DSCR +10.0/10.0
- ARV discount +7.5/15.0
- Rent growth +3.8/5.0
- Livability +3.2/5.0
- Condition / age +2.5/5.0
- Schools +1.7/10.0
- Appreciation +0.0/10.0
$95,000
🖨 Deal sheet (PDF) 📄 Offer letter ✓ Due diligence
Multi-family units
County records classify this as Multi-Family (2-4 Unit). Listing-text estimate: 2 units. confirmed
Listing remarks MLS
Great Duplex for your investment portfolio! Home is fully vinyl sided. This duplex can be purchased as a package with 2208 Locust and 2435 Plum. As Is.
Key facts
- Built 1930
- Listed 6 days
Property features AI
Finance
- Other: Living area approximately 1890
Exterior
- Home design: Built in 1930
- Construction: Original 1930 construction
- Exterior features: Located in the Highland Park subdivision
Neighborhood map
What this means for you Summary
Snapshot
- This is a 2 × 2-bed/2.0-bath units multifamily listed at $95k.
Deal economics
- At list price, monthly cash flow is $868 ($10k/yr) — positive. Per door: $434/mo.
- The deal already cash-flows at list — no discount required.
- Meets the 1% rule at list price ($2k rent vs $95k).
- Cap rate 17.3% vs local median 6.0% in Montgomery — top-decile yield for the area; either an underpriced asset or a hidden risk that comps aren't pricing in. Stress-test before assuming the spread holds.
Location & tenants
- Location reads 65/100 on livability (#138 in AL) — a middle-class / working-renter tenant base. Strengths: cost of living A+, housing A+; Watch: schools C-, employment D, crime F.
- Montgomery County (urban): math 9% / reading 31% proficiency, ranked #106 of 129 in AL (top 82%) — low school quality limits family demand, transient renter base, plan for 1-2y turnover; 70% free/reduced lunch — lower-income household profile, screen leases tightly.
- Market conditions: Rents rising fast (+5.0%/yr); 67 active listings in the ZIP; 40 comparable units currently listed for rent nearby; rentals at typical pace (median 22d on market — plan ~3-4 weeks tenant-placement turnaround); lower-income renter base — watch delinquency; 460 units permitted in Montgomery County in 2024 (37 in 5+ unit buildings).
- At $1,880/mo this rent would consume 69% of the median local household income ($32k/yr) (locally 642% of renters already pay >50% of income on rent) — very limited rent-growth headroom before tenants either downsize or default.
Forward outlook
- Local home prices are declining (-3.0%/yr); year-one equity from $657 of loan paydown is wiped out by about $3k of value loss. Plan a longer hold.
- Montgomery County population projected to shrink 8% by 2050 — rents likely to lag national; underwrite the cash flow, not the appreciation.
- At projected returns (-3.0% appreciation + 5.0% rent growth), your $27k cash investment doubles in ~3 years — after that, you're playing with house money.
Negotiation context
- Only 6 days on market — expect competitive offers; lowballing is unlikely to land.
- 4 sale attempts since 22y ago with the ask held roughly flat each time — persistent listings suggest the price (not the market) is what's stuck; bring a comps-based counter.
- Current owner paid $15k; list at $95k implies a 533% gain — meaningful room to come down on a strong offer.
Risks & watch-outs
- Watch-outs: built in 1930 — expect roof / HVAC / electrical / plumbing capex.
- Climate carrying-cost: severe wind risk, 80% chance of damaging wind over 30y; extreme-heat days projected 7→19/yr by 2055 (HVAC capex compounding) — expect insurance premiums to compound above CPI over the hold.
Questions for the listing agent
- Can we see the unit-by-unit rent roll, current vacancy, and any below-market leases? What's the average tenancy length?
- What capital expenditures (roof, boiler, parking lot, exteriors) have been made in the last 5 years, and what's planned in the next 2?
- Built in 1930 — when were the roof, HVAC, electrical panel, plumbing, and water heater last replaced?
- Is there a deadline driving the sale (1031 exchange, divorce, estate, relocation)? That informs how much negotiation room exists.
- Crime grade is F in this area — have there been break-ins, vandalism, or insurance claims at this property in the last 3 years? What carrier currently insures it and at what premium?
- What's the average days-on-market for RENTAL listings here right now (not sales)? A rising rental-DOM trend means longer vacancies and softer asking-rent achievability than the comps imply.
- What's the recent tenant-quality profile in this submarket — average credit score on applications, eviction rate, late-payment / NSF rate, and stable-employment percentage? A property-management company in the area should have these aggregated.
- How much new apartment / multifamily construction is in the pipeline within 1–3 miles? Heavy new supply (>2% of stock underway) typically softens rents 12–24 months out; light construction supports rent growth.
Investment metrics
- 1% rule
- 1.98% ✓
- Cap rate
- 17.26%
- Cash-on-cash
- 39.17%
- DSCR
- 2.74
- GRM
- 4.2
CMA / ARV
No comps found within radius.
Projected returns pro-forma
-3.0% appreciation · 5.05% rent growth · sell at horizon
- IRR
- 37.7%
- Equity multiple
- 2.65×
- Total profit
- $43,864
- Equity at exit
- $14,165
- IRR
- 45.2%
- Equity multiple
- 5.75×
- Total profit
- $126,348
- Equity at exit
- $8,214
Cash invested: $26,600 (down + closing). Projections, not guarantees.
Landlord ↔ Tenant lean methodology
- Overall (STATE)
- 90 Strongly Landlord-Friendly
- State Alabama
- 90 Strongly Landlord-Friendly · R+15
- County
- — inherits STATE
- City
- — inherits STATE
ZIP-level market 36107
- Home prices YoY
- -10.9%
- Rents YoY
- 5.0%
- Active inventory
- 67
- Price-to-rent
- 8.4×
Monthly cashflow live
- Estimated rent
- $1,880 high interval (Pro) →
- Mortgage (P&I)
- −$498
- Tax from tax record
- −$79 /mo · $951/yr
- Insurance
- −$40
- HOA
- −$0
- Vacancy / Maint / Mgmt
- −$395
- Net cashflow
- $868
Break-even live
Sensitivity live
| Price | -10% $922 | -5% $895 | +0% $868 | +5% $841 | +10% $814 |
|---|---|---|---|---|---|
| Rent | -10% $720 | -5% $794 | +0% $868 | +5% $942 | +10% $1,017 |
| Rate | -1.0pp $916 | -0.5pp $892 | base $868 | +0.5pp $844 | +1.0pp $819 |
2-unit breakdown (identical units grouped — click to expand)
| Units | Beds | Baths | Est. rent |
|---|---|---|---|
| 2× units | 2 | 2 | $1,880 |
| #1 | 2 | 2 | $940 |
| #2 | 2 | 2 | $940 |
| Total (2 units) | $1,880 | ||
UW: 25.0% down · 7.5% · 30yr · 1.5% tax · 5.0% vac · 8.0% maint · 8.0% mgmt
Financing live
Cash to close
- Down payment
- $23,750
- Closing costs
- $2,850
- Reserves months
- —
- Total cash needed
- —
Loan-product check · same deal, 3 products live
Conventional
25% down · 7.5% · 30yr
- Down + closing
- —
- Monthly P&I
- —
- Monthly cashflow
- —
- DSCR
- —
- Eligible?
- —
Personal DTI + credit; lowest rate.
DSCR
20% down · 8.5% · 30yr
- Down + closing
- —
- Monthly P&I
- —
- Monthly cashflow
- —
- DSCR
- —
- Eligible?
- —
No personal income docs; deal must DSCR.
Hard money
10% down · 12.0% · 12mo
- Down + closing
- —
- Monthly P&I
- —
- Monthly cashflow
- —
- DSCR
- —
- Eligible?
- —
Short-term bridge; refi at stabilization.
Rent comps 40 comps
| Address | Beds | Baths | Sqft | Rent | $/sqft | DOM | Units | Dist |
|---|---|---|---|---|---|---|---|---|
| 2009 Palmetto St Montgomery, AL | 3.0 | 1.0 | 1487 | $1,050 | $0.71 | 44d | 1 | 0.41mi |
| 2113 Brewton St Montgomery, AL | 3.0 | 1.0 | 1363 | $1,150 | $0.84 | 44d | 1 | 0.49mi |
| 2004 Capitol Ave Unit 1043879P Montgomery, AL | 4.0 | 2.5 | 1797 | $3,518 | $1.96 | 14d | 1 | 0.61mi |
| 3136 Harrison Rd Montgomery, AL | 3.0 | 1.5 | 1355 | $1,025 | $0.76 | 44d | 1 | 0.66mi |
| 128 S Capitol Pkwy Montgomery, AL | 3.0 | 1.0 | 1550 | $1,500 | $0.97 | 44d | 1 | 0.74mi |
| 15 Bradley Dr Montgomery, AL | 3.0 | 2.0 | 1365 | $1,500 | $1.10 | 22d | 1 | 0.81mi |
| 18 Oak Forest Dr Montgomery, AL | 3.0 | 2.0 | 1580 | $1,050 | $0.66 | 22d | 1 | 0.83mi |
| 7 Bradley Dr Montgomery, AL | 3.0 | 2.0 | 1529 | $1,500 | $0.98 | 14d | 1 | 0.84mi |
| 2243 Winona Ave Montgomery, AL | 3.0 | 1.0 | 1492 | $1,225 | $0.82 | 22d | 1 | 0.84mi |
| 2009 Bullard St Montgomery, AL | 5.0 | 2.0 | 1992 | $1,975 | $0.99 | 22d | 1 | 0.90mi |
| 2014 Commodore St Montgomery, AL | 3.0 | 2.0 | 1613 | $1,450 | $0.90 | 14d | 1 | 0.91mi |
| 401 Ridgewood Ln Montgomery, AL | 3.0 | 2.0 | 1513 | $1,195 | $0.79 | 22d | 1 | 0.94mi |
| 2045 Bullard St Unit 1043526P Montgomery, AL | 3.0 | 2.0 | 1797 | $2,198 | $1.22 | 44d | 1 | 0.98mi |
| 2043 Hazel Hedge Ln Montgomery, AL | 4.0 | 3.0 | 2001 | $1,650 | $0.82 | 14d | 1 | 0.98mi |
| 2053 Gorgas St Montgomery, AL | 3.0 | 1.0 | 1955 | $1,200 | $0.61 | 22d | 1 | 0.99mi |
| 3233 Hillcrest Ln Montgomery, AL | 3.0 | 2.0 | 1278 | $1,395 | $1.09 | 22d | 1 | 1.01mi |
| 1827 Pinecrest Dr Montgomery, AL | 4.0 | 3.0 | 1893 | $1,550 | $0.82 | 14d | 1 | 1.01mi |
| 3309 Hillcrest Ln Unit 1043908P Montgomery, AL | 4.0 | 2.0 | 1625 | $2,885 | $1.78 | 22d | 1 | 1.05mi |
| 926 Green Ridge Ct Montgomery, AL | 3.0 | 2.0 | 1665 | $1,381 | $0.83 | 14d | 1 | 1.07mi |
| 3359 Bedford Ln Montgomery, AL | 4.0 | 2.0 | 1786 | $1,600 | $0.90 | 14d | 1 | 1.07mi |
| 3329 Vermont Dr Montgomery, AL | 3.0 | 1.5 | 1465 | $1,395 | $0.95 | 14d | 1 | 1.12mi |
| 1842 Gillespie Dr Montgomery, AL | 4.0 | 2.0 | 1620 | $1,650 | $1.02 | 44d | 1 | 1.12mi |
| 1839 Robison Hill Rd Montgomery, AL | 4.0 | 2.0 | 1370 | $1,550 | $1.13 | 22d | 1 | 1.14mi |
| 950 Karen Rd Montgomery, AL | 5.0 | 2.0 | 2400 | $1,650 | $0.69 | 14d | 1 | 1.21mi |
| 1008 Pelham St Montgomery, AL | 4.0 | 2.0 | 1288 | $1,300 | $1.01 | 44d | 1 | 1.21mi |
| 239 Forest Hills Dr Montgomery, AL | 4.0 | 1.5 | 1500 | $1,450 | $0.97 | 22d | 1 | 1.24mi |
| 1355 Magnolia Curv Montgomery, AL | 3.0 | 3.0 | 2260 | $1,800 | $0.80 | 14d | 1 | 1.24mi |
| 1425 Blairwood Montgomery, AL | 3.0 | 2.0 | 1700 | $1,850 | $1.09 | 14d | 1 | 1.24mi |
| 1117 Karen Rd Montgomery, AL | 3.0 | 1.0 | 1308 | $1,195 | $0.91 | 44d | 1 | 1.28mi |
| 2769 Pelzer Ave Montgomery, AL | 3.0 | 2.0 | 1608 | $1,325 | $0.82 | 44d | 1 | 1.28mi |
| 1814 Sylvan Dr Montgomery, AL | 3.0 | 2.0 | 1785 | $1,400 | $0.78 | 22d | 1 | 1.29mi |
| 3515 Cottonwood Dr Montgomery, AL | 3.0 | 1.5 | 1246 | $1,350 | $1.08 | 44d | 1 | 1.32mi |
| 1450 Crenshaw Pl S Montgomery, AL | 3.0 | 2.0 | 1641 | $1,775 | $1.08 | 44d | 1 | 1.33mi |
| 817 Dumont Dr Montgomery, AL | 3.0 | 2.0 | 1635 | $1,800 | $1.10 | 14d | 1 | 1.35mi |
| 1216 Karen Rd Montgomery, AL | 3.0 | 2.0 | 1620 | $1,350 | $0.83 | 14d | 1 | 1.35mi |
| 3602 Little John Dr Montgomery, AL | 4.0 | 1.0 | 1286 | $1,400 | $1.09 | 22d | 1 | 1.38mi |
| 844 Sir Michael Dr Montgomery, AL | 4.0 | 2.0 | 1502 | $1,650 | $1.10 | 44d | 1 | 1.38mi |
| 1229 Karen Rd Montgomery, AL | 4.0 | 2.0 | 1344 | $1,590 | $1.18 | 44d | 1 | 1.39mi |
| 3667 Willow Lane Dr Montgomery, AL | 5.0 | 3.0 | 2565 | $1,850 | $0.72 | 44d | 1 | 1.40mi |
| 2814 Ashley Ave Montgomery, AL | 3.0 | 2.0 | 1683 | $1,350 | $0.80 | 14d | 1 | 1.42mi |
Listing history 6 events
-
2026-06-18days on market $95,000 Active 6 DOM
-
2026-06-17days on market $95,000 Active 5 DOM
-
2026-06-16days on market $95,000 Active 4 DOM
-
2026-06-15days on market $95,000 Active 3 DOM
-
2026-06-13remarks 245-char remark
-
2026-06-13$95,000 Active 1 DOM
ⓘ Source: listings_history table (triggers on properties + properties_extension) + one-shot
backfill from property_details.listing_events for pre-trigger history.
Tax reassessment forecast AL · Resets to sale price
- Current annual tax
- $951 · $79/mo
- Projected year-2 tax
- $951 · $79/mo
- Expected delta
- $0/yr ($0/mo · 0.0%)
ⓘ Screening estimate from a state-policy table — verify with the county assessor before closing.
Climate risk First Street
- Flood 1/10 Low FEMA zone X (unshaded) · 0% chance over 30 yrs
- Wildfire 1/10 Low
- Heat 7/10 Severe 7 d/yr ≥107°F today · 19 d/yr by 30 yrs out
- Wind 8/10 Severe 80% chance of damaging wind over 30 yrs
- Air quality 3/10 Moderate 4 unhealthy d/yr today · 4 by 30 yrs out
Nearby sold comps map
Loading sold comps map…
Walkable amenities ~0.75 mi
Loading nearby amenities…
Taxation est. · year 1
- Rental income
- $22,560
- − Mortgage interest
- −$5,321
- − Property taxes
- −$951
- − Insurance
- −$475
- − Repairs & maintenance
- −$1,805
- − Management
- −$1,805
- − Depreciation
- −$2,764
- Taxable income
- $9,440
- Est. tax owed @ 24.0%
- −$2,266
- After-tax cash flow
- $8,153/yr
For passive investors: Depreciation is non-cash, so a rental often shows a tax loss while cash-flowing — sheltering income. Rental losses are passive: they offset passive income freely, and up to $25,000/yr can offset ordinary (W-2) income if you actively participate and your MAGI is under $100k (phasing out to $0 by $150k); unused losses carry forward. On sale, claimed depreciation is recaptured at up to 25%, and gains may owe capital-gains tax (a 1031 exchange can defer both). Figures are a year-1 estimate at your 24.0% rate — not tax advice; consult a CPA.
Schools (NCES district)
- District
- Montgomery County
- NCES district ID
- 0102430
- Math proficiency
- 9% ▼ -21.00%
- Reading proficiency
- 31% ▼ -1.00%
- Median HH income
- $43,902
- Composite
- 17.24/100
- National rank
- #9093
- State rank
- #106 of 129 in AL
Livability — Montgomery
- Score
- 65/100
- State rank
- #138
- US rank
- #13416
Category grades
Schools grade is shown separately in the Schools card above.
Census & demographics
- Census place
- Montgomery, AL
- County
- Montgomery County · 190,016 people
- City population
- 175,913
- Metro
- Montgomery, AL
- Population (ZIP)
- 8,001
- Household income
- $32,492
- Rent vs Own
- Severe rent burden
- 642.0
Population outlook (Montgomery County) Hauer SSP2
- Today (2025)
- 224,008 people
- By 2030
- 221,460 · -1.1%
- By 2040
- 214,179 · -4.4%
- By 2050
- 204,912 · -8.5%
- By 2075
- 177,821 · -20.6%
- By 2100
- 145,134 · -35.2%
Race, ethnicity, and origin ACS 2023
- Neighborhood character
- Diverse neighborhood (Simpson 0.69)
- Race & ethnicity
- Black 43% White 27% Hispanic / Latino 23% Two or more races 20%
- Hispanic origin (detail)
- Mexican 8% Cuban 3%
- Common ancestry
- Slovak 1% Iranian 1% Serbian 1%
- Foreign-born
- 11% · Canada
- Languages at home
- 83% English-only · Spanish 13%
Political lean MEDSL · Montgomery
- 2024 margin
- Solid D (+30.7) · D 64.8% · R 34.1% · Other 1.1%
- 2008→2024 swing
- +11.5pp toward D · 2008: 19.2pp · 2024: 30.7pp
- All cycles
- 2024: D+30.7 2020: D+31.5 2016: D+26.2 2012: D+24.3 2008: D+19.2
Not yet ingested
- Civics
- —
Market trends
- HPI YoY
- ▼ -18.16%
- Current HPI
- 147.8065
- Rent YoY
- ▲ 5.05%
- Metro
- Montgomery, AL
- State GDP YoY
- ▲ 2.94%
- F500 in state
- 4
Industry mix (Fortune 500 HQ in AL)
| Industry | F500 HQs | Revenue |
|---|---|---|
| Financial Services | 1 | $8B |
|
||
| Healthcare | 1 | $5B |
|
||
Price history
+35.7% since first listed8 events — show timeline
- 2026-06-13 Listed $95,000 FSBO.com
- 2018-03-01 Sold (Public Records) $15,000 Public Records
- 2018-02-28 Sold (MLS) $15,000 MAAR
- 2017-10-31 Listed $24,900 MAAR
- 2016-12-29 Sold (MLS) $13,000 MAAR
- 2016-09-30 Listed $13,900 MAAR
- 2005-05-23 Sold (MLS) $70 MAAR
- 2004-12-14 Listed $70,000 MAAR
Property tax history
+7.3%/yrLatest (2025): $951 · +0.8% YoY. Source: county tax records.
Cash-flow waterfall
monthlySold comps — $/sqft
last 12 mo · ≤1 miLoading sold comps…