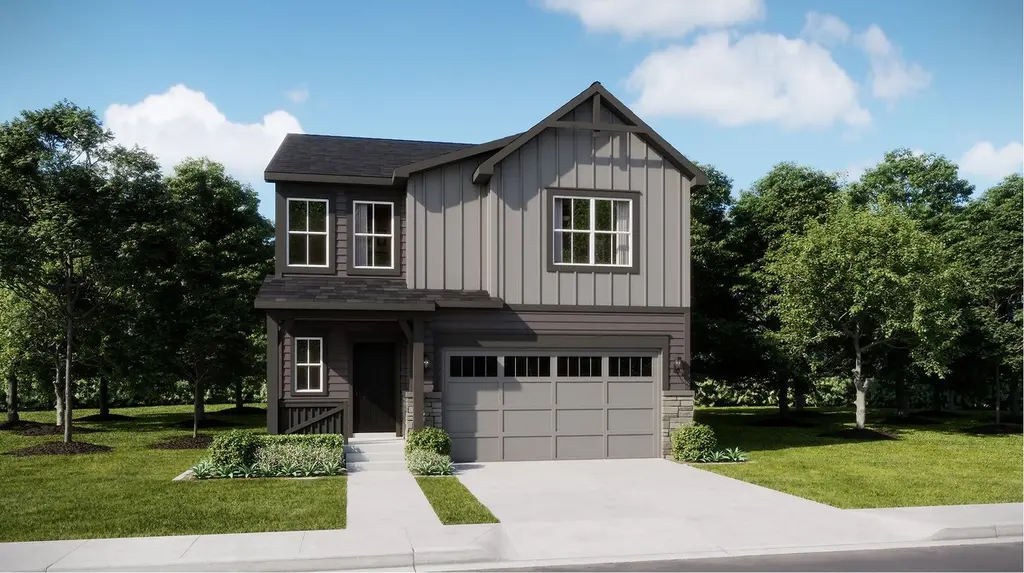
395 Wildflower Ct · Bennett, CO
Flood risk No data
- FEMA flood zone
- —
- Chance of flooding over 30 yrs
- —
- Est. flood insurance / yr
- —
Fire risk No data
- Est. fire insurance / yr
- —
Heat risk No data
- Hot days now (above threshold)
- —
- Hot days in 30 yrs
- —
Wind risk No data
- Chance of severe wind over 30 yrs
- —
Air-quality risk No data
- Unhealthy air days now
- —
- Unhealthy air days in 30 yrs
- —
Risk factors via First Street. Map © Google.
Why this score? — see what drove the D grade
The composite is a weighted blend of 9 inputs, each scored 0–100. Each bar is that input's sub-score; the figure is the points it added to the 100-point composite (weight × sub-score).
- Appreciation +10.0/10.0
- ARV discount +9.4/15.0
- Cash flow +7.6/30.0
- Livability +3.0/5.0
- 1% rule +2.5/10.0
- Rent growth +2.5/5.0
- Condition / age +2.5/5.0
- Schools +2.1/10.0
- DSCR +1.8/10.0
$464,900
🖨 Deal sheet (PDF) 📄 Offer letter ✓ Due diligence
Listing remarks
* * * * Contact builder today about Special Financing for this home - terms and conditions apply * * Anticipated Completion July 2026!! Beautiful Grove 2-story in Muegge Farms is features 5 beds, 2.5 baths, great room, kitchen, crawlspace and a 2 car garage. Beautiful upgrades and finishes including a large kitchen island, stainless steel appliances, luxury vinyl plank flooring and more. The builder seamlessly blended & showcased the unparalleled beauty of Colorado with the most innovative homes, energy efficient technologies & modern conveniences, bringing the best of both worlds together. Beautiful finishes and upgrades throughout. This builder provides the latest in
Key facts
- Large kitchen island
- 5,500 sq ft lot
- 2 garage spots
Tags
Property features AI
Finance
- Financial info: List price $464,900
Exterior
- Parking: 2 total parking spaces; 2-car garage
- Home design: Spec new construction, Grove plan; Single-family property
- Exterior features: Living area of 2,112
Interior
- Bedrooms: 5 bedrooms
- Bathrooms: 2 full bathrooms; 1 half bathroom
- Interior features: 2.5 bathrooms total (2 full, 1 half)
Neighborhood map
What this means for you Summary
Snapshot
- This is a 5-bed/3.0-bath single-family listed at $465k.
Deal economics
- At list price, monthly cash flow is $-548 ($-7k/yr) — negative.
- To cash-flow at today's rent, offer at most $386k (17.1% below list).
- To meet the 1% rule (rent ≥ 1% of price), the offer needs to be $350k (24.7% below list).
- Recommended offer: $350k (24.7% below list) — sets the bar for 1% rule.
Location & tenants
- Location reads 59/100 on livability (#263 in CO) — a working-class tenant base; expect higher turnover. Strengths: housing A+, crime A-; Watch: cost of living D+, amenities F, commute F.
- Bennett School District No. 29J (rural): math 13% / reading 31% proficiency, ranked #69 of 86 in CO (top 80%) — low school quality limits family demand, transient renter base, plan for 1-2y turnover.
- Zoned schools: Bennett Elementary School (math 24% / reading 12%, grade F, #745 of 966 statewide, top 77%, 257 students, 37% FRL); Bennett Middle School (math 8% / reading 42%, grade F, #168 of 270 statewide, top 63%, 304 students, 38% FRL); Bennett High School (math 22% / reading 47%, grade F, #209 of 381 statewide, top 56%, 427 students, 25% FRL).
- Market conditions: 213 active listings in the ZIP; 1 comparable units currently listed for rent nearby; 2,299 units permitted in Adams County in 2024 (343 in 5+ unit buildings).
Forward outlook
- In year one you build about $50k of equity ($3k loan paydown + $46k appreciation (10.0% local appreciation)).
- Adams County population projected at +44% by 2050 — long-run rental-demand tailwind backs the buy-and-hold thesis.
- By year 2, paydown + projected appreciation supports a ~$80k cash-out refi (75% LTV) — recoverable capital for the next deal without selling this one.
Negotiation context
- Only 4 days on market — expect competitive offers; lowballing is unlikely to land.
Questions for the listing agent
- What do current leases actually rent for vs. the listed asking? Can we see a recent rent roll and the last 12 months of T-12 income?
- What does the HOA fee cover, when was the last increase, and are there any pending special assessments or reserve-fund shortfalls?
- Is there a deadline driving the sale (1031 exchange, divorce, estate, relocation)? That informs how much negotiation room exists.
- Schools are F-rated, which usually means shorter tenancies and higher turnover. Who's the typical renter profile here, and what's been the actual vacancy rate?
- The area grade is low — what's the realistic commute time and amenity access for the typical tenant pool here? Any planned neighborhood developments (good or bad) we should know about?
- What's the average days-on-market for RENTAL listings here right now (not sales)? A rising rental-DOM trend means longer vacancies and softer asking-rent achievability than the comps imply.
- What's the recent tenant-quality profile in this submarket — average credit score on applications, eviction rate, late-payment / NSF rate, and stable-employment percentage? A property-management company in the area should have these aggregated.
- How much new for-sale + rental construction is in the pipeline within 1–3 miles? Heavy new supply typically softens prices + rents 12–24 months out; constrained supply supports both.
Investment metrics
- 1% rule
- 0.75% ✗
- Cap rate
- 4.88%
- Cash-on-cash
- -5.05%
- DSCR
- 0.78
- GRM
- 11.1
CMA / ARV
- ARV (on-the-fly)
- $485,760
- Comps found
- 12
Show comp detail 12 sales within ~0.75 mi
| Address | Dist | Beds/Ba | Sqft | Sold | Price | $/sf | Match |
|---|---|---|---|---|---|---|---|
| 365 Wildflower Ct | 0.03mi | 5/3.0 | 2,112 (0%) | 0mo | $468,900 | $222 | 98 |
| 45894 Mill Ave | 0.08mi | 5/3.0 | 2,112 (0%) | 0mo | $465,250 | $220 | 96 |
| 45878 Mill Ave | 0.10mi | 5/3.0 | 2,112 (0%) | 1mo | $489,900 | $232 | 94 |
| 45862 Mill Ave | 0.12mi | 5/3.0 | 2,112 (0%) | 3mo | $485,000 | $230 | 92 |
| 45907 Mill Ave | 0.08mi | 4/3.0 (-1) | 2,184 (+3%) | 1mo | $489,350 | $224 | 85 |
| 221 Sage Grouse Way | 0.19mi | 4/3.0 (-1) | 2,082 (-1%) | 6mo | $514,950 | $247 | 79 |
| 45886 Mill Ave | 0.09mi | 4/3.0 (-1) | 1,880 (-11%) | 1mo | $451,400 | $240 | 72 |
| 45870 Mill Ave | 0.11mi | 4/3.0 (-1) | 1,880 (-11%) | 3mo | $474,900 | $253 | 69 |
| 231 Sage Grouse Way | 0.18mi | 4/3.0 (-1) | 2,407 (+14%) | 3mo | $527,050 | $219 | 61 |
| 46537 Sunflower Ln | 0.32mi | 4/4.0 (-1) | 1,944 (-8%) | 4mo | $429,999 | $221 | 59 |
| 46581 Sunflower Ln | 0.36mi | 4/4.0 (-1) | 1,930 (-9%) | 3mo | $481,720 | $250 | 58 |
| 46561 Sunflower Ln | 0.34mi | 4/4.0 (-1) | 1,944 (-8%) | 5mo | $447,000 | $230 | 57 |
Match score weights: distance 35% · size 25% · config 20% · recency 20%. Top-matched comps best support the ARV.
Projected returns pro-forma
10.0% appreciation · 3.0% rent growth · sell at horizon
- IRR
- 20.7%
- Equity multiple
- 2.68×
- Total profit
- $218,420
- Equity at exit
- $418,819
- IRR
- 18.8%
- Equity multiple
- 6.15×
- Total profit
- $670,877
- Equity at exit
- $903,198
Cash invested: $130,172 (down + closing). Projections, not guarantees.
Landlord ↔ Tenant lean methodology
- Overall (STATE)
- 38 Tenant-Leaning
- State Colorado
- 38 Tenant-Leaning · D+4
- County
- — inherits STATE
- City
- — inherits STATE
ZIP-level market 80102
- Home prices YoY
- 3.1%
- Active inventory
- 213
- Price-to-rent
- 11.1×
Monthly cashflow live
- Estimated rent
- $3,500 medium interval (Pro) →
- Mortgage (P&I)
- −$2,438
- Tax est. 1.5%
- −$581 /mo · $6,974/yr
- Insurance
- −$194
- HOA
- −$100
- Vacancy / Maint / Mgmt
- −$735
- Net cashflow
- $-548
Break-even live
Sensitivity live
| Price | -10% $-227 | -5% $-387 | +0% $-548 | +5% $-708 | +10% $-869 |
|---|---|---|---|---|---|
| Rent | -10% $-824 | -5% $-686 | +0% $-548 | +5% $-410 | +10% $-271 |
| Rate | -1.0pp $-314 | -0.5pp $-430 | base $-548 | +0.5pp $-668 | +1.0pp $-791 |
UW: 25.0% down · 7.5% · 30yr · 1.5% tax · 5.0% vac · 8.0% maint · 8.0% mgmt
Financing live
Cash to close
- Down payment
- $116,225
- Closing costs
- $13,947
- Reserves months
- —
- Total cash needed
- —
Loan-product check · same deal, 3 products live
Conventional
25% down · 7.5% · 30yr
- Down + closing
- —
- Monthly P&I
- —
- Monthly cashflow
- —
- DSCR
- —
- Eligible?
- —
Personal DTI + credit; lowest rate.
DSCR
20% down · 8.5% · 30yr
- Down + closing
- —
- Monthly P&I
- —
- Monthly cashflow
- —
- DSCR
- —
- Eligible?
- —
No personal income docs; deal must DSCR.
Hard money
10% down · 12.0% · 12mo
- Down + closing
- —
- Monthly P&I
- —
- Monthly cashflow
- —
- DSCR
- —
- Eligible?
- —
Short-term bridge; refi at stabilization.
Rent comps 1 comps
| Address | Beds | Baths | Sqft | Rent | $/sqft | DOM | Units | Dist |
|---|---|---|---|---|---|---|---|---|
| 129 Racer St Bennett, CO | 4.0 | 3.0 | 2536 | $3,500 | $1.38 | 26d | 1 | 0.30mi |
HOA detail
- Monthly dues
- $100 · $1,200/yr
Listing history 10 events
-
2026-06-21days on market $464,900 Active 4 DOM
-
2026-06-17remarks 691-char remark
-
2026-06-17days on market $464,900 Active 1 DOM
-
2026-06-17days on market $464,900 Active 8 DOM
-
2026-06-16days on market $464,900 Active 7 DOM
-
2026-06-15days on market $464,900 Active 6 DOM
-
2026-06-13days on market $464,900 Active 4 DOM
-
2026-06-13days on market $464,900 Active 3 DOM
-
2026-06-10remarks 320-char remark
-
2026-06-10$464,900 Active 1 DOM
ⓘ Source: listings_history table (triggers on properties + properties_extension) + one-shot
backfill from property_details.listing_events for pre-trigger history.
Nearby sold comps map
Loading sold comps map…
Walkable amenities ~0.75 mi
Loading nearby amenities…
Taxation est. · year 1
- Rental income
- $42,000
- − Mortgage interest
- −$26,042
- − Property taxes
- −$6,974
- − Insurance
- −$2,324
- − Repairs & maintenance
- −$3,360
- − Management
- −$3,360
- − HOA
- −$1,200
- − Depreciation
- −$13,524
- Taxable loss
- −$14,784
- Est. tax savings @ 24.0%
- +$3,548
- After-tax cash flow
- $-3,026/yr
For passive investors: Depreciation is non-cash, so a rental often shows a tax loss while cash-flowing — sheltering income. Rental losses are passive: they offset passive income freely, and up to $25,000/yr can offset ordinary (W-2) income if you actively participate and your MAGI is under $100k (phasing out to $0 by $150k); unused losses carry forward. On sale, claimed depreciation is recaptured at up to 25%, and gains may owe capital-gains tax (a 1031 exchange can defer both). Figures are a year-1 estimate at your 24.0% rate — not tax advice; consult a CPA.
Schools (NCES district)
- District
- Bennett School District No. 29J
- NCES district ID
- 0802430
- Math proficiency
- 13% ▼ -10.00%
- Reading proficiency
- 31% ▼ -9.00%
- Median HH income
- $69,795
- Composite
- 21.39/100
- National rank
- #8353
- State rank
- #69 of 86 in CO
Livability — Bennett
- Score
- 59/100
- State rank
- #263
- US rank
- #19691
Category grades
Schools grade is shown separately in the Schools card above.
Census & demographics
- Census place
- Bennett, CO
- City population
- 5,994
- Population (ZIP)
- 5,994
Population outlook (Adams County) Hauer SSP2
- Today (2025)
- 598,184 people
- By 2030
- 651,880 · +9.0%
- By 2040
- 759,778 · +27.0%
- By 2050
- 862,889 · +44.3%
- By 2075
- 1,085,994 · +81.5%
- By 2100
- 1,211,318 · +102.5%
Race, ethnicity, and origin ACS 2023
- Neighborhood character
- Predominantly White (72%)
- Race & ethnicity
- White 72% Hispanic / Latino 21% Two or more races 11% Black 2%
- Hispanic origin (detail)
- Mexican 17% Puerto Rican 1%
- Common ancestry
- Serbian 4% Italian 3% Lithuanian 2%
- Foreign-born
- 6% · Canada, China
- Languages at home
- 87% English-only · Spanish 10% German/W. Germanic 1% Chinese 1%
Political lean MEDSL · Adams
- 2024 margin
- Lean D (+9.0) · D 53.2% · R 44.1% · Other 2.7%
- 2008→2024 swing
- -9.3pp toward R · 2008: 18.4pp · 2024: 9.0pp
- All cycles
- 2024: D+9.0 2020: D+16.3 2016: D+7.2 2012: D+15.1 2008: D+18.4
Not yet ingested
- Civics
- —
Market trends
- HPI YoY
- ▲ 14.94%
- Current HPI
- 494.39
- Rent YoY
- —
- Metro
- —
- State GDP YoY
- ▲ 1.95%
- F500 in state
- 14
Industry mix (Fortune 500 HQ in CO)
| Industry | F500 HQs | Revenue |
|---|---|---|
| Technology Distribution | 1 | $31B |
|
||
| Food / Agriculture | 1 | $18B |
|
||
| Packaging | 1 | $14B |
|
||
| Healthcare | 1 | $13B |
|
||
| Energy | 1 | $10B |
|
||
| Technology | 1 | $4B |
|
||
Cash-flow waterfall
monthlySold comps — $/sqft
last 12 mo · ≤1 miLoading sold comps…