 Multi-family
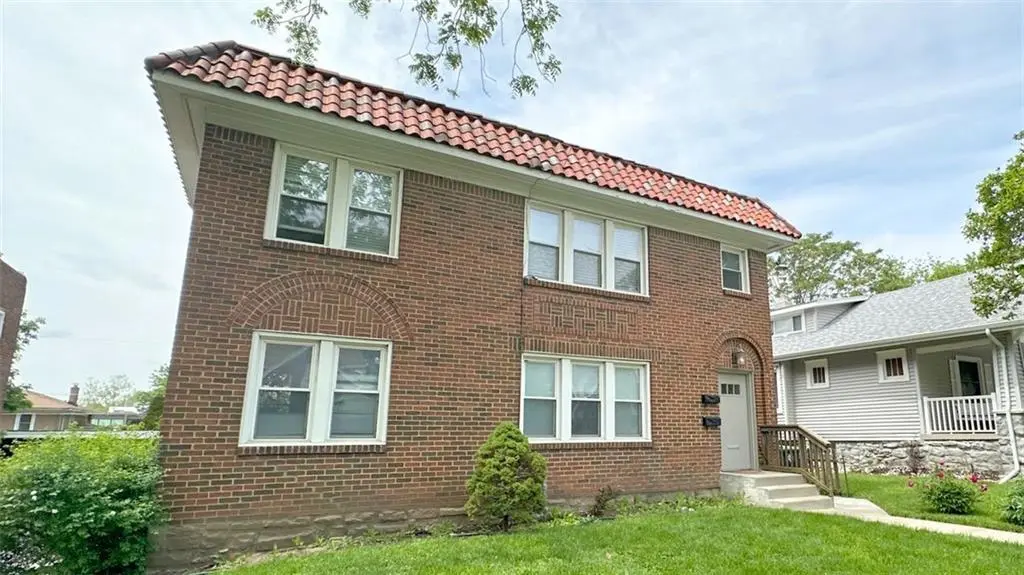
4232 Holly St · Kansas City, MO
Flood risk 1/10 · Minimal
- FEMA flood zone
- X (unshaded)
- Chance of flooding over 30 yrs
- 0.0%
- Est. flood insurance / yr
- $473 – $860
Fire risk 1/10 · Minimal
- Est. fire insurance / yr
- $1,054 – $1,958
Heat risk 4/10 · Minor
- Hot days now (above 106°F)
- 7 days/yr
- Hot days in 30 yrs
- 17 days/yr
Wind risk 2/10 · Minimal
- Chance of severe wind over 30 yrs
- —
Air-quality risk 3/10 · Minor
- Unhealthy air days now
- 2 days/yr
- Unhealthy air days in 30 yrs
- 3 days/yr
Risk factors via First Street. Map © Google.
Why this score? — see what drove the D grade
The composite is a weighted blend of 9 inputs, each scored 0–100. Each bar is that input's sub-score; the figure is the points it added to the 100-point composite (weight × sub-score).
- ARV discount +14.4/15.0
- Cash flow +12.1/30.0
- Livability +3.9/5.0
- DSCR +3.6/10.0
- Rent growth +3.4/5.0
- 1% rule +2.7/10.0
- Condition / age +2.5/5.0
- Schools +1.5/10.0
- Appreciation +0.0/10.0
$399,900
🖨 Deal sheet (PDF) 📄 Offer letter ✓ Due diligence
Multi-family units
County records classify this as Multi-Family (2-4 Unit). Listing-text estimate: 1 unit. estimate disagrees with records
Listing remarks MLS
Two well kept all brick duplexes. Four units total, all two bedroom one bath units with a bonus room. Generous room sizes, thermal windows, Forced air heat and central air conditioning. Units are metered separately for electricity and gas but water is central for both buildings and paid by the owner. 36 building has new baths with W/ D in them. 32 building has common laundry supplied by the owner in the basement. One unit in each building has a new kitchen. All units have a carport. Close to Westport, the Plaza, KU Med, 39th Street shopping and much more. A great block and a solid location!
Key facts
- 6,490 sq ft lot
- Built 1930
- Listed 52 days
Property features AI
Finance
- Other: Zoned R-5; Two total units; Current occupancy under 80%; Road responsibility: public maintenance
- Financial info: Gross income reported at $30,600; Operating expenses may include maintenance, insurance, real estate tax, and water/sewer
- HOA & community: Building exterior, HVAC, lawn, roof repair/replacement, and snow removal maintenance handled
Exterior
- Parking: Carport
- Utilities: Public water; Public sewer; Cable available; Fiber available; High-speed internet available; Metro service available
- Home design: Duplex residential income property; 2 stories
- Construction: Brick construction; Other roof type; Built approximately 76-100 years ago
- Exterior features: Public-maintained street; Flood plain status unknown
Interior
- Kitchen: Dishwasher; Range/oven; Refrigerator
- Bedrooms: Two-bedroom units
- Bathrooms: One bathroom per unit
- Heating & cooling: Forced air heating; Electric cooling
- Interior features: Individual storage for units; Applies to all units
- Laundry & utility: Laundry located in basement; Separate meters; Individual water heaters
Neighborhood map
What this means for you Summary
Snapshot
- This is a 6-bed/2.0-bath multifamily listed at $400k.
Deal economics
- At list price, monthly cash flow is $-87 ($-1k/yr) — negative.
- To cash-flow at today's rent, offer at most $385k (3.8% below list).
- To meet the 1% rule (rent ≥ 1% of price), the offer needs to be $309k (22.8% below list).
- Recommended offer: $309k (22.8% below list) — sets the bar for 1% rule.
- Cap rate 6.0% vs local median 3.9% in Kansas City — top-decile yield for the area; either an underpriced asset or a hidden risk that comps aren't pricing in. Stress-test before assuming the spread holds.
Location & tenants
- Location reads 78/100 on livability (#28 in MO, #2,671 nationally) — a middle-class / working-renter tenant base. Strengths: amenities A+, commute A+, cost of living A+; Watch: crime F.
- Kansas City 33 (urban): math 12% / reading 24% proficiency, ranked #308 of 324 in MO (top 95%) — low school quality limits family demand, transient renter base, plan for 1-2y turnover; 75% free/reduced lunch — lower-income household profile, screen leases tightly.
- Zoned schools: Ac Prep Elementary (math 12% / reading 27%, grade F, #941 of 1,115 statewide, top 86%, 341 students, 99% FRL); Central Middle School (math 0% / reading 9%, grade F, #388 of 391 statewide, top 99%, 428 students, 99% FRL); Southeast High School (math 2% / reading 12%, grade F, #512 of 521 statewide, top 99%, 487 students, 99% FRL) — zoned schools average 99% FRL vs 75% district-wide (24 pts higher); higher-poverty schools than district average — tighter screening recommended.
- Market conditions: Rents rising (+3.4%/yr); 168 active listings in the ZIP; 2 comparable units currently listed for rent nearby; 4,002 units permitted in Jackson County in 2024 (2,271 in 5+ unit buildings).
- At $3,088/mo this rent would consume 60% of the median local household income ($62k/yr) (locally 1606% of renters already pay >50% of income on rent) — very limited rent-growth headroom before tenants either downsize or default.
Forward outlook
- Local home prices are declining (-3.0%/yr); year-one equity from $3k of loan paydown is wiped out by about $12k of value loss. Plan a longer hold.
- Jackson County population projected at +4% by 2050 — modest demand growth; plan on rents tracking national, not racing it.
Negotiation context
- It's been on market 53 days — a 3% lower offer ($388k) is reasonable based on typical stale-listing flexibility.
- 5 sale attempts since 24y ago; this cycle's ask has dropped $50k (11%) from the opening price — seller is motivated, your offer sets the floor, not the list.
Risks & watch-outs
- Watch-outs: built in 1930 — expect roof / HVAC / electrical / plumbing capex.
Questions for the listing agent
- What do current leases actually rent for vs. the listed asking? Can we see a recent rent roll and the last 12 months of T-12 income?
- It's been on market 53 days. Have you received any prior offers? Is the seller open to a 23% concession, seller financing, or rate buy-down credit?
- Built in 1930 — when were the roof, HVAC, electrical panel, plumbing, and water heater last replaced?
- Is there a deadline driving the sale (1031 exchange, divorce, estate, relocation)? That informs how much negotiation room exists.
- Crime grade is F in this area — have there been break-ins, vandalism, or insurance claims at this property in the last 3 years? What carrier currently insures it and at what premium?
- The area grade is low — what's the realistic commute time and amenity access for the typical tenant pool here? Any planned neighborhood developments (good or bad) we should know about?
- What's the average days-on-market for RENTAL listings here right now (not sales)? A rising rental-DOM trend means longer vacancies and softer asking-rent achievability than the comps imply.
- What's the recent tenant-quality profile in this submarket — average credit score on applications, eviction rate, late-payment / NSF rate, and stable-employment percentage? A property-management company in the area should have these aggregated.
- How much new apartment / multifamily construction is in the pipeline within 1–3 miles? Heavy new supply (>2% of stock underway) typically softens rents 12–24 months out; light construction supports rent growth.
Investment metrics
- 1% rule
- 0.77% ✗
- Cap rate
- 6.03%
- Cash-on-cash
- -0.93%
- DSCR
- 0.96
- GRM
- 10.8
CMA / ARV
- ARV (median comp)
- $472,837
- List price
- $399,900
- Delta
- -15.43%
- Verdict
- UNDERPRICED
- Comps
- 20 within 1.0 mi
Projected returns pro-forma
-3.0% appreciation · 3.42% rent growth · sell at horizon
- IRR
- -17.4%
- Equity multiple
- 0.38×
- Total profit
- $-69,131
- Equity at exit
- $59,626
- IRR
- -8.8%
- Equity multiple
- 0.44×
- Total profit
- $-62,312
- Equity at exit
- $34,576
Cash invested: $111,972 (down + closing). Projections, not guarantees.
Landlord ↔ Tenant lean methodology
- Overall (STATE)
- 81 Strongly Landlord-Friendly
- State Missouri
- 81 Strongly Landlord-Friendly · R+10
- County
- — inherits STATE
- City
- — inherits STATE
ZIP-level market 64111
- Rents YoY
- 3.4%
- Active inventory
- 168
- Price-to-rent
- 21.6×
Monthly cashflow live
- Estimated rent
- $3,088 high interval (Pro) →
- Mortgage (P&I)
- −$2,097
- Tax from tax record
- −$263 /mo · $3,153/yr
- Insurance
- −$167
- HOA
- −$0
- Vacancy / Maint / Mgmt
- −$648
- Net cashflow
- $-87
Break-even live
Sensitivity live
| Price | -10% $139 | -5% $26 | +0% $-87 | +5% $-200 | +10% $-313 |
|---|---|---|---|---|---|
| Rent | -10% $-331 | -5% $-209 | +0% $-87 | +5% $35 | +10% $157 |
| Rate | -1.0pp $114 | -0.5pp $15 | base $-87 | +0.5pp $-191 | +1.0pp $-296 |
2-unit breakdown (identical units grouped — click to expand)
| Units | Beds | Baths | Est. rent |
|---|---|---|---|
| 2× units | 2 | 1 | $3,088 |
| #1 | 2 | 1 | $1,544 |
| #2 | 2 | 1 | $1,544 |
| Total (2 units) | $3,088 | ||
UW: 25.0% down · 7.5% · 30yr · 1.5% tax · 5.0% vac · 8.0% maint · 8.0% mgmt
Financing live
Cash to close
- Down payment
- $99,975
- Closing costs
- $11,997
- Reserves months
- —
- Total cash needed
- —
Loan-product check · same deal, 3 products live
Conventional
25% down · 7.5% · 30yr
- Down + closing
- —
- Monthly P&I
- —
- Monthly cashflow
- —
- DSCR
- —
- Eligible?
- —
Personal DTI + credit; lowest rate.
DSCR
20% down · 8.5% · 30yr
- Down + closing
- —
- Monthly P&I
- —
- Monthly cashflow
- —
- DSCR
- —
- Eligible?
- —
No personal income docs; deal must DSCR.
Hard money
10% down · 12.0% · 12mo
- Down + closing
- —
- Monthly P&I
- —
- Monthly cashflow
- —
- DSCR
- —
- Eligible?
- —
Short-term bridge; refi at stabilization.
Rent comps 2 comps
| Address | Beds | Baths | Sqft | Rent | $/sqft | DOM | Units | Dist |
|---|---|---|---|---|---|---|---|---|
| 3517 Jefferson St Kansas City, MO | 5.0 | 3.5 | 3200 | $3,600 | $1.12 | 18d | 1 | 0.99mi |
| 3327 Wyandotte St Kansas City, MO | 5.0 | 2.5 | 2902 | $2,495 | $0.86 | 45d | 1 | 1.31mi |
Listing history 30 events
-
2026-06-21days on market $399,900 Active 53 DOM
-
2026-06-18days on market $399,900 Active 50 DOM
-
2026-06-17days on market $399,900 Active 49 DOM
-
2026-06-16days on market $399,900 Active 48 DOM
-
2026-06-15days on market $399,900 Active 47 DOM
-
2026-06-13days on market $399,900 Active 45 DOM
-
2026-06-09days on market $399,900 Active 41 DOM
-
2026-06-08days on market $399,900 Active 40 DOM
-
2026-06-07days on market $399,900 Active 39 DOM
-
2026-06-05days on market $399,900 Active 36 DOM
-
2026-06-03days on market $399,900 Active 35 DOM
-
2026-06-02days on market $399,900 Active 34 DOM
-
2026-06-02remarks 639-char remark
-
2026-06-02price $399,900 Active 33 DOM
-
2026-06-01days on market $450,000 Active 33 DOM
-
2026-05-31days on market $450,000 Active 32 DOM
-
2026-04-30$450,000 Active 599-char remark
-
2026-04-23historical $450,000 599-char remark
-
2021-08-24historical 597-char remark
Show marketing remark (597 chars)
Two well kept all brick duplexes. Four units total, all two bedroom one bath units with a bonus room. Generous room sizes, thermal windows, Forced air heat and central air conditioning. Units are metered separately for electricity and gas but water is central for both buildings and paid by the owner. 36 building has new baths with W/ D in them. 32 building has common laundry supplied by the owner in the basement. One unit in each building has a new kitchen. All units have a carport. Close to Westport, the Plaza, KU Med, 39th Street shopping and much more. A great block and a solid location!
-
2021-07-21$950,000 Active 597-char remark
Show marketing remark (597 chars)
Two well kept all brick duplexes. Four units total, all two bedroom one bath units with a bonus room. Generous room sizes, thermal windows, Forced air heat and central air conditioning. Units are metered separately for electricity and gas but water is central for both buildings and paid by the owner. 36 building has new baths with W/ D in them. 32 building has common laundry supplied by the owner in the basement. One unit in each building has a new kitchen. All units have a carport. Close to Westport, the Plaza, KU Med, 39th Street shopping and much more. A great block and a solid location!
-
2021-07-20historical
-
2021-04-12$500,000 Active
-
2018-11-19soldstatus
-
2018-05-25soldstatus Sold
-
2018-05-01status Pending
-
2018-04-26$300,000 Active
-
2003-01-09soldstatus
-
2003-01-07soldstatus
-
2002-10-29$185,000
-
1995-07-31soldstatus
ⓘ Source: listings_history table (triggers on properties + properties_extension) + one-shot
backfill from property_details.listing_events for pre-trigger history.
Tax reassessment forecast MO · Resets to sale price
- Current annual tax
- $3,153 · $263/mo
- Projected year-2 tax
- $3,879 · $323/mo
- Expected delta
- +$726/yr (+$60/mo · 23.0%)
ⓘ Screening estimate from a state-policy table — verify with the county assessor before closing.
Climate risk First Street
- Flood 1/10 Low FEMA zone X (unshaded) · 0% chance over 30 yrs
- Wildfire 1/10 Low
- Heat 4/10 Moderate 7 d/yr ≥106°F today · 17 d/yr by 30 yrs out
- Wind 2/10 Low
- Air quality 3/10 Moderate 2 unhealthy d/yr today · 3 by 30 yrs out
Nearby sold comps map
Loading sold comps map…
Walkable amenities ~0.75 mi
Loading nearby amenities…
Taxation est. · year 1
- Rental income
- $37,056
- − Mortgage interest
- −$22,401
- − Property taxes
- −$3,153
- − Insurance
- −$2,000
- − Repairs & maintenance
- −$2,964
- − Management
- −$2,964
- − Depreciation
- −$11,633
- Taxable loss
- −$8,060
- Est. tax savings @ 24.0%
- +$1,934
- After-tax cash flow
- $890/yr
For passive investors: Depreciation is non-cash, so a rental often shows a tax loss while cash-flowing — sheltering income. Rental losses are passive: they offset passive income freely, and up to $25,000/yr can offset ordinary (W-2) income if you actively participate and your MAGI is under $100k (phasing out to $0 by $150k); unused losses carry forward. On sale, claimed depreciation is recaptured at up to 25%, and gains may owe capital-gains tax (a 1031 exchange can defer both). Figures are a year-1 estimate at your 24.0% rate — not tax advice; consult a CPA.
Schools (NCES district)
- District
- Kansas City 33
- NCES district ID
- 2916400
- Math proficiency
- 12% ▼ -8.00%
- Reading proficiency
- 24% ▬ 0.00%
- Median HH income
- $35,227
- Composite
- 14.8/100
- National rank
- #9387
- State rank
- #308 of 324 in MO
Livability — Kansas City
- Score
- 78/100
- State rank
- #28
- US rank
- #2671
Category grades
Schools grade is shown separately in the Schools card above.
Census & demographics
- Census place
- Kansas City, MO
- County
- Jackson County · 687,798 people
- City population
- 439,467
- Metro
- Kansas City, MO-KS
- Population (ZIP)
- 16,887
- Household income
- $61,729
- Rent vs Own
- Severe rent burden
- 1606.0
Population outlook (Jackson County) Hauer SSP2
- Today (2025)
- 719,589 people
- By 2030
- 731,456 · +1.6%
- By 2040
- 746,689 · +3.8%
- By 2050
- 749,289 · +4.1%
- By 2075
- 736,227 · +2.3%
- By 2100
- 668,210 · -7.1%
Race, ethnicity, and origin ACS 2023
- Neighborhood character
- Predominantly White (70%)
- Race & ethnicity
- White 70% Hispanic / Latino 10% Black 10% Two or more races 9% Asian 3%
- Hispanic origin (detail)
- Mexican 8%
- Common ancestry
- Lithuanian 3% Slovak 2% Serbian 2%
- Foreign-born
- 6% · Canada, China
- Languages at home
- 90% English-only · Spanish 5% Other Asian/Pacific 1% Chinese 1%
Political lean MEDSL · Jackson
- 2024 margin
- D (+19.3) · D 58.9% · R 39.5% · Other 1.6%
- 2008→2024 swing
- -6.1pp toward R · 2008: 25.4pp · 2024: 19.3pp
- All cycles
- 2024: D+19.3 2020: D+22.0 2016: D+16.6 2012: D+19.0 2008: D+25.4
Not yet ingested
- Civics
- —
Market trends
- HPI YoY
- ▼ -341.84%
- Current HPI
- 282.068
- Rent YoY
- ▲ 3.42%
- Metro
- Kansas City, MO-KS
- State GDP YoY
- ▲ 1.84%
- F500 in state
- 20
Industry mix (Fortune 500 HQ in MO)
| Industry | F500 HQs | Revenue |
|---|---|---|
| Healthcare | 1 | $163B |
|
||
| Insurance | 1 | $21B |
|
||
| Industrial Technology | 1 | $17B |
|
||
| Retail | 1 | $16B |
|
||
| Industrial Distribution | 1 | $10B |
|
||
| Utilities | 1 | $9B |
|
||
Price history
+116.2% since first listed15 events — show timeline
- 2026-06-01 Price Changed $399,900 Heartland MLS as Distributed by MLS Grid
- 2026-04-30 Listed $450,000 Heartland MLS as Distributed by MLS Grid
- 2026-04-23 Coming Soon $450,000 Heartland MLS as Distributed by MLS Grid
- 2021-08-24 Listing Removed — Heartland MLS as Distributed by MLS Grid
- 2021-07-21 Listed $950,000 Heartland MLS as Distributed by MLS Grid
- 2021-07-20 Listing Removed — Heartland MLS as Distributed by MLS Grid
- 2021-04-12 Listed $500,000 Heartland MLS as Distributed by MLS Grid
- 2018-11-19 Sold (Public Records) — Public Records
- 2018-05-25 Sold (MLS) — Heartland MLS as Distributed by MLS Grid
- 2018-05-01 Pending — Heartland MLS as Distributed by MLS Grid
- 2018-04-26 Listed $300,000 Heartland MLS as Distributed by MLS Grid
- 2003-01-09 Sold (MLS) — Heartland MLS as Distributed by MLS Grid
- 2003-01-07 Sold (Public Records) — Public Records
- 2002-10-29 Listed $185,000 Heartland MLS as Distributed by MLS Grid
- 1995-07-31 Sold (Public Records) — Public Records
Property tax history
+3.5%/yrLatest (2025): $3,153 · +22.2% YoY. Source: county tax records.
Cash-flow waterfall
monthlySold comps — $/sqft
last 12 mo · ≤1 miLoading sold comps…