2691 Ridge Rd · Hayes, MI
Flood risk 1/10 · Minimal
- FEMA flood zone
- X (unshaded)
- Chance of flooding over 30 yrs
- 0.0%
- Est. flood insurance / yr
- $473 – $860
Fire risk 3/10 · Minor
- Est. fire insurance / yr
- $784 – $1,456
Heat risk 1/10 · Minimal
- Hot days now (above 94°F)
- 7 days/yr
- Hot days in 30 yrs
- 14 days/yr
Wind risk 1/10 · Minimal
- Chance of severe wind over 30 yrs
- —
Air-quality risk 2/10 · Minimal
- Unhealthy air days now
- 1 days/yr
- Unhealthy air days in 30 yrs
- 1 days/yr
Risk factors via First Street. Map © Google.
Why this score? — see what drove the C- grade
The composite is a weighted blend of 9 inputs, each scored 0–100. Each bar is that input's sub-score; the figure is the points it added to the 100-point composite (weight × sub-score).
- Cash flow +22.4/30.0
- ARV discount +7.5/15.0
- DSCR +7.2/10.0
- 1% rule +5.4/10.0
- Rent growth +2.5/5.0
- Livability +2.5/5.0
- Condition / age +2.5/5.0
- Schools +1.8/10.0
- Appreciation +0.0/10.0
$85,000
🖨 Deal sheet (PDF) 📄 Offer letter ✓ Due diligence
Listing remarks
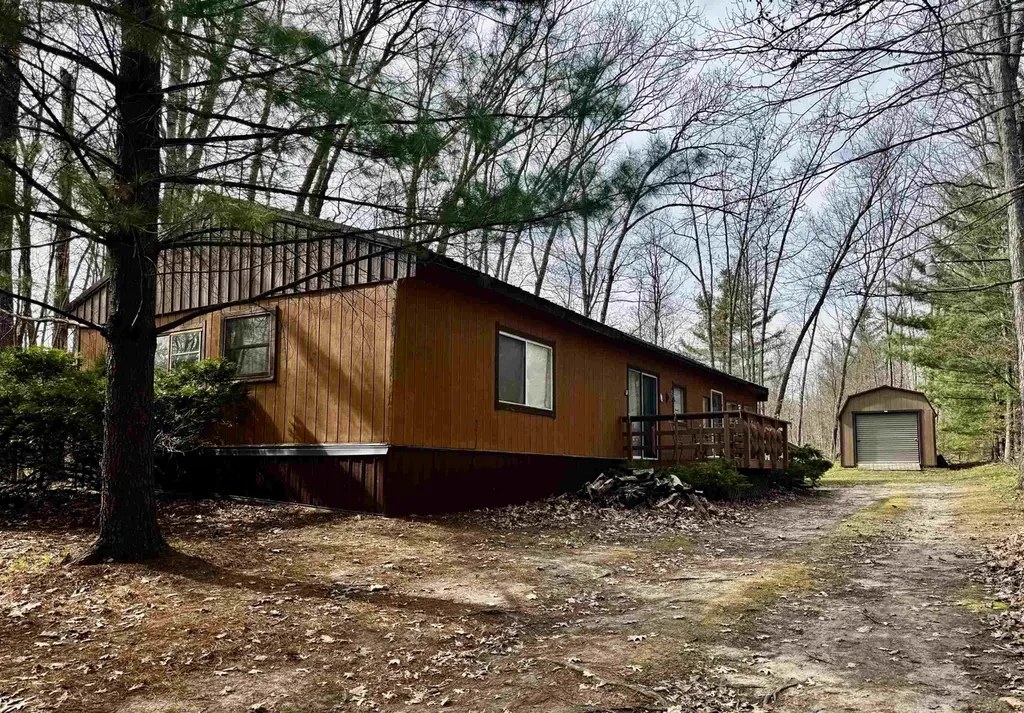
Set back off the road in a peaceful, private setting THAT NOW OFFERS 2 LOTS giving you, this 3-bedroom, 1-bath home offers a quiet Up North feel with added space to enjoy. The older single-wide trailer features a full-length addition, creating a more open and comfortable layout. A newer furnace with central air adds to the home’s efficiency and year-round comfort. Outside, you’ll find an extra-large 14x32 shed—perfect for storing all your outdoor gear and trail toys. Enjoy peek-a-boo views of Sutherland Lake, with the public boat launch just down the road for easy access to the water. A great spot to relax, unwind, and take in everything Northern Michigan has to offer.
Key facts
- Full-length addition
- Newer furnace
- Private setting
Tags
Property features AI
Finance
- Other: Property zoned recreational; Approximately 1.15 acres; Property Type: Residential; Site in Wild Life Park 1st Add subdivision
Exterior
- Parking: Road frontage (100')
- Utilities: Electricity connected; Private well water; Septic system; Propane heating (LP/Propane) with leased propane tank; Electric water heater
- Home design: Manufactured single-wide home (manufactured before 1976); One-story
- Construction: Wood construction; Crawl and slab foundation; Year built not specified
- Exterior features: Wood exterior; Shed; Lake view; Deep, large and treed lot with unpaved surfaces; Gravel road frontage
Interior
- Kitchen: Kitchen on the main level (approx. 11 x 15); Range/Oven; Refrigerator
- Bedrooms: Three bedrooms on the main level (approx. 10 x 11; 8 x 12; W=17)
- Flooring: Wood basement type noted
- Bathrooms: One full bathroom on the main level (approx. 7 x 8)
- Heating & cooling: Forced air heating; Central A/C
- Interior features: Bay window; Breezeway; Den/Study/Library; Entry; Family room; Living room; Unfinished room
- Laundry & utility: Main floor laundry; Washer; Dryer
Neighborhood map
What this means for you Summary
Snapshot
- This is a 3-bed/1.0-bath manufactured listed at $85k.
Deal economics
- At list price, monthly cash flow is $141 ($2k/yr) — positive.
- The deal already cash-flows at list — no discount required.
- Meets the 1% rule at list price ($883 rent vs $85k).
- Recommended offer: $82k (3.0% below list) — sets the bar for market timing.
Location & tenants
- Location reads: area grade C — affects rentability + tenant quality, not the cash-flow math above.
- Harrison Community Schools (town): math 17% / reading 28% proficiency, ranked #457 of 540 in MI (top 85%) — low school quality limits family demand, transient renter base, plan for 1-2y turnover; 65% free/reduced lunch — lower-income household profile, screen leases tightly.
- Zoned schools: Robert M Larson Elementary School (606 students, 85% FRL); Harrison Middle School (math 21% / reading 34%, grade F, #363 of 493 statewide, top 75%, 282 students, 81% FRL); Harrison Community High School (math 12% / reading 37%, grade F, #481 of 713 statewide, top 81%, 341 students, 73% FRL).
- Market conditions: 246 active listings in the ZIP; 77 units permitted in Clare County in 2024 (0 in 5+ unit buildings).
Forward outlook
- Local home prices are declining (-3.0%/yr); year-one equity from $588 of loan paydown is wiped out by about $3k of value loss. Plan a longer hold.
- Clare County population projected at -20% by 2050 — secular population decline; favor cash flow + early exit over multi-decade hold.
Negotiation context
- It's been on market 47 days — a 3% lower offer ($82k) is reasonable based on typical stale-listing flexibility.
- 2 sale attempts since 7y ago; this cycle's ask is 13% above the opening price — seller raised mid-cycle; expect resistance to lowballs.
- Current owner paid $40k; list at $85k implies a 113% gain — meaningful room to come down on a strong offer.
Questions for the listing agent
- It's been on market 47 days. Have you received any prior offers? Is the seller open to a 3% concession, seller financing, or rate buy-down credit?
- Is there a deadline driving the sale (1031 exchange, divorce, estate, relocation)? That informs how much negotiation room exists.
- What's the average days-on-market for RENTAL listings here right now (not sales)? A rising rental-DOM trend means longer vacancies and softer asking-rent achievability than the comps imply.
- What's the recent tenant-quality profile in this submarket — average credit score on applications, eviction rate, late-payment / NSF rate, and stable-employment percentage? A property-management company in the area should have these aggregated.
- How much new for-sale + rental construction is in the pipeline within 1–3 miles? Heavy new supply typically softens prices + rents 12–24 months out; constrained supply supports both.
Investment metrics
- 1% rule
- 1.04% ✓
- Cap rate
- 8.29%
- Cash-on-cash
- 7.13%
- DSCR
- 1.32
- GRM
- 8.0
CMA / ARV
- ARV (median comp)
- $179,434
- List price
- $85,000
- Delta
- -52.63%
- Verdict
- UNDERPRICED
- Comps
- 20 within 1.0 mi
Projected returns pro-forma
-3.0% appreciation · 3.0% rent growth · sell at horizon
- IRR
- -5.4%
- Equity multiple
- 0.80×
- Total profit
- $-4,771
- Equity at exit
- $12,674
- IRR
- 4.3%
- Equity multiple
- 1.31×
- Total profit
- $7,422
- Equity at exit
- $7,349
Cash invested: $23,800 (down + closing). Projections, not guarantees.
Landlord ↔ Tenant lean methodology
- Overall (STATE)
- 62 Landlord-Friendly
- State Michigan
- 62 Landlord-Friendly · EVEN
- County
- — inherits STATE
- City
- — inherits STATE
ZIP-level market 48625
- Home prices YoY
- -25.5%
- Active inventory
- 246
- Price-to-rent
- 8.0×
Monthly cashflow live
- Estimated rent
- $883 medium interval (Pro) →
- Mortgage (P&I)
- −$446
- Tax from tax record
- −$75 /mo · $903/yr
- Insurance
- −$35
- HOA
- −$0
- Vacancy / Maint / Mgmt
- −$185
- Net cashflow
- $141
Break-even live
Sensitivity live
| Price | -10% $190 | -5% $165 | +0% $141 | +5% $117 | +10% $93 |
|---|---|---|---|---|---|
| Rent | -10% $72 | -5% $107 | +0% $141 | +5% $176 | +10% $211 |
| Rate | -1.0pp $184 | -0.5pp $163 | base $141 | +0.5pp $119 | +1.0pp $97 |
UW: 25.0% down · 7.5% · 30yr · 1.5% tax · 5.0% vac · 8.0% maint · 8.0% mgmt
Financing live
Cash to close
- Down payment
- $21,250
- Closing costs
- $2,550
- Reserves months
- —
- Total cash needed
- —
Loan-product check · same deal, 3 products live
Conventional
25% down · 7.5% · 30yr
- Down + closing
- —
- Monthly P&I
- —
- Monthly cashflow
- —
- DSCR
- —
- Eligible?
- —
Personal DTI + credit; lowest rate.
DSCR
20% down · 8.5% · 30yr
- Down + closing
- —
- Monthly P&I
- —
- Monthly cashflow
- —
- DSCR
- —
- Eligible?
- —
No personal income docs; deal must DSCR.
Hard money
10% down · 12.0% · 12mo
- Down + closing
- —
- Monthly P&I
- —
- Monthly cashflow
- —
- DSCR
- —
- Eligible?
- —
Short-term bridge; refi at stabilization.
Listing history 20 events
-
2026-06-21days on market $85,000 Active 47 DOM
-
2026-06-21days on market $85,000 Active 46 DOM
-
2026-06-18days on market $85,000 Active 44 DOM
-
2026-06-17days on market $85,000 Active 43 DOM
-
2026-06-16days on market $85,000 Active 42 DOM
-
2026-06-15days on market $85,000 Active 41 DOM
-
2026-06-13days on market $85,000 Active 39 DOM
-
2026-06-12days on market $85,000 Active 38 DOM
-
2026-06-09days on market $85,000 Active 35 DOM
-
2026-06-08days on market $85,000 Active 34 DOM
-
2026-06-07days on market $85,000 Active 33 DOM
-
2026-06-07days on market $85,000 Active 32 DOM
-
2026-06-04days on market $85,000 Active 29 DOM
-
2026-06-02days on market $85,000 Active 28 DOM
-
2026-06-01days on market $85,000 Active 27 DOM
-
2026-05-31days on market $85,000 Active 26 DOM
-
2026-05-31days on market $85,000 Active 25 DOM
-
2026-05-05$75,000 Active 661-char remark
-
2020-03-30soldstatus $39,900
-
2019-07-20$44,900
ⓘ Source: listings_history table (triggers on properties + properties_extension) + one-shot
backfill from property_details.listing_events for pre-trigger history.
Tax reassessment forecast MI · Partial reset (capped growth)
- Current annual tax
- $903 · $75/mo
- Projected year-2 tax
- $1,106 · $92/mo
- Expected delta
- +$203/yr (+$17/mo · 22.5%)
ⓘ Screening estimate from a state-policy table — verify with the county assessor before closing.
Climate risk First Street
- Flood 1/10 Low FEMA zone X (unshaded) · 0% chance over 30 yrs
- Wildfire 3/10 Moderate
- Heat 1/10 Low 7 d/yr ≥94°F today · 14 d/yr by 30 yrs out
- Wind 1/10 Low
- Air quality 2/10 Low 1 unhealthy d/yr today · 1 by 30 yrs out
Nearby sold comps map
Loading sold comps map…
Walkable amenities ~0.75 mi
Loading nearby amenities…
Taxation est. · year 1
- Rental income
- $10,600
- − Mortgage interest
- −$4,761
- − Property taxes
- −$903
- − Insurance
- −$425
- − Repairs & maintenance
- −$848
- − Management
- −$848
- − Depreciation
- −$2,473
- Taxable income
- $342
- Est. tax owed @ 24.0%
- −$82
- After-tax cash flow
- $1,615/yr
For passive investors: Depreciation is non-cash, so a rental often shows a tax loss while cash-flowing — sheltering income. Rental losses are passive: they offset passive income freely, and up to $25,000/yr can offset ordinary (W-2) income if you actively participate and your MAGI is under $100k (phasing out to $0 by $150k); unused losses carry forward. On sale, claimed depreciation is recaptured at up to 25%, and gains may owe capital-gains tax (a 1031 exchange can defer both). Figures are a year-1 estimate at your 24.0% rate — not tax advice; consult a CPA.
Schools (NCES district)
- District
- Harrison Community Schools
- NCES district ID
- 2617820
- Math proficiency
- 17% ▬ 0.00%
- Reading proficiency
- 28% ▼ -5.00%
- Median HH income
- $30,377
- Composite
- 18.07/100
- National rank
- #8977
- State rank
- #457 of 540 in MI
Livability — Hayes
No livability data for this city. (Only ~50 U.S. cities are tracked.)
Census & demographics
- Population (ZIP)
- 12,939
Population outlook (Clare County) Hauer SSP2
- Today (2025)
- 29,283 people
- By 2030
- 28,199 · -3.7%
- By 2040
- 25,722 · -12.2%
- By 2050
- 23,372 · -20.2%
- By 2075
- 18,569 · -36.6%
- By 2100
- 14,320 · -51.1%
Race, ethnicity, and origin ACS 2023
- Neighborhood character
- Predominantly White (93%)
- Race & ethnicity
- White 93% Two or more races 4% Hispanic / Latino 3%
- Common ancestry
- Romanian 6% Lithuanian 4% Scotch-Irish 2%
- Foreign-born
- 0%
- Languages at home
- 99% English-only · Spanish 1% German/W. Germanic 1%
Political lean MEDSL · Clare
- 2024 margin
- Solid R (+37.6) · D 30.5% · R 68.1% · Other 1.4%
- 2008→2024 swing
- -42.4pp toward R · 2008: 4.8pp · 2024: -37.6pp
- All cycles
- 2024: R+37.6 2020: R+34.8 2016: R+31.8 2012: R+4.8 2008: D+4.8
Not yet ingested
- Civics
- —
Market trends
- HPI YoY
- ▼ -80.38%
- Current HPI
- 234.9586
- Rent YoY
- —
- Metro
- —
- State GDP YoY
- ▲ 1.37%
- F500 in state
- 28
Industry mix (Fortune 500 HQ in MI)
| Industry | F500 HQs | Revenue |
|---|---|---|
| Automotive Parts | 3 | $48B |
|
||
| Automotive | 2 | $372B |
|
||
| Chemicals | 1 | $45B |
|
||
| Automotive Retail | 1 | $29B |
|
||
| Healthcare / Medical Devices | 1 | $23B |
|
||
| Automotive Technology | 1 | $20B |
|
||
Price history
+89.3% since first listed4 events — show timeline
- 2026-05-20 Price Changed $85,000 MiRealSource-MiMLS
- 2026-05-05 Listed $75,000 MiRealSource-MiMLS
- 2020-03-30 Sold (Public Records) $39,900 Public Records
- 2019-07-20 Listed $44,900 MiRealSource-MiMLS
Property tax history
+5.3%/yrLatest (2025): $903 · +5.1% YoY. Source: county tax records.
Cash-flow waterfall
monthlySold comps — $/sqft
last 12 mo · ≤1 miLoading sold comps…