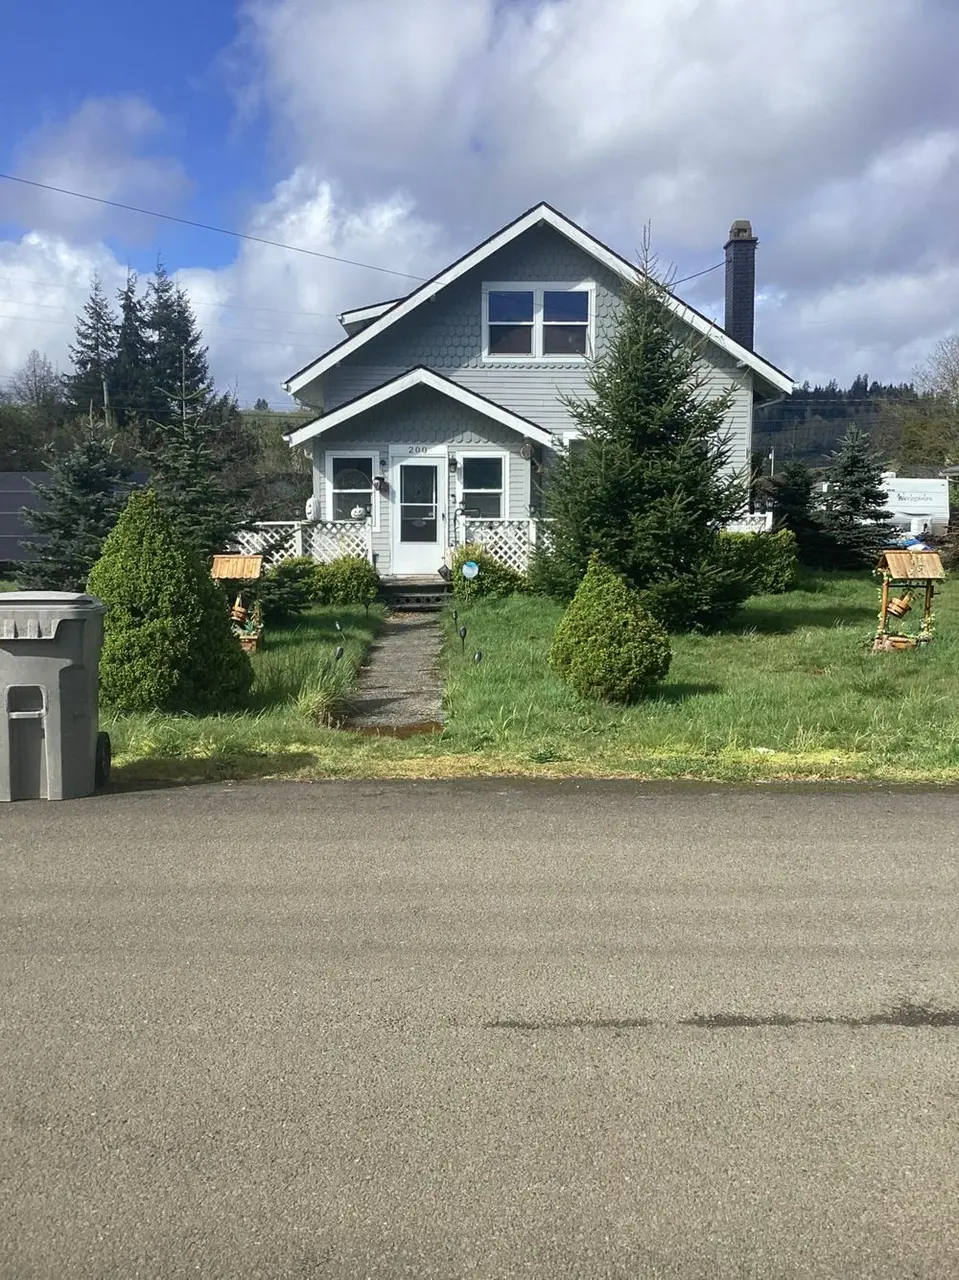
200 W Marion St · Aberdeen, WA
Flood risk 4/10 · Minor
- FEMA flood zone
- X
- Chance of flooding over 30 yrs
- 0.13%
- Est. flood insurance / yr
- $507 – $1,088
Fire risk 1/10 · Minimal
- Est. fire insurance / yr
- $604 – $1,122
Heat risk 1/10 · Minimal
- Hot days now (above 78°F)
- 8 days/yr
- Hot days in 30 yrs
- 17 days/yr
Wind risk 1/10 · Minimal
- Chance of severe wind over 30 yrs
- —
Air-quality risk 6/10 · Moderate
- Unhealthy air days now
- 7 days/yr
- Unhealthy air days in 30 yrs
- 7 days/yr
Risk factors via First Street. Map © Google.
Why this score? — see what drove the B- grade
The composite is a weighted blend of 9 inputs, each scored 0–100. Each bar is that input's sub-score; the figure is the points it added to the 100-point composite (weight × sub-score).
- Cash flow +24.3/30.0
- ARV discount +15.0/15.0
- DSCR +7.8/10.0
- 1% rule +6.1/10.0
- Livability +4.0/5.0
- Rent growth +3.6/5.0
- Schools +3.6/10.0
- Condition / age +2.5/5.0
- Appreciation +0.0/10.0
$199,999
🖨 Deal sheet (PDF) 📄 Offer letter ✓ Due diligence
Listing remarks
Great curb appeal, exterior improvements include new cement fiber board siding, roof, windows and doors. Interior improvements include new ductless heat pump, on demand hot water heater, new wiring and plumbing, insulation. Hard wood floors throughout. This home needs a handyman to hang Sheetrock. All permits have been pulled. Lots of storage and large bedrooms and living areas. Large array of solar panels, free electricity!
Key facts
- Insulation
- New plumbing
- New wiring
Tags
Property features AI
Exterior
- Home design: House
- Exterior features: Lot of approximately 14,985 sq ft
Neighborhood map
What this means for you Summary
Snapshot
- This is a 4-bed/2.0-bath single-family listed at $200k.
Deal economics
- At list price, monthly cash flow is $402 ($5k/yr) — positive.
- The deal already cash-flows at list — no discount required.
- Meets the 1% rule at list price ($2k rent vs $200k).
- Recommended offer: $197k (1.5% below list) — sets the bar for market timing.
- Cap rate 8.7% vs local median 4.1% in Aberdeen — top-decile yield for the area; either an underpriced asset or a hidden risk that comps aren't pricing in. Stress-test before assuming the spread holds.
Location & tenants
- Location reads 81/100 on livability (#73 in WA, #1,320 nationally) — a professional / high-income tenant draw. Strengths: amenities A+, commute A+, cost of living A+; Watch: crime D-, employment F.
- Aberdeen School District (town): math 35% / reading 45% proficiency, ranked #222 of 291 in WA (top 76%) — families likely to look elsewhere, expect single-tenant / working-renter base with shorter leases; 61% free/reduced lunch — lower-income household profile, screen leases tightly.
- Zoned schools: Stevens Elementary School (345 students, 89% FRL); Miller Junior High (718 students, 68% FRL); J M Weatherwax High School (916 students, 63% FRL).
- Market conditions: Rents rising fast (+4.3%/yr); 266 active listings in the ZIP; 3 comparable units currently listed for rent nearby; rentals lingering (median 46d on market — plan ~5-8 weeks vacancy on turnover, expect pricing pressure); 100% of comp listings sitting > 30 days — soft ceiling on asking rent; 297 units permitted in Grays Harbor County in 2024 (17 in 5+ unit buildings).
- At $2,220/mo this rent would consume 46% of the median local household income ($58k/yr) (locally 635% of renters already pay >50% of income on rent) — very limited rent-growth headroom before tenants either downsize or default.
Forward outlook
- Local home prices are declining (-3.0%/yr); year-one equity from $1k of loan paydown is wiped out by about $6k of value loss. Plan a longer hold.
- Grays Harbor County population projected at -24% by 2050 — secular population decline; favor cash flow + early exit over multi-decade hold.
- At projected returns (-3.0% appreciation + 4.3% rent growth), your $56k cash investment doubles in ~10 years — after that, you're playing with house money.
Negotiation context
- It's been on market 17 days — a 2% lower offer ($197k) is reasonable based on typical stale-listing flexibility.
- 2 sale attempts since 14y ago with the ask held roughly flat each time — persistent listings suggest the price (not the market) is what's stuck; bring a comps-based counter.
- Current owner paid $42k; list at $200k implies a 376% gain — meaningful room to come down on a strong offer.
Risks & watch-outs
- Watch-outs: built in 1914 — expect roof / HVAC / electrical / plumbing capex.
Questions for the listing agent
- Built in 1914 — when were the roof, HVAC, electrical panel, plumbing, and water heater last replaced?
- Is there a deadline driving the sale (1031 exchange, divorce, estate, relocation)? That informs how much negotiation room exists.
- Schools are D-rated, which usually means shorter tenancies and higher turnover. Who's the typical renter profile here, and what's been the actual vacancy rate?
- Crime grade is D in this area — have there been break-ins, vandalism, or insurance claims at this property in the last 3 years? What carrier currently insures it and at what premium?
- What's the average days-on-market for RENTAL listings here right now (not sales)? A rising rental-DOM trend means longer vacancies and softer asking-rent achievability than the comps imply.
- What's the recent tenant-quality profile in this submarket — average credit score on applications, eviction rate, late-payment / NSF rate, and stable-employment percentage? A property-management company in the area should have these aggregated.
- How much new for-sale + rental construction is in the pipeline within 1–3 miles? Heavy new supply typically softens prices + rents 12–24 months out; constrained supply supports both.
Investment metrics
- 1% rule
- 1.11% ✓
- Cap rate
- 8.71%
- Cash-on-cash
- 8.62%
- DSCR
- 1.38
- GRM
- 7.5
CMA / ARV
- ARV (on-the-fly)
- $293,188
- Comps found
- 9
Show comp detail 9 sales within ~0.75 mi
| Address | Dist | Beds/Ba | Sqft | Sold | Price | $/sf | Match |
|---|---|---|---|---|---|---|---|
| 412 E Perry St | 0.40mi | 4/2.0 | 1,983 (+0%) | 9mo | $326,000 | $164 | 74 |
| 209 E King St | 0.20mi | 4/2.0 | 2,070 (+4%) | 14mo | $300,000 | $145 | 72 |
| 121 E Harriman St | 0.52mi | 4/3.0 | 1,952 (-2%) | 3mo | $355,000 | $182 | 67 |
| 619 W Perry St | 0.35mi | 4/1.0 | 2,182 (+10%) | 4mo | $229,600 | $105 | 59 |
| 605 S Evans St | 0.34mi | 4/2.5 | 2,152 (+9%) | 23mo | $375,000 | $174 | 48 |
| 115 S Exchange St | 0.66mi | 3/2.0 (-1) | 2,025 (+2%) | 15mo | $232,500 | $115 | 48 |
| 1018 W Cushing St | 0.61mi | 3/2.0 (-1) | 2,106 (+6%) | 10mo | $308,000 | $146 | 47 |
| 421 E Marion St | 0.38mi | 3/2.0 (-1) | 1,704 (-14%) | 10mo | $395,000 | $232 | 45 |
| 903 Macfarlane St | 0.55mi | 3/2.5 (-1) | 2,199 (+11%) | 16mo | $325,000 | $148 | 36 |
Match score weights: distance 35% · size 25% · config 20% · recency 20%. Top-matched comps best support the ARV.
Projected returns pro-forma
-3.0% appreciation · 4.35% rent growth · sell at horizon
- IRR
- -1.7%
- Equity multiple
- 0.93×
- Total profit
- $-3,725
- Equity at exit
- $29,821
- IRR
- 9.3%
- Equity multiple
- 1.76×
- Total profit
- $42,686
- Equity at exit
- $17,292
Cash invested: $56,000 (down + closing). Projections, not guarantees.
Landlord ↔ Tenant lean methodology
- Overall (STATE)
- 28 Tenant-Leaning
- State Washington
- 28 Tenant-Leaning · D+8
- County
- — inherits STATE
- City
- — inherits STATE
ZIP-level market 98520
- Rents YoY
- 4.3%
- Active inventory
- 266
- Price-to-rent
- 7.5×
Monthly cashflow live
- Estimated rent
- $2,220 medium interval (Pro) →
- Mortgage (P&I)
- −$1,049
- Tax from tax record
- −$220 /mo · $2,634/yr
- Insurance
- −$83
- HOA
- −$0
- Vacancy / Maint / Mgmt
- −$466
- Net cashflow
- $402
Break-even live
Sensitivity live
| Price | -10% $515 | -5% $459 | +0% $402 | +5% $346 | +10% $289 |
|---|---|---|---|---|---|
| Rent | -10% $227 | -5% $314 | +0% $402 | +5% $490 | +10% $578 |
| Rate | -1.0pp $503 | -0.5pp $453 | base $402 | +0.5pp $350 | +1.0pp $298 |
UW: 25.0% down · 7.5% · 30yr · 1.5% tax · 5.0% vac · 8.0% maint · 8.0% mgmt
Financing live
Cash to close
- Down payment
- $50,000
- Closing costs
- $6,000
- Reserves months
- —
- Total cash needed
- —
Loan-product check · same deal, 3 products live
Conventional
25% down · 7.5% · 30yr
- Down + closing
- —
- Monthly P&I
- —
- Monthly cashflow
- —
- DSCR
- —
- Eligible?
- —
Personal DTI + credit; lowest rate.
DSCR
20% down · 8.5% · 30yr
- Down + closing
- —
- Monthly P&I
- —
- Monthly cashflow
- —
- DSCR
- —
- Eligible?
- —
No personal income docs; deal must DSCR.
Hard money
10% down · 12.0% · 12mo
- Down + closing
- —
- Monthly P&I
- —
- Monthly cashflow
- —
- DSCR
- —
- Eligible?
- —
Short-term bridge; refi at stabilization.
Rent comps 3 comps
| Address | Beds | Baths | Sqft | Rent | $/sqft | DOM | Units | Dist |
|---|---|---|---|---|---|---|---|---|
| 908 E 1st St Aberdeen, WA | 3.0 | 1.0 | 1608 | $2,100 | $1.31 | 45d | 1 | 1.14mi |
| 912 Bell Dr Cosmopolis, WA | 3.0 | 2.0 | 1877 | $2,600 | $1.39 | 45d | 1 | 1.23mi |
| 801 Olympic Sq Aberdeen, MD | 2.0–3.0 | 2.0 | 1344 | $2,267 | $1.69 | 45d | 3 | 1.46mi |
Listing history 12 events
-
2026-06-21days on market $199,999 Active 17 DOM
-
2026-06-19days on market $199,999 Active 15 DOM
-
2026-06-18days on market $199,999 Active 14 DOM
-
2026-06-17days on market $199,999 Active 13 DOM
-
2026-06-16days on market $199,999 Active 12 DOM
-
2026-06-15days on market $199,999 Active 11 DOM
-
2026-06-14days on market $199,999 Active 9 DOM
-
2026-06-12days on market $199,999 Active 8 DOM
-
2026-06-09days on market $199,999 Active 5 DOM
-
2026-06-08days on market $199,999 Active 4 DOM
-
2026-06-07remarks 428-char remark
-
2026-06-07$199,999 Active 3 DOM
ⓘ Source: listings_history table (triggers on properties + properties_extension) + one-shot
backfill from property_details.listing_events for pre-trigger history.
Tax reassessment forecast WA · Resets to sale price
- Current annual tax
- $2,634 · $220/mo
- Projected year-2 tax
- $2,634 · $220/mo
- Expected delta
- $0/yr ($0/mo · 0.0%)
ⓘ Screening estimate from a state-policy table — verify with the county assessor before closing.
Climate risk First Street
- Flood 4/10 Moderate FEMA zone X · 13% chance over 30 yrs
- Wildfire 1/10 Low
- Heat 1/10 Low 8 d/yr ≥78°F today · 17 d/yr by 30 yrs out
- Wind 1/10 Low
- Air quality 6/10 Major 7 unhealthy d/yr today · 7 by 30 yrs out
Nearby sold comps map
Loading sold comps map…
Walkable amenities ~0.75 mi
Loading nearby amenities…
Taxation est. · year 1
- Rental income
- $26,640
- − Mortgage interest
- −$11,203
- − Property taxes
- −$2,634
- − Insurance
- −$1,000
- − Repairs & maintenance
- −$2,131
- − Management
- −$2,131
- − Depreciation
- −$5,818
- Taxable income
- $1,722
- Est. tax owed @ 24.0%
- −$413
- After-tax cash flow
- $4,412/yr
For passive investors: Depreciation is non-cash, so a rental often shows a tax loss while cash-flowing — sheltering income. Rental losses are passive: they offset passive income freely, and up to $25,000/yr can offset ordinary (W-2) income if you actively participate and your MAGI is under $100k (phasing out to $0 by $150k); unused losses carry forward. On sale, claimed depreciation is recaptured at up to 25%, and gains may owe capital-gains tax (a 1031 exchange can defer both). Figures are a year-1 estimate at your 24.0% rate — not tax advice; consult a CPA.
Schools (NCES district)
- District
- Aberdeen School District
- NCES district ID
- 5300030
- Math proficiency
- 35% ▼ -1.00%
- Reading proficiency
- 45% ▬ 0.00%
- Median HH income
- $41,896
- Composite
- 36.13/100
- National rank
- #9477
- State rank
- #222 of 291 in WA
Livability — Aberdeen
- Score
- 81/100
- State rank
- #73
- US rank
- #1320
Category grades
Schools grade is shown separately in the Schools card above.
Census & demographics
- Census place
- Aberdeen, WA
- County
- Grays Harbor County · 44,693 people
- City population
- 24,888
- Metro
- Aberdeen, WA
- Population (ZIP)
- 24,888
- Household income
- $58,153
- Rent vs Own
- Severe rent burden
- 635.0
Population outlook (Grays Harbor County) Hauer SSP2
- Today (2025)
- 66,443 people
- By 2030
- 63,255 · -4.8%
- By 2040
- 56,466 · -15.0%
- By 2050
- 50,516 · -24.0%
- By 2075
- 39,296 · -40.9%
- By 2100
- 31,142 · -53.1%
Race, ethnicity, and origin ACS 2023
- Neighborhood character
- Predominantly White (70%)
- Race & ethnicity
- White 70% Hispanic / Latino 16% Two or more races 9% Black 4% Native American 3% Asian 1% Pacific Islander 1%
- Hispanic origin (detail)
- Mexican 11%
- Common ancestry
- Portuguese 4% Italian 3% Lithuanian 2%
- Foreign-born
- 7% · Canada
- Languages at home
- 87% English-only · Spanish 10% Other Asian/Pacific 1% German/W. Germanic 1%
Political lean MEDSL · Grays Harbor
- 2024 margin
- Lean R (+6.0) · D 45.6% · R 51.6% · Other 2.8%
- 2008→2024 swing
- -20.6pp toward R · 2008: 14.6pp · 2024: -6.0pp
- All cycles
- 2024: R+6.0 2020: R+6.6 2016: R+7.1 2012: D+14.0 2008: D+14.6
Not yet ingested
- Civics
- —
Market trends
- HPI YoY
- ▼ -138.75%
- Current HPI
- 207.7393
- Rent YoY
- ▲ 4.35%
- Metro
- Aberdeen, WA
- State GDP YoY
- ▲ 4.65%
- F500 in state
- 22
Industry mix (Fortune 500 HQ in WA)
| Industry | F500 HQs | Revenue |
|---|---|---|
| Retail | 2 | $269B |
|
||
| Technology / Retail | 1 | $638B |
|
||
| Technology | 1 | $245B |
|
||
| Telecommunications | 1 | $38B |
|
||
| Food / Beverage | 1 | $36B |
|
||
| Automotive / Trucks | 1 | $34B |
|
||
Price history
+370.6% since first listed7 events — show timeline
- 2026-06-04 Listed $199,999 ForSaleByOwner.com
- 2013-02-12 Delisted — NWMLS as Distributed by MLS Grid
- 2013-02-11 Sold (Public Records) $42,000 Public Records
- 2013-02-11 Sold (MLS) $42,000 NWMLS as Distributed by MLS Grid
- 2012-12-26 Pending — NWMLS as Distributed by MLS Grid
- 2012-12-22 Pending — NWMLS as Distributed by MLS Grid
- 2012-11-05 Listed $42,500 NWMLS as Distributed by MLS Grid
Property tax history
+5.2%/yrLatest (2026): $2,634 · -1.9% YoY. Source: county tax records.
Cash-flow waterfall
monthlySold comps — $/sqft
last 12 mo · ≤1 miLoading sold comps…