149 Old Freewill Dr NW · Cleveland, TN
Flood risk 1/10 · Minimal
- FEMA flood zone
- X (unshaded)
- Chance of flooding over 30 yrs
- 0.0%
- Est. flood insurance / yr
- $507 – $1,088
Fire risk 4/10 · Minor
- Est. fire insurance / yr
- $949 – $1,763
Heat risk 6/10 · Moderate
- Hot days now (above 104°F)
- 7 days/yr
- Hot days in 30 yrs
- 19 days/yr
Wind risk 3/10 · Minor
- Chance of severe wind over 30 yrs
- 8.0%
Air-quality risk 3/10 · Minor
- Unhealthy air days now
- 2 days/yr
- Unhealthy air days in 30 yrs
- 3 days/yr
Risk factors via First Street. Map © Google.
Why this score? — see what drove the B+ grade
The composite is a weighted blend of 9 inputs, each scored 0–100. Each bar is that input's sub-score; the figure is the points it added to the 100-point composite (weight × sub-score).
- Cash flow +30.0/30.0
- ARV discount +15.0/15.0
- DSCR +10.0/10.0
- 1% rule +7.9/10.0
- Livability +3.5/5.0
- Rent growth +3.2/5.0
- Schools +3.0/10.0
- Condition / age +2.5/5.0
- Appreciation +0.0/10.0
$142,999
🖨 Deal sheet 📄 Offer letter ✓ Due diligence
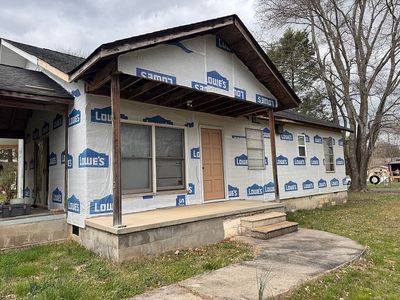
Listing remarks
For Sale by Owner & acirc; & euro; & ldquo; Fixer Upper with Huge Potential This 4 bedroom, 1.5 bath fixer upper sits on nearly an acre of flat, well kept land in Cleveland, TN. The home offers 1,441 sq ft of finished living space on the main level, not including the large unfinished upstairs loft, giving buyers even more room to expand and customize. It is an ideal opportunity for investors, DIY buyers, or anyone looking to create a personalized retreat in a peaceful setting while staying close to town conveniences. Inside, the home features a large living room with vaulted ceilings and sliding doors leading to a side porch with an attached carport. This space could easily be
Key facts
- Attached carport
- Large living room
- Side porch
Tags
Neighborhood map
What this means for you Summary
Snapshot
- This is a 4-bed/1.0-bath single-family listed at $143k.
Deal economics
- At list price, monthly cash flow is $614 ($7k/yr) — positive.
- The deal already cash-flows at list — no discount required.
- Meets the 1% rule at list price ($2k rent vs $143k).
- Cap rate 11.4% vs local median 3.5% in Cleveland — top-decile yield for the area; either an underpriced asset or a hidden risk that comps aren't pricing in. Stress-test before assuming the spread holds.
Location & tenants
- Location reads 70/100 on livability (#55 in TN) — a middle-class / working-renter tenant base. Strengths: cost of living A+, health & safety A+, housing A; Watch: schools D, employment D, crime F.
- Bradley County (other): math 35% / reading 34% proficiency, ranked #33 of 139 in TN (top 24%) — families likely to look elsewhere, expect single-tenant / working-renter base with shorter leases.
- Market conditions: Rents rising (+3.0%/yr); 196 active listings in the ZIP; 768 units permitted in Bradley County in 2024 (0 in 5+ unit buildings).
- At $1,848/mo this rent would consume 47% of the median local household income ($47k/yr) (locally 1184% of renters already pay >50% of income on rent) — very limited rent-growth headroom before tenants either downsize or default.
Forward outlook
- Local home prices are declining (-3.0%/yr); year-one equity from $988 of loan paydown is wiped out by about $4k of value loss. Plan a longer hold.
- Bradley County population projected at +21% by 2050 — long-run rental-demand tailwind backs the buy-and-hold thesis.
- At projected returns (-3.0% appreciation + 3.0% rent growth), your $40k cash investment doubles in ~7 years — after that, you're playing with house money.
Negotiation context
- Only 1 days on market — expect competitive offers; lowballing is unlikely to land.
- Current owner paid $31k; list at $143k implies a 361% gain — meaningful room to come down on a strong offer.
Risks & watch-outs
- Climate carrying-cost: extreme-heat days projected 7→19/yr by 2055 (HVAC capex compounding) — expect insurance premiums to compound above CPI over the hold.
Questions for the listing agent
- Is there a deadline driving the sale (1031 exchange, divorce, estate, relocation)? That informs how much negotiation room exists.
- Schools are D-rated, which usually means shorter tenancies and higher turnover. Who's the typical renter profile here, and what's been the actual vacancy rate?
- Crime grade is F in this area — have there been break-ins, vandalism, or insurance claims at this property in the last 3 years? What carrier currently insures it and at what premium?
- What's the average days-on-market for RENTAL listings here right now (not sales)? A rising rental-DOM trend means longer vacancies and softer asking-rent achievability than the comps imply.
- What's the recent tenant-quality profile in this submarket — average credit score on applications, eviction rate, late-payment / NSF rate, and stable-employment percentage? A property-management company in the area should have these aggregated.
- How much new for-sale + rental construction is in the pipeline within 1–3 miles? Heavy new supply typically softens prices + rents 12–24 months out; constrained supply supports both.
Investment metrics
- 1% rule
- 1.29% ✓
- Cap rate
- 11.45%
- Cash-on-cash
- 18.40%
- DSCR
- 1.82
- GRM
- 6.4
CMA / ARV
- ARV (on-the-fly)
- $262,262
- Comps found
- 12
Show comp detail 12 sales within ~0.75 mi
| Address | Dist | Beds/Ba | Sqft | Sold | Price | $/sf | Match |
|---|---|---|---|---|---|---|---|
| 2308 Raines Dr NW | 0.07mi | 3/2.0 (-1) | 1,300 (-10%) | 2mo | $187,000 | $144 | 70 |
| 3331 Walters Springs Rd NW | 0.33mi | 4/3.5 | 1,397 (-3%) | 1mo | $254,500 | $182 | 69 |
| 3335 Walters Springs Rd NW | 0.33mi | 4/3.5 | 1,397 (-3%) | 1mo | $254,500 | $182 | 68 |
| 3034 Three Creeks Dr NW | 0.38mi | 4/3.0 | 1,397 (-3%) | 3mo | $254,500 | $182 | 66 |
| 3038 Three Creeks Dr NW | 0.37mi | 4/3.0 | 1,397 (-3%) | 4mo | $256,000 | $183 | 66 |
| 3048 Three Creeks Dr NW | 0.31mi | 3/2.5 (-1) | 1,410 (-2%) | 6mo | $256,620 | $182 | 66 |
| 3042 Three Creeks Dr NW | 0.37mi | 3/2.5 (-1) | 1,410 (-2%) | 4mo | $256,620 | $182 | 65 |
| 3022 Three Creeks Dr NW | 0.39mi | 3/2.5 (-1) | 1,526 (+6%) | 4mo | $273,120 | $179 | 58 |
| 245 New Murraytown Rd NW | 0.57mi | 3/1.0 (-1) | 1,361 (-6%) | 12mo | $279,900 | $206 | 49 |
| 188 Crystal View Dr Dr NW | 0.69mi | 3/2.0 (-1) | 1,454 (+1%) | 13mo | $355,000 | $244 | 47 |
| 188 Harris Creek Trl SW | 0.59mi | 3/2.0 (-1) | 1,500 (+4%) | 14mo | $210,000 | $140 | 45 |
| 7 Harris Creek Trl SW | 0.64mi | 3/2.0 (-1) | 1,588 (+10%) | 21mo | $370,900 | $234 | 27 |
Match score weights: distance 35% · size 25% · config 20% · recency 20%. Top-matched comps best support the ARV.
Projected returns pro-forma
-3.0% appreciation · 2.95% rent growth · sell at horizon
- IRR
- 10.0%
- Equity multiple
- 1.39×
- Total profit
- $15,781
- Equity at exit
- $21,322
- IRR
- 19.0%
- Equity multiple
- 2.59×
- Total profit
- $63,473
- Equity at exit
- $12,364
Cash invested: $40,040 (down + closing). Projections, not guarantees.
Landlord ↔ Tenant lean methodology
- Overall (STATE)
- 87 Strongly Landlord-Friendly
- State Tennessee
- 87 Strongly Landlord-Friendly · R+13
- County
- — inherits STATE
- City
- — inherits STATE
ZIP-level market 37311
- Home prices YoY
- -25.4%
- Rents YoY
- 3.0%
- Active inventory
- 196
- Price-to-rent
- 6.4×
Monthly cashflow live
- Estimated rent
- $1,848 medium interval (Pro) →
- Mortgage (P&I)
- −$750
- Tax from tax record
- −$36 /mo · $437/yr
- Insurance
- −$60
- HOA
- −$0
- Vacancy / Maint / Mgmt
- −$388
- Net cashflow
- $614
Break-even live
UW: 25.0% down · 7.5% · 30yr · 1.5% tax · 5.0% vac · 8.0% maint · 8.0% mgmt
Financing live
Cash to close
- Down payment
- $35,750
- Closing costs
- $4,290
- Reserves months
- —
- Total cash needed
- —
Loan-product check · same deal, 3 products live
Conventional
25% down · 7.5% · 30yr
- Down + closing
- —
- Monthly P&I
- —
- Monthly cashflow
- —
- DSCR
- —
- Eligible?
- —
Personal DTI + credit; lowest rate.
DSCR
20% down · 8.5% · 30yr
- Down + closing
- —
- Monthly P&I
- —
- Monthly cashflow
- —
- DSCR
- —
- Eligible?
- —
No personal income docs; deal must DSCR.
Hard money
10% down · 12.0% · 12mo
- Down + closing
- —
- Monthly P&I
- —
- Monthly cashflow
- —
- DSCR
- —
- Eligible?
- —
Short-term bridge; refi at stabilization.
Listing history 1 events
-
1988-01-13soldstatus $31,000
ⓘ Source: listings_history table (triggers on properties + properties_extension) + one-shot
backfill from property_details.listing_events for pre-trigger history.
Tax reassessment forecast TN · Resets to sale price
- Current annual tax
- $437 · $36/mo
- Projected year-2 tax
- $1,015 · $85/mo
- Expected delta
- +$578/yr (+$48/mo · 132.3%)
ⓘ Screening estimate from a state-policy table — verify with the county assessor before closing.
Climate risk First Street
- Flood 1/10 Low FEMA zone X (unshaded) · 0% chance over 30 yrs
- Wildfire 4/10 Moderate
- Heat 6/10 Major 7 d/yr ≥104°F today · 19 d/yr by 30 yrs out
- Wind 3/10 Moderate 8% chance of damaging wind over 30 yrs
- Air quality 3/10 Moderate 2 unhealthy d/yr today · 3 by 30 yrs out
Nearby sold comps map
Loading sold comps map…
Walkable amenities ~0.75 mi
Loading nearby amenities…
Taxation est. · year 1
- Rental income
- $22,176
- − Mortgage interest
- −$8,010
- − Property taxes
- −$437
- − Insurance
- −$715
- − Repairs & maintenance
- −$1,774
- − Management
- −$1,774
- − Depreciation
- −$4,160
- Taxable income
- $5,305
- Est. tax owed @ 24.0%
- −$1,273
- After-tax cash flow
- $6,095/yr
For passive investors: Depreciation is non-cash, so a rental often shows a tax loss while cash-flowing — sheltering income. Rental losses are passive: they offset passive income freely, and up to $25,000/yr can offset ordinary (W-2) income if you actively participate and your MAGI is under $100k (phasing out to $0 by $150k); unused losses carry forward. On sale, claimed depreciation is recaptured at up to 25%, and gains may owe capital-gains tax (a 1031 exchange can defer both). Figures are a year-1 estimate at your 24.0% rate — not tax advice; consult a CPA.
Schools (NCES district)
- District
- Bradley County
- NCES district ID
- 4700330
- Math proficiency
- 35% ▼ -5.00%
- Reading proficiency
- 34% ▼ -2.00%
- Median HH income
- $45,807
- Composite
- 29.54/100
- National rank
- #6494
- State rank
- #33 of 139 in TN
Livability — Cleveland
- Score
- 70/100
- State rank
- #55
- US rank
- #7689
Category grades
Schools grade is shown separately in the Schools card above.
Census & demographics
- County
- Bradley County · 99,337 people
- City population
- 99,337
- Metro
- Cleveland, TN
- Population (ZIP)
- 30,720
- Household income
- $47,153
- Rent vs Own
- Severe rent burden
- 1184.0
Population outlook (Bradley County) Hauer SSP2
- Today (2025)
- 114,901 people
- By 2030
- 120,137 · +4.6%
- By 2040
- 130,125 · +13.2%
- By 2050
- 139,257 · +21.2%
- By 2075
- 161,664 · +40.7%
- By 2100
- 179,767 · +56.5%
Race, ethnicity, and origin ACS 2023
- Neighborhood character
- Predominantly White (74%)
- Race & ethnicity
- White 74% Hispanic / Latino 12% Black 9% Two or more races 6%
- Hispanic origin (detail)
- Mexican 7% Puerto Rican 2%
- Common ancestry
- Slovak 3% Serbian 2% Italian 1%
- Foreign-born
- 6% · Canada
- Languages at home
- 88% English-only · Spanish 9% Russian/Polish/Slavic 1%
Political lean MEDSL · Bradley
- 2024 margin
- Solid R (+58.9) · D 20.0% · R 78.9% · Other 1.1%
- 2008→2024 swing
- -9.2pp toward R · 2008: -49.7pp · 2024: -58.9pp
- All cycles
- 2024: R+58.9 2020: R+55.3 2016: R+59.1 2012: R+53.9 2008: R+49.7
Not yet ingested
- Civics
- —
Market trends
- HPI YoY
- ▼ -97.10%
- Current HPI
- 285.0723
- Rent YoY
- ▲ 2.95%
- Metro
- Cleveland, TN
- State GDP YoY
- ▲ 2.78%
- F500 in state
- 22
Industry mix (Fortune 500 HQ in TN)
| Industry | F500 HQs | Revenue |
|---|---|---|
| Healthcare | 3 | $91B |
|
||
| Retail | 3 | $72B |
|
||
| Transportation / Logistics | 1 | $88B |
|
||
| Paper / Packaging | 1 | $19B |
|
||
| Insurance | 1 | $13B |
|
||
| Energy | 1 | $12B |
|
||
Price history
1 event — show timeline
- 1988-01-13 Sold (Public Records) $31,000 Public Records
Property tax history
-1.3%/yrLatest (2025): $437 · +2.6% YoY. Source: county tax records.
Cash-flow waterfall
monthlySold comps — $/sqft
last 12 mo · ≤1 miLoading sold comps…