 Duplex
1151 Saint Lawrence Ave · New York, NY
Flood risk 6/10 · Moderate
- FEMA flood zone
- X (shaded)
- Chance of flooding over 30 yrs
- 0.27%
- Est. flood insurance / yr
- $507 – $1,088
Fire risk 1/10 · Minimal
- Est. fire insurance / yr
- $691 – $1,283
Heat risk 6/10 · Moderate
- Hot days now (above 99°F)
- 7 days/yr
- Hot days in 30 yrs
- 15 days/yr
Wind risk 6/10 · Moderate
- Chance of severe wind over 30 yrs
- 27.0%
Air-quality risk 4/10 · Minor
- Unhealthy air days now
- 5 days/yr
- Unhealthy air days in 30 yrs
- 6 days/yr
Risk factors via First Street. Map © Google.
Why this score? — see what drove the D- grade
The composite is a weighted blend of 9 inputs, each scored 0–100. Each bar is that input's sub-score; the figure is the points it added to the 100-point composite (weight × sub-score).
- Cash flow +10.5/30.0
- Appreciation +7.0/10.0
- Schools +5.0/10.0
- Livability +3.8/5.0
- DSCR +3.0/10.0
- Rent growth +2.5/5.0
- Condition / age +2.5/5.0
- 1% rule +2.3/10.0
- ARV discount +0.5/15.0
$999,999
🖨 Deal sheet (PDF) 📄 Offer letter ✓ Due diligence
Multi-family units
County records classify this as Multi-Family (2-4 Unit). Listing-text estimate: 2 units. confirmed
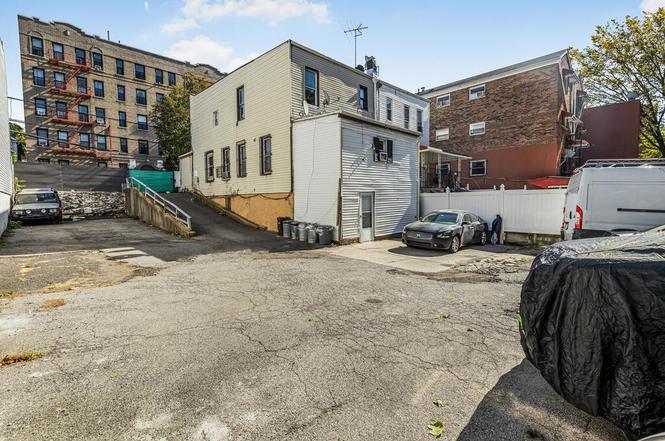
Listing remarks
>>Attention Buyers, Builders, and Developers! Don’t miss this prime opportunity in the highly sought-after Soundview location! This 5,000 sq ft lot (50 ft x 100 ft) in R5 zoning offers incredible potential. The property features an existing 2-family home with a full basement, delivered vacant—ideal for immediate use or redevelopment. Build a 3-family home or enjoy the expansive yard as a buyer. Key Updates: Roof replaced in 2019 New boiler installed in 2021 for efficient heating Prime Location: 6 Train at St. Lawrence Ave - 0.16 miles 6 Train at Morrison Ave–Soundview Ave - 0.39 miles 6 Train at Parkchester–East 177th St - 0.42 miles Perfect for investment, re
Key facts
- New boiler installed
- Expansive yard
- R5 zoning
Tags
Neighborhood map
What this means for you Summary
Snapshot
- This is a 2 × 3-bed/2.0-bath units multifamily listed at $1000k.
Deal economics
- At list price, monthly cash flow is $-512 ($-6k/yr) — negative. Per door: $-256/mo.
- To cash-flow at today's rent, offer at most $910k (9.0% below list).
- To meet the 1% rule (rent ≥ 1% of price), the offer needs to be $729k (27.1% below list).
- Recommended offer: $729k (27.1% below list) — sets the bar for 1% rule.
- Cap rate 5.7% vs local median 2.6% in New York — top-decile yield for the area; either an underpriced asset or a hidden risk that comps aren't pricing in. Stress-test before assuming the spread holds.
Location & tenants
- Location reads 75/100 on livability (#268 in NY, #4,188 nationally) — a middle-class / working-renter tenant base. Strengths: amenities A+, commute A+, health & safety A; Watch: crime F, cost of living F.
- Zoned schools: Ps 214 (math 30% / reading 50%, grade F, #1,418 of 2,108 statewide, top 68%, 836 students, 92% FRL); Jhs 383 Philippa Schuyler (math 32% / reading 67%, grade C, #280 of 729 statewide, top 40%, 822 students, 85% FRL); Midwood High School (math 94% / reading 96%, grade A+, #83 of 1,100 statewide, top 8%, 4,062 students, 73% FRL).
- Market conditions: 54 active listings in the ZIP; 6,929 units permitted in Bronx County in 2024 (6,829 in 5+ unit buildings).
Forward outlook
- In year one you build about $48k of equity ($7k loan paydown + $41k appreciation (4.1% local appreciation)).
- Bronx County population projected at +21% by 2050 — long-run rental-demand tailwind backs the buy-and-hold thesis.
- By year 2, paydown + projected appreciation supports a ~$77k cash-out refi (75% LTV) — recoverable capital for the next deal without selling this one.
Negotiation context
- It's been on market 27 days — a 2% lower offer ($985k) is reasonable based on typical stale-listing flexibility.
- Current owner paid $320k; list at $1000k implies a 212% gain — meaningful room to come down on a strong offer.
Risks & watch-outs
- Watch-outs: built in 1930 — expect roof / HVAC / electrical / plumbing capex.
- Climate carrying-cost: major flood risk; major wind risk, 27% chance of damaging wind over 30y; extreme-heat days projected 7→15/yr by 2055 (HVAC capex compounding) — expect insurance premiums to compound above CPI over the hold.
Questions for the listing agent
- What do current leases actually rent for vs. the listed asking? Can we see a recent rent roll and the last 12 months of T-12 income?
- Can we see the unit-by-unit rent roll, current vacancy, and any below-market leases? What's the average tenancy length?
- What capital expenditures (roof, boiler, parking lot, exteriors) have been made in the last 5 years, and what's planned in the next 2?
- Built in 1930 — when were the roof, HVAC, electrical panel, plumbing, and water heater last replaced?
- Is there a deadline driving the sale (1031 exchange, divorce, estate, relocation)? That informs how much negotiation room exists.
- Schools are B-rated — typically a magnet for longer-tenancy family renters. What's the average tenant stay here, and is there a school-zone premium baked into asking?
- Crime grade is F in this area — have there been break-ins, vandalism, or insurance claims at this property in the last 3 years? What carrier currently insures it and at what premium?
- The area grade is low — what's the realistic commute time and amenity access for the typical tenant pool here? Any planned neighborhood developments (good or bad) we should know about?
- What's the average days-on-market for RENTAL listings here right now (not sales)? A rising rental-DOM trend means longer vacancies and softer asking-rent achievability than the comps imply.
- What's the recent tenant-quality profile in this submarket — average credit score on applications, eviction rate, late-payment / NSF rate, and stable-employment percentage? A property-management company in the area should have these aggregated.
- How much new apartment / multifamily construction is in the pipeline within 1–3 miles? Heavy new supply (>2% of stock underway) typically softens rents 12–24 months out; light construction supports rent growth.
Investment metrics
- 1% rule
- 0.73% ✗
- Cap rate
- 5.68%
- Cash-on-cash
- -2.20%
- DSCR
- 0.90
- GRM
- 11.4
CMA / ARV
- ARV (on-the-fly)
- $865,920
- Comps found
- 7
Show comp detail 7 sales within ~0.75 mi
| Address | Dist | Beds/Ba | Sqft | Sold | Price | $/sf | Match |
|---|---|---|---|---|---|---|---|
| 1926 Mcgraw Ave | 0.52mi | 5/4.0 (-1) | 1,935 (+1%) | 2mo | $900,000 | $465 | 68 |
| 1274 Fteley Ave | 0.32mi | 5/3.0 (-1) | 1,840 (-4%) | 6mo | $955,000 | $519 | 64 |
| 1071 Stratford Ave | 0.47mi | 7/2.0 (+1) | 1,950 (+2%) | 2mo | $880,000 | $451 | 61 |
| 1347 Taylor Ave | 0.31mi | 7/2.0 (+1) | 2,012 (+5%) | 5mo | $775,000 | $385 | 60 |
| 1317 Thieriot Ave | 0.28mi | 5/3.0 (-1) | 1,773 (-8%) | 8mo | $880,000 | $496 | 58 |
| 1513 Rosedale Ave | 0.65mi | 5/3.0 (-1) | 1,946 (+1%) | 3mo | $799,000 | $411 | 56 |
| 725 Taylor Ave | 0.66mi | 5/3.0 (-1) | 1,933 (+1%) | 11mo | $750,000 | $388 | 50 |
Match score weights: distance 35% · size 25% · config 20% · recency 20%. Top-matched comps best support the ARV.
Projected returns pro-forma
4.08% appreciation · 3.0% rent growth · sell at horizon
- IRR
- 8.5%
- Equity multiple
- 1.52×
- Total profit
- $146,059
- Equity at exit
- $511,878
- IRR
- 10.6%
- Equity multiple
- 2.77×
- Total profit
- $496,458
- Equity at exit
- $841,123
Cash invested: $280,000 (down + closing). Projections, not guarantees.
Landlord ↔ Tenant lean methodology
- Overall (CITY)
- 0 Strongly Tenant-Friendly
- State New York
- 15 Strongly Tenant-Friendly · D+10
- County
- — inherits STATE
- City New York
- 0 Strongly Tenant-Friendly · D+34
ZIP-level market 10472
- Home prices YoY
- 1.8%
- Active inventory
- 54
- Price-to-rent
- 22.9×
Monthly cashflow live
- Estimated rent
- $7,286 medium interval (Pro) →
- Mortgage (P&I)
- −$5,244
- Tax from tax record
- −$607 /mo · $7,288/yr
- Insurance
- −$417
- HOA
- −$0
- Vacancy / Maint / Mgmt
- −$1,530
- Net cashflow
- $-512
Break-even live
Sensitivity live
| Price | -10% $54 | -5% $-229 | +0% $-512 | +5% $-795 | +10% $-1,078 |
|---|---|---|---|---|---|
| Rent | -10% $-1,088 | -5% $-800 | +0% $-512 | +5% $-224 | +10% $63 |
| Rate | -1.0pp $-9 | -0.5pp $-258 | base $-512 | +0.5pp $-771 | +1.0pp $-1,035 |
2-unit breakdown (identical units grouped — click to expand)
| Units | Beds | Baths | Est. rent |
|---|---|---|---|
| 2× units | 3 | 2 | $7,286 |
| #1 | 3 | 2 | $3,643 |
| #2 | 3 | 2 | $3,643 |
| Total (2 units) | $7,286 | ||
UW: 25.0% down · 7.5% · 30yr · 1.5% tax · 5.0% vac · 8.0% maint · 8.0% mgmt
Financing live
Cash to close
- Down payment
- $250,000
- Closing costs
- $30,000
- Reserves months
- —
- Total cash needed
- —
Loan-product check · same deal, 3 products live
Conventional
25% down · 7.5% · 30yr
- Down + closing
- —
- Monthly P&I
- —
- Monthly cashflow
- —
- DSCR
- —
- Eligible?
- —
Personal DTI + credit; lowest rate.
DSCR
20% down · 8.5% · 30yr
- Down + closing
- —
- Monthly P&I
- —
- Monthly cashflow
- —
- DSCR
- —
- Eligible?
- —
No personal income docs; deal must DSCR.
Hard money
10% down · 12.0% · 12mo
- Down + closing
- —
- Monthly P&I
- —
- Monthly cashflow
- —
- DSCR
- —
- Eligible?
- —
Short-term bridge; refi at stabilization.
Listing history 4 events
-
2025-01-13status Pending
-
2024-12-16$999,999 Active
-
2004-04-08soldstatus $320,000
-
1998-04-13soldstatus $15,000
ⓘ Source: listings_history table (triggers on properties + properties_extension) + one-shot
backfill from property_details.listing_events for pre-trigger history.
Tax reassessment forecast NY · Partial reset (capped growth)
- Current annual tax
- $7,288 · $607/mo
- Projected year-2 tax
- $12,094 · $1,008/mo
- Expected delta
- +$4,806/yr (+$400/mo · 65.9%)
ⓘ Screening estimate from a state-policy table — verify with the county assessor before closing.
Climate risk First Street
- Flood 6/10 Major FEMA zone X (shaded) · 27% chance over 30 yrs
- Wildfire 1/10 Low
- Heat 6/10 Major 7 d/yr ≥99°F today · 15 d/yr by 30 yrs out
- Wind 6/10 Major 27% chance of damaging wind over 30 yrs
- Air quality 4/10 Moderate 5 unhealthy d/yr today · 6 by 30 yrs out
Nearby sold comps map
Loading sold comps map…
Walkable amenities ~0.75 mi
Loading nearby amenities…
Taxation est. · year 1
- Rental income
- $87,432
- − Mortgage interest
- −$56,015
- − Property taxes
- −$7,288
- − Insurance
- −$5,000
- − Repairs & maintenance
- −$6,995
- − Management
- −$6,995
- − Depreciation
- −$29,091
- Taxable loss
- −$23,952
- Est. tax savings @ 24.0%
- +$5,748
- After-tax cash flow
- $-398/yr
For passive investors: Depreciation is non-cash, so a rental often shows a tax loss while cash-flowing — sheltering income. Rental losses are passive: they offset passive income freely, and up to $25,000/yr can offset ordinary (W-2) income if you actively participate and your MAGI is under $100k (phasing out to $0 by $150k); unused losses carry forward. On sale, claimed depreciation is recaptured at up to 25%, and gains may owe capital-gains tax (a 1031 exchange can defer both). Figures are a year-1 estimate at your 24.0% rate — not tax advice; consult a CPA.
Schools (NCES district)
No district data.
Livability — New York
- Score
- 75/100
- State rank
- #268
- US rank
- #4188
Category grades
Schools grade is shown separately in the Schools card above.
Census & demographics
- Census place
- New York, NY
- City population
- 7,731,280
- Population (ZIP)
- 63,820
Population outlook (Bronx County) Hauer SSP2
- Today (2025)
- 1,607,353 people
- By 2030
- 1,681,852 · +4.6%
- By 2040
- 1,824,421 · +13.5%
- By 2050
- 1,945,470 · +21.0%
- By 2075
- 2,187,887 · +36.1%
- By 2100
- 2,244,136 · +39.6%
Race, ethnicity, and origin ACS 2023
- Neighborhood character
- Diverse neighborhood (Simpson 0.56)
- Race & ethnicity
- Hispanic / Latino 62% Black 23% Two or more races 9% Asian 8% White 2% Native American 1%
- Hispanic origin (detail)
- Mexican 8% Puerto Rican 20% Cuban 1% Dominican 20%
- Foreign-born
- 40% · Canada, Jamaica
- Languages at home
- 36% English-only · Spanish 52% Other Indo-European 7% French/Haitian/Cajun 2%
Political lean MEDSL · Bronx
- 2024 margin
- Solid D (+45.4) · D 72.7% · R 27.3%
- 2008→2024 swing
- -32.3pp toward R · 2008: 77.8pp · 2024: 45.4pp
- All cycles
- 2024: D+45.4 2020: D+67.6 2016: D+79.1 2012: D+82.9 2008: D+77.8
Not yet ingested
- Civics
- —
Market trends
- HPI YoY
- ▲ 4.08%
- Current HPI
- 236.8002
- Rent YoY
- —
- Metro
- —
- State GDP YoY
- ▲ 2.60%
- F500 in state
- 92
Industry mix (Fortune 500 HQ in NY)
| Industry | F500 HQs | Revenue |
|---|---|---|
| Financial Services | 10 | $950B |
|
||
| Consumer Goods | 9 | $162B |
|
||
| Insurance | 4 | $225B |
|
||
| Telecommunications | 2 | $144B |
|
||
| Pharmaceuticals | 2 | $112B |
|
||
| Media / Entertainment | 2 | $69B |
|
||
Price history
+6566.7% since first listed4 events — show timeline
- 2025-01-13 Pending — OneKey® MLS as Distributed by MLS Grid
- 2024-12-16 Listed $999,999 OneKey® MLS as Distributed by MLS Grid
- 2004-04-08 Sold (Public Records) $320,000 Public Records
- 1998-04-13 Sold (Public Records) $15,000 Public Records
Property tax history
+5.6%/yrLatest (2025): $7,288 · +4.2% YoY. Source: county tax records.
Cash-flow waterfall
monthlySold comps — $/sqft
last 12 mo · ≤1 miLoading sold comps…