801 Quail Cv · Lafayette, CO
Flood risk 6/10 · Moderate
- FEMA flood zone
- X (unshaded)
- Chance of flooding over 30 yrs
- 0.7%
- Est. flood insurance / yr
- $507 – $1,088
Fire risk 5/10 · Moderate
- Est. fire insurance / yr
- $939 – $1,743
Heat risk 3/10 · Minor
- Hot days now (above 93°F)
- 7 days/yr
- Hot days in 30 yrs
- 18 days/yr
Wind risk 1/10 · Minimal
- Chance of severe wind over 30 yrs
- —
Air-quality risk 3/10 · Minor
- Unhealthy air days now
- 3 days/yr
- Unhealthy air days in 30 yrs
- 4 days/yr
Risk factors via First Street. Map © Google.
Why this score? — see what drove the B+ grade
The composite is a weighted blend of 9 inputs, each scored 0–100. Each bar is that input's sub-score; the figure is the points it added to the 100-point composite (weight × sub-score).
- Cash flow +30.0/30.0
- ARV discount +15.0/15.0
- 1% rule +10.0/10.0
- DSCR +10.0/10.0
- Schools +5.1/10.0
- Livability +4.2/5.0
- Rent growth +2.9/5.0
- Condition / age +2.5/5.0
- Appreciation +0.0/10.0
$96,000
🖨 Deal sheet (PDF) 📄 Offer letter ✓ Due diligence
Listing remarks MLS
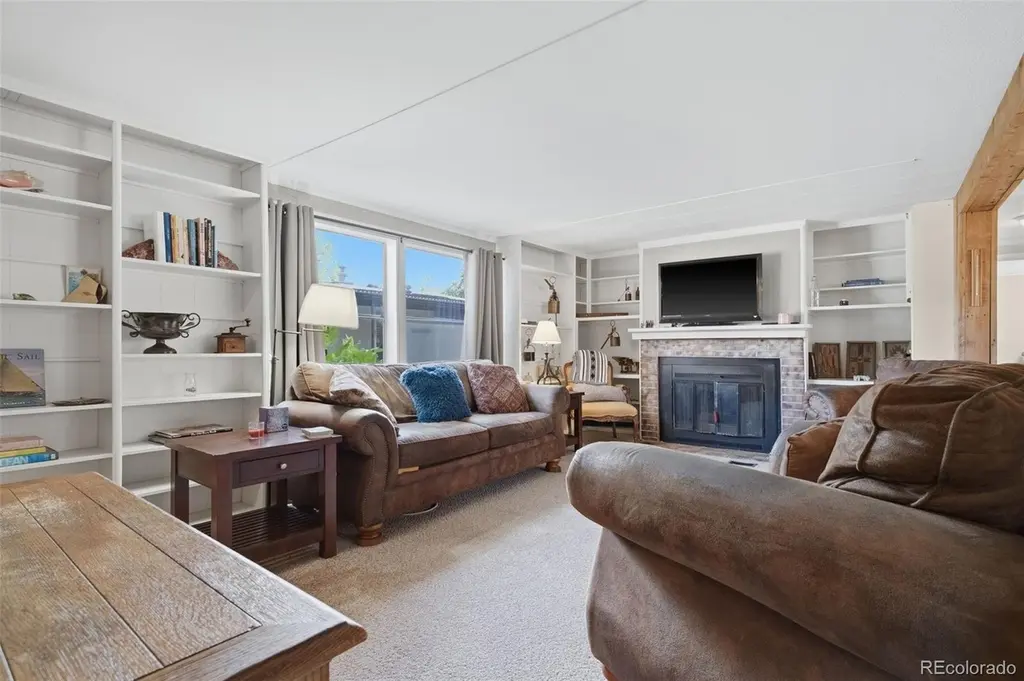
55 & OLDER COMMUNITY! Welcome home to this wonderful senior park. Great deal on this wonderful mobile home. Built in china hutch, bookcases, computer area, extra storage, 2 deck/patio, storage shed, fireplace, new dishwasher, new fridge, extra insulation in attic, 2 furnaces and much much more. Buyer must be accepted and qualify by Arbordale Acres prior to closing.
Key facts
- 3 parking spots
- Built 1979
- Listed 5 days
Property features AI
Finance
- Other: Parcel number M8900350; Annual taxes listed for 2025
- HOA & community: Monthly land lease of $1,300 (land lease expires December 31, 2026)
Exterior
- Parking: 3 total parking spaces (off-street)
- Utilities: Community sewer
- Home design: Manufactured home located in a park; Manufactured home subtype; Individual ownership
- Construction: Craftmark manufactured home, 64' x 28'; Roof: Other
- Exterior features: Park name: ARBORDALE ACRES; Land lease in effect (monthly land lease)
Interior
- Bedrooms: 3 bedrooms, all on the main level
- Bathrooms: 2 full bathrooms, both on the main level
- Heating & cooling: Forced air heating; Cooling: other
- Interior features: Living area approximately 1,792; Above-grade finished living area
Neighborhood map
What this means for you Summary
Snapshot
- This is a 3-bed/2.0-bath manufactured listed at $96k.
Deal economics
- At list price, monthly cash flow is $2k ($19k/yr) — positive.
- The deal already cash-flows at list — no discount required.
- Meets the 1% rule at list price ($3k rent vs $96k).
- Cap rate 26.5% vs local median 2.6% in Lafayette — top-decile yield for the area; either an underpriced asset or a hidden risk that comps aren't pricing in. Stress-test before assuming the spread holds.
Location & tenants
- Location reads 85/100 on livability (#1 in CO, #566 nationally) — a professional / high-income tenant draw. Strengths: amenities A+, commute A+, employment A+; Watch: crime C-, cost of living F.
- Boulder Valley School District No. Re2 (urban): math 49% / reading 67% proficiency, ranked #6 of 86 in CO (top 7%) — acceptable for families but not a draw, mixed tenant base, ~2y average lease; only 16% free/reduced lunch — higher-income household profile.
- Zoned schools: Aspen Creek K-8 School (math 44% / reading 60%, grade C-, #174 of 966 statewide, top 20%, 748 students, 21% FRL); Angevine Middle School (math 29% / reading 47%, grade F, #90 of 270 statewide, top 34%, 661 students, 44% FRL); Centaurus High School (math 54% / reading 74%, grade B-, #38 of 381 statewide, top 10%, 1,525 students, 32% FRL) — zoned schools average 32% FRL vs 16% district-wide (16 pts higher); higher-poverty schools than district average — tighter screening recommended.
- Market conditions: Rents rising (+1.6%/yr); 200 active listings in the ZIP; 10 comparable units currently listed for rent nearby; rentals at typical pace (median 22d on market — plan ~3-4 weeks tenant-placement turnaround); high-income renter base; 1,688 units permitted in Boulder County in 2024 (1,136 in 5+ unit buildings).
Forward outlook
- Local home prices are declining (-3.0%/yr); year-one equity from $664 of loan paydown is wiped out by about $3k of value loss. Plan a longer hold.
- Boulder County population projected at +40% by 2050 — long-run rental-demand tailwind backs the buy-and-hold thesis.
- At projected returns (-3.0% appreciation + 1.6% rent growth), your $27k cash investment doubles in ~2 years — after that, you're playing with house money.
Negotiation context
- Only 5 days on market — expect competitive offers; lowballing is unlikely to land.
- 9 sale attempts since 28y ago with the ask held roughly flat each time — persistent listings suggest the price (not the market) is what's stuck; bring a comps-based counter.
- Current owner paid $20k; list at $96k implies a 380% gain — meaningful room to come down on a strong offer.
Risks & watch-outs
- Climate carrying-cost: major flood risk; moderate wildfire risk — expect insurance premiums to compound above CPI over the hold.
Questions for the listing agent
- Built in 1979 — when were the roof, HVAC, electrical panel, plumbing, and water heater last replaced?
- Is there a deadline driving the sale (1031 exchange, divorce, estate, relocation)? That informs how much negotiation room exists.
- Schools are B-rated — typically a magnet for longer-tenancy family renters. What's the average tenant stay here, and is there a school-zone premium baked into asking?
- What's the average days-on-market for RENTAL listings here right now (not sales)? A rising rental-DOM trend means longer vacancies and softer asking-rent achievability than the comps imply.
- What's the recent tenant-quality profile in this submarket — average credit score on applications, eviction rate, late-payment / NSF rate, and stable-employment percentage? A property-management company in the area should have these aggregated.
- How much new for-sale + rental construction is in the pipeline within 1–3 miles? Heavy new supply typically softens prices + rents 12–24 months out; constrained supply supports both.
Investment metrics
- 1% rule
- 2.87% ✓
- Cap rate
- 26.46%
- Cash-on-cash
- 72.01%
- DSCR
- 4.20
- GRM
- 2.9
CMA / ARV
- ARV (on-the-fly)
- $141,568
- Comps found
- 4
Show comp detail 4 sales within ~0.75 mi
| Address | Dist | Beds/Ba | Sqft | Sold | Price | $/sf | Match |
|---|---|---|---|---|---|---|---|
| 706 Meadowlark Dr | 0.15mi | 4/2.0 (+1) | 1,792 (0%) | 3mo | $137,000 | $76 | 86 |
| 809 Flamingo Cv | 0.12mi | 3/2.0 | 1,716 (-4%) | 13mo | $135,000 | $79 | 77 |
| 729 Merlin Dr | 0.04mi | 2/2.0 (-1) | 1,560 (-13%) | 14mo | $105,000 | $67 | 60 |
| 707 Cardinal Dr | 0.25mi | 4/2.0 (+1) | 2,016 (+12%) | 11mo | $190,000 | $94 | 54 |
Match score weights: distance 35% · size 25% · config 20% · recency 20%. Top-matched comps best support the ARV.
Projected returns pro-forma
-3.0% appreciation · 1.56% rent growth · sell at horizon
- IRR
- 70.1%
- Equity multiple
- 4.10×
- Total profit
- $83,222
- Equity at exit
- $14,314
- IRR
- 73.7%
- Equity multiple
- 8.03×
- Total profit
- $188,976
- Equity at exit
- $8,300
Cash invested: $26,880 (down + closing). Projections, not guarantees.
Landlord ↔ Tenant lean methodology
- Overall (STATE)
- 38 Tenant-Leaning
- State Colorado
- 38 Tenant-Leaning · D+4
- County
- — inherits STATE
- City
- — inherits STATE
ZIP-level market 80026
- Rents YoY
- 1.6%
- Active inventory
- 200
- Price-to-rent
- 2.9×
Monthly cashflow live
- Estimated rent
- $2,759 high interval (Pro) →
- Mortgage (P&I)
- −$503
- Tax from tax record
- −$23 /mo · $278/yr
- Insurance
- −$40
- HOA
- −$0
- Vacancy / Maint / Mgmt
- −$579
- Net cashflow
- $1,613
Break-even live
Sensitivity live
| Price | -10% $1,667 | -5% $1,640 | +0% $1,613 | +5% $1,586 | +10% $1,559 |
|---|---|---|---|---|---|
| Rent | -10% $1,395 | -5% $1,504 | +0% $1,613 | +5% $1,722 | +10% $1,831 |
| Rate | -1.0pp $1,661 | -0.5pp $1,637 | base $1,613 | +0.5pp $1,588 | +1.0pp $1,563 |
UW: 25.0% down · 7.5% · 30yr · 1.5% tax · 5.0% vac · 8.0% maint · 8.0% mgmt
Financing live
Cash to close
- Down payment
- $24,000
- Closing costs
- $2,880
- Reserves months
- —
- Total cash needed
- —
Loan-product check · same deal, 3 products live
Conventional
25% down · 7.5% · 30yr
- Down + closing
- —
- Monthly P&I
- —
- Monthly cashflow
- —
- DSCR
- —
- Eligible?
- —
Personal DTI + credit; lowest rate.
DSCR
20% down · 8.5% · 30yr
- Down + closing
- —
- Monthly P&I
- —
- Monthly cashflow
- —
- DSCR
- —
- Eligible?
- —
No personal income docs; deal must DSCR.
Hard money
10% down · 12.0% · 12mo
- Down + closing
- —
- Monthly P&I
- —
- Monthly cashflow
- —
- DSCR
- —
- Eligible?
- —
Short-term bridge; refi at stabilization.
Rent comps 10 comps
| Address | Beds | Baths | Sqft | Rent | $/sqft | DOM | Units | Dist |
|---|---|---|---|---|---|---|---|---|
| 204 E Emma St Lafayette, CO | 3.0 | 2.0 | 1400 | $2,625 | $1.88 | 14d | 1 | 0.40mi |
| 235 S Boulder Rd Lafayette, CO | 3.0 | 1.0–3.5 | 1320 | $3,428 | $2.60 | 14d | 1 | 0.45mi |
| 211 W Simpson St Lafayette, CO | 3.0 | 2.0 | 1635 | $2,650 | $1.62 | 14d | 1 | 0.78mi |
| 225 Cornelius St Lafayette, CO | 3.0 | 3.5 | 1520 | $2,795 | $1.84 | 14d | 1 | 0.83mi |
| 332 S Carr Ave W Lafayette, CO | 4.0 | 1.5 | 1536 | $2,895 | $1.88 | 21d | 1 | 0.97mi |
| 772 W Cleveland Cir Lafayette, CO | 2.0 | 2.0 | 1290 | $2,100 | $1.63 | 21d | 1 | 1.01mi |
| 557 Wild Ridge Ln Lafayette, CO | 2.0 | 2.5 | 2382 | $2,755 | $1.16 | 21d | 1 | 1.04mi |
| 1244 James Cir Lafayette, CO | 3.0 | 3.0 | 1910 | $2,500 | $1.31 | 21d | 1 | 1.35mi |
| 1110 # E Unit Centaur Cir unit Lafayette, CO | 3.0 | 2.0 | 1375 | $2,400 | $1.75 | 21d | 1 | 1.40mi |
| 1221 Warrior Way Unit 1 Lafayette, CO | 3.0 | 2.5 | 1260 | $2,795 | $2.22 | 21d | 1 | 1.47mi |
Listing history 6 events
-
2026-06-18days on market $96,000 Active 5 DOM
-
2026-06-17days on market $96,000 Active 4 DOM
-
2026-06-16days on market $96,000 Active 3 DOM
-
2026-06-15days on market $96,000 Active 2 DOM
-
2026-06-14remarks 526-char remark
-
2026-06-14$96,000 Active 1 DOM
ⓘ Source: listings_history table (triggers on properties + properties_extension) + one-shot
backfill from property_details.listing_events for pre-trigger history.
Tax reassessment forecast CO · Resets to sale price
- Current annual tax
- $278 · $23/mo
- Projected year-2 tax
- $528 · $44/mo
- Expected delta
- +$250/yr (+$21/mo · 90.2%)
ⓘ Screening estimate from a state-policy table — verify with the county assessor before closing.
Climate risk First Street
- Flood 6/10 Major FEMA zone X (unshaded) · 70% chance over 30 yrs
- Wildfire 5/10 Major
- Heat 3/10 Moderate 7 d/yr ≥93°F today · 18 d/yr by 30 yrs out
- Wind 1/10 Low
- Air quality 3/10 Moderate 3 unhealthy d/yr today · 4 by 30 yrs out
Nearby sold comps map
Loading sold comps map…
Walkable amenities ~0.75 mi
Loading nearby amenities…
Taxation est. · year 1
- Rental income
- $33,108
- − Mortgage interest
- −$5,377
- − Property taxes
- −$278
- − Insurance
- −$480
- − Repairs & maintenance
- −$2,649
- − Management
- −$2,649
- − Depreciation
- −$2,793
- Taxable income
- $18,883
- Est. tax owed @ 24.0%
- −$4,532
- After-tax cash flow
- $14,825/yr
For passive investors: Depreciation is non-cash, so a rental often shows a tax loss while cash-flowing — sheltering income. Rental losses are passive: they offset passive income freely, and up to $25,000/yr can offset ordinary (W-2) income if you actively participate and your MAGI is under $100k (phasing out to $0 by $150k); unused losses carry forward. On sale, claimed depreciation is recaptured at up to 25%, and gains may owe capital-gains tax (a 1031 exchange can defer both). Figures are a year-1 estimate at your 24.0% rate — not tax advice; consult a CPA.
Schools (NCES district)
- District
- Boulder Valley School District No. Re2
- NCES district ID
- 0802490
- Math proficiency
- 49% ▼ -3.00%
- Reading proficiency
- 67% ▲ 4.00%
- Median HH income
- $70,395
- Composite
- 51.3/100
- National rank
- #1747
- State rank
- #6 of 86 in CO
Livability — Lafayette
- Score
- 85/100
- State rank
- #1
- US rank
- #566
Category grades
Schools grade is shown separately in the Schools card above.
Census & demographics
- Census place
- Lafayette, CO
- County
- Boulder County · 271,666 people
- City population
- 32,701
- Metro
- Boulder, CO
- Population (ZIP)
- 32,701
- Household income
- $120,187
- Rent vs Own
- Severe rent burden
- 1019.0
Population outlook (Boulder County) Hauer SSP2
- Today (2025)
- 380,833 people
- By 2030
- 412,028 · +8.2%
- By 2040
- 472,764 · +24.1%
- By 2050
- 532,029 · +39.7%
- By 2075
- 679,723 · +78.5%
- By 2100
- 766,278 · +101.2%
Race, ethnicity, and origin ACS 2023
- Neighborhood character
- Predominantly White (74%)
- Race & ethnicity
- White 74% Hispanic / Latino 15% Two or more races 11% Asian 4%
- Hispanic origin (detail)
- Mexican 8% Puerto Rican 1%
- Common ancestry
- Slovak 3% Romanian 3% Lithuanian 3%
- Foreign-born
- 10% · Canada, China, South Korea
- Languages at home
- 86% English-only · Spanish 9% Russian/Polish/Slavic 1% Other Indo-European 1%
Political lean MEDSL · Boulder
- 2024 margin
- Solid D (+55.8) · D 76.5% · R 20.8% · Other 2.7%
- 2008→2024 swing
- +9.6pp toward D · 2008: 46.1pp · 2024: 55.8pp
- All cycles
- 2024: D+55.8 2020: D+56.6 2016: D+48.6 2012: D+41.5 2008: D+46.1
Not yet ingested
- Civics
- —
Market trends
- HPI YoY
- ▼ -489.04%
- Current HPI
- 280.2819
- Rent YoY
- ▲ 1.56%
- Metro
- Boulder, CO
- State GDP YoY
- ▲ 1.95%
- F500 in state
- 14
Industry mix (Fortune 500 HQ in CO)
| Industry | F500 HQs | Revenue |
|---|---|---|
| Technology Distribution | 1 | $31B |
|
||
| Food / Agriculture | 1 | $18B |
|
||
| Packaging | 1 | $14B |
|
||
| Healthcare | 1 | $13B |
|
||
| Energy | 1 | $10B |
|
||
| Technology | 1 | $4B |
|
||
Price history
+45.5% since first listed17 events — show timeline
- 2026-06-13 Listed $96,000 REColorado as Distributed by MLS Grid
- 2007-10-03 Sold (MLS) $20,000 IRES
- 2007-08-28 Listed $25,000 IRES
- 2007-08-10 Listing Removed — IRES
- 2007-07-10 Listed $25,000 IRES
- 2002-10-16 Sold (MLS) $56,000 IRES
- 2001-09-20 Listed $59,900 IRES
- 2001-04-30 Listing Removed — IRES
- 2001-04-30 Listing Removed — IRES
- 2001-01-06 Listed $59,999 IRES
- 2000-11-01 Listed $65,000 IRES
- 2000-10-29 Listing Removed — IRES
- 1999-10-05 Listing Removed — IRES
- 1999-10-04 Listed $66,000 IRES
- 1999-06-28 Listed $66,000 IRES
- 1999-06-25 Listing Removed — IRES
- 1998-11-16 Listed $66,000 IRES
Property tax history
+7.0%/yrLatest (2025): $278 · +213.3% YoY. Source: county tax records.
Cash-flow waterfall
monthlySold comps — $/sqft
last 12 mo · ≤1 miLoading sold comps…