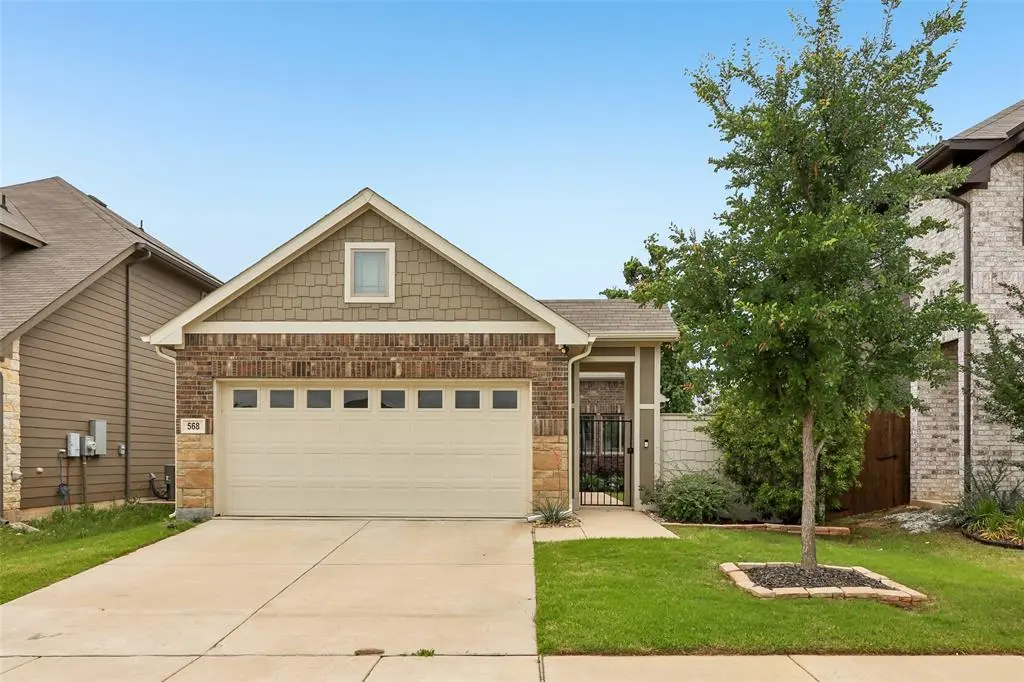
568 Val Verde St · Aubrey, TX
Flood risk 1/10 · Minimal
- FEMA flood zone
- X (unshaded)
- Chance of flooding over 30 yrs
- 0.0%
- Est. flood insurance / yr
- $507 – $1,088
Fire risk 6/10 · Moderate
- Est. fire insurance / yr
- $1,222 – $2,270
Heat risk 7/10 · Major
- Hot days now (above 109°F)
- 7 days/yr
- Hot days in 30 yrs
- 22 days/yr
Wind risk 5/10 · Moderate
- Chance of severe wind over 30 yrs
- 26.0%
Air-quality risk 3/10 · Minor
- Unhealthy air days now
- 3 days/yr
- Unhealthy air days in 30 yrs
- 4 days/yr
Risk factors via First Street. Map © Google.
Why this score? — see what drove the D- grade
The composite is a weighted blend of 9 inputs, each scored 0–100. Each bar is that input's sub-score; the figure is the points it added to the 100-point composite (weight × sub-score).
- ARV discount +14.6/15.0
- Cash flow +6.9/30.0
- Schools +4.6/10.0
- Livability +3.6/5.0
- 1% rule +2.6/10.0
- Condition / age +2.5/5.0
- Rent growth +2.0/5.0
- DSCR +1.1/10.0
- Appreciation +0.0/10.0
$285,000
🖨 Deal sheet 📄 Offer letter ✓ Due diligence
Listing remarks
Check out 568 Val Verde St, a functional residence providing everyday comfort. The kitchen includes a functional island, an accent backsplash, and stainless steel appliances. The primary bedroom features a walk-in closet, and the primary bathroom contains double sinks. Exterior grounds include a fenced backyard. This home presents an ideal combination of refined comfort and practical design. Home comes with a 100-Day Home Warranty and a 7-Day Home Test Drive to move in 7 days early for free
Key facts
- 4,792 sq ft lot
- 2 garage spots
- Community pool
Property features AI
Finance
- Other: Possession at closing/funding
- Financial info: Accepts Cash, Conventional, and VA financing
- HOA & community: Mandatory association; Annual association fee; Association fee covers grounds maintenance; HOA managed by FirstService Residential Texas
Exterior
- Parking: Covered parking for 2 vehicles; Driveway; Attached 2-car garage
- Security: Security system does not convey (exclusion noted)
- Utilities: City water; City sewer; No municipal utility district
- Home design: Single family residence; Residential property; One story; Built in 2021; Not attached to another property
- Construction: Brick and concrete construction; Slab foundation; Preowned
- Exterior features: Back yard fencing; Community pool
Interior
- Kitchen: Dishwasher; Microwave
- Bedrooms: 3 bedrooms (primary bedroom on main level)
- Flooring: Carpet; Ceramic tile; Luxury vinyl plank
- Bathrooms: 2 bathrooms
- Heating & cooling: Central heating; Central electric air conditioning
- Interior features: Granite counters; One living area; One dining area; Room count: 2
- Laundry & utility: No specific laundry details provided
Neighborhood map
What this means for you Summary
Snapshot
- This is a 3-bed/2.0-bath single-family listed at $285k.
Deal economics
- At list price, monthly cash flow is $-427 ($-5k/yr) — negative.
- To cash-flow at today's rent, offer at most $210k (26.5% below list).
- To meet the 1% rule (rent ≥ 1% of price), the offer needs to be $217k (23.8% below list).
- Recommended offer: $210k (26.5% below list) — sets the bar for cash-flow.
- Cap rate 4.5% vs local median 3.4% in Aubrey — top-decile yield for the area; either an underpriced asset or a hidden risk that comps aren't pricing in. Stress-test before assuming the spread holds.
Location & tenants
- Location reads 71/100 on livability (#332 in TX) — a middle-class / working-renter tenant base. Strengths: cost of living A+, housing A+, employment B; Watch: crime C-, amenities F, commute F.
- Aubrey ISD (rural): math 50% / reading 52% proficiency, ranked #119 of 826 in TX (top 14%) — acceptable for families but not a draw, mixed tenant base, ~2y average lease.
- Zoned schools: Hl Brockett (math 57% / reading 52%, grade C, #621 of 4,322 statewide, top 15%, 529 students, 34% FRL).
- Market conditions: Rents soft (-1.9%/yr); 1885 active listings in the ZIP; 37 comparable units currently listed for rent nearby; rentals at typical pace (median 18d on market — plan ~3-4 weeks tenant-placement turnaround); high-income renter base; 10,531 units permitted in Denton County in 2024 (2,713 in 5+ unit buildings).
Forward outlook
- Local home prices are declining (-3.0%/yr); year-one equity from $2k of loan paydown is wiped out by about $9k of value loss. Plan a longer hold.
- Denton County population projected at +66% by 2050 — long-run rental-demand tailwind backs the buy-and-hold thesis.
Negotiation context
- It's been on market 51 days — a 3% lower offer ($276k) is reasonable based on typical stale-listing flexibility.
- 3 sale attempts since 2y ago; this cycle's ask has dropped $35k (11%) from the opening price — seller is motivated, your offer sets the floor, not the list.
Risks & watch-outs
- Climate carrying-cost: moderate wind risk, 26% chance of damaging wind over 30y; major wildfire risk; extreme-heat days projected 7→22/yr by 2055 (HVAC capex compounding) — expect insurance premiums to compound above CPI over the hold.
Questions for the listing agent
- What do current leases actually rent for vs. the listed asking? Can we see a recent rent roll and the last 12 months of T-12 income?
- It's been on market 51 days. Have you received any prior offers? Is the seller open to a 26% concession, seller financing, or rate buy-down credit?
- What does the HOA fee cover, when was the last increase, and are there any pending special assessments or reserve-fund shortfalls?
- Is there a deadline driving the sale (1031 exchange, divorce, estate, relocation)? That informs how much negotiation room exists.
- The area grade is low — what's the realistic commute time and amenity access for the typical tenant pool here? Any planned neighborhood developments (good or bad) we should know about?
- What's the average days-on-market for RENTAL listings here right now (not sales)? A rising rental-DOM trend means longer vacancies and softer asking-rent achievability than the comps imply.
- What's the recent tenant-quality profile in this submarket — average credit score on applications, eviction rate, late-payment / NSF rate, and stable-employment percentage? A property-management company in the area should have these aggregated.
- How much new for-sale + rental construction is in the pipeline within 1–3 miles? Heavy new supply typically softens prices + rents 12–24 months out; constrained supply supports both.
Investment metrics
- 1% rule
- 0.76% ✗
- Cap rate
- 4.50%
- Cash-on-cash
- -6.42%
- DSCR
- 0.71
- GRM
- 10.9
CMA / ARV
- ARV (median comp)
- $338,216
- List price
- $285,000
- Delta
- -15.73%
- Verdict
- UNDERPRICED
- Comps
- 20 within 1.0 mi
Show comp detail 12 sales within ~0.75 mi
| Address | Dist | Beds/Ba | Sqft | Sold | Price | $/sf | Match |
|---|---|---|---|---|---|---|---|
| 677 Coleman St | 0.25mi | 3/2.0 | 1,651 (+1%) | 5mo | $325,000 | $197 | 83 |
| 632 Coleman St | 0.17mi | 3/2.0 | 1,525 (-7%) | 2mo | $275,000 | $180 | 79 |
| 1005 Karen St | 0.41mi | 3/2.0 | 1,690 (+3%) | 2mo | $329,900 | $195 | 73 |
| 272 Irick Ct | 0.41mi | 3/2.0 | 1,578 (-4%) | 10mo | $298,000 | $189 | 66 |
| 225 Holly Ct | 0.73mi | 3/2.0 | 1,591 (-3%) | 3mo | $325,000 | $204 | 59 |
| 203 Surveyors Rd | 0.61mi | 3/2.0 | 1,518 (-7%) | 1mo | $320,000 | $211 | 58 |
| 245 Highmeadow Rd | 0.61mi | 3/2.0 | 1,718 (+5%) | 6mo | $339,000 | $197 | 58 |
| 816 Ridgecrest Ct | 0.63mi | 3/2.0 | 1,584 (-3%) | 10mo | $325,000 | $205 | 57 |
| 118 Perkins Rd | 0.66mi | 3/2.0 | 1,498 (-8%) | 1mo | $314,900 | $210 | 54 |
| 828 Greenview Ct | 0.70mi | 3/2.0 | 1,502 (-8%) | 1mo | $320,000 | $213 | 53 |
| 1010 Diane St | 0.48mi | 4/2.0 (+1) | 1,832 (+12%) | 2mo | $409,900 | $224 | 51 |
| 324 Stanley Dr | 0.66mi | 3/2.0 | 1,812 (+11%) | 10mo | $320,000 | $177 | 44 |
Match score weights: distance 35% · size 25% · config 20% · recency 20%. Top-matched comps best support the ARV.
Projected returns pro-forma
-3.0% appreciation · 0.0% rent growth · sell at horizon
- IRR
- -31.1%
- Equity multiple
- 0.00×
- Total profit
- $-79,605
- Equity at exit
- $42,494
- IRR
- -57.3%
- Equity multiple
- -0.61×
- Total profit
- $-128,378
- Equity at exit
- $24,642
Cash invested: $79,800 (down + closing). Projections, not guarantees.
Landlord ↔ Tenant lean methodology
- Overall (STATE)
- 87 Strongly Landlord-Friendly
- State Texas
- 87 Strongly Landlord-Friendly · R+5
- County
- — inherits STATE
- City
- — inherits STATE
ZIP-level market 76227
- Home prices YoY
- -19.0%
- Rents YoY
- -1.9%
- Active inventory
- 1885
- Price-to-rent
- 10.9×
Monthly cashflow live
- Estimated rent
- $2,173 high interval (Pro) →
- Mortgage (P&I)
- −$1,495
- Tax from tax record
- −$482 /mo · $5,787/yr
- Insurance
- −$119
- HOA
- −$48
- Vacancy / Maint / Mgmt
- −$456
- Net cashflow
- $-427
Break-even live
UW: 25.0% down · 7.5% · 30yr · 1.5% tax · 5.0% vac · 8.0% maint · 8.0% mgmt
Financing live
Cash to close
- Down payment
- $71,250
- Closing costs
- $8,550
- Reserves months
- —
- Total cash needed
- —
Loan-product check · same deal, 3 products live
Conventional
25% down · 7.5% · 30yr
- Down + closing
- —
- Monthly P&I
- —
- Monthly cashflow
- —
- DSCR
- —
- Eligible?
- —
Personal DTI + credit; lowest rate.
DSCR
20% down · 8.5% · 30yr
- Down + closing
- —
- Monthly P&I
- —
- Monthly cashflow
- —
- DSCR
- —
- Eligible?
- —
No personal income docs; deal must DSCR.
Hard money
10% down · 12.0% · 12mo
- Down + closing
- —
- Monthly P&I
- —
- Monthly cashflow
- —
- DSCR
- —
- Eligible?
- —
Short-term bridge; refi at stabilization.
Rent comps 37 comps
| Address | Beds | Baths | Sqft | Rent | $/sqft | DOM | Units | Dist |
|---|---|---|---|---|---|---|---|---|
| 538 Concho St Aubrey, TX | 3.0 | 2.0 | 1613 | $2,285 | $1.42 | 7d | 1 | 0.11mi |
| 538 Concho St Aubrey, TX | 3.0 | 2.0 | 1613 | $2,285 | $1.42 | 16d | 1 | 0.11mi |
| 1011 Pecos St Aubrey, TX | 4.0 | 2.0 | 2040 | $2,300 | $1.13 | 43d | 1 | 0.15mi |
| 1000 Mason St Aubrey, TX | 3.0 | 2.0 | 1539 | $2,200 | $1.43 | 43d | 1 | 0.19mi |
| 685 Coleman St Aubrey, TX | 3.0 | 2.0 | 1869 | $2,400 | $1.28 | 7d | 1 | 0.28mi |
| 1000 King St Aubrey, TX | 3.0 | 2.5 | 2119 | $2,595 | $1.22 | 43d | 1 | 0.33mi |
| 933 King St Aubrey, TX | 3.0 | 2.0 | 1452 | $2,100 | $1.45 | 43d | 1 | 0.39mi |
| 901 King St Aubrey, TX | 4.0 | 2.5 | 1761 | $2,625 | $1.49 | 2d | 1 | 0.42mi |
| 717 Presidio St Aubrey, TX | 3.0 | 2.0 | 1498 | $2,100 | $1.40 | 18d | 1 | 0.43mi |
| 229 Irick Ct Aubrey, TX | 3.0 | 2.5 | 1346 | $2,000 | $1.49 | 3d | 1 | 0.47mi |
| 225 Glenview Dr Unit Dr Aubrey, TX | 4.0 | 2.0 | 2020 | $2,350 | $1.16 | 2d | 1 | 0.53mi |
| 601 Countryside Dr Aubrey, TX | 3.0 | 2.0 | 1500 | $1,700 | $1.13 | 4d | 1 | 0.74mi |
| 513 Rock Hill Rd Aubrey, TX | 4.0 | 2.0 | 1731 | $2,499 | $1.44 | 1d | 1 | 0.87mi |
| 502 Brumley Rd Krugerville, TX | 3.0 | 2.0 | 1470 | $1,895 | $1.29 | 43d | 1 | 0.89mi |
| 728 Dressage Ln Aubrey, TX | 4.0 | 2.0 | 1720 | $1,850 | $1.08 | 15d | 1 | 1.02mi |
| 732 Dressage Ln Aubrey, TX | 3.0 | 2.0 | 1522 | $1,986 | $1.30 | 43d | 1 | 1.03mi |
| 717 Dressage Ln Aubrey, TX | 3.0 | 2.0 | 1522 | $1,750 | $1.15 | 43d | 1 | 1.04mi |
| 2009 Derby Ln Aubrey, TX | 4.0 | 2.0 | 1720 | $1,950 | $1.13 | 5d | 1 | 1.06mi |
| 2021 Derby Ln Aubrey, TX | 3.0 | 2.0 | 1522 | $1,890 | $1.24 | 43d | 1 | 1.08mi |
| 2031 Stable Ln Aubrey, TX | 3.0 | 2.0 | 1515 | $1,950 | $1.29 | 6d | 1 | 1.08mi |
| 2043 Stable Ln Aubrey, TX | 4.0 | 2.0 | 1720 | $1,850 | $1.08 | 17d | 1 | 1.11mi |
| 2020 Belgian Dr Aubrey, TX | 3.0 | 2.0 | 1311 | $1,900 | $1.45 | 24d | 1 | 1.11mi |
| 2037 Derby Ln Aubrey, TX | 4.0 | 2.0 | 1720 | $1,995 | $1.16 | 20d | 1 | 1.12mi |
| 2029 Welsh Ln Aubrey, TX | 3.0 | 2.0 | 1522 | $2,066 | $1.36 | 12d | 1 | 1.13mi |
| 2051 Stable Ln Aubrey, TX | 4.0 | 2.0 | 1720 | $2,100 | $1.22 | 43d | 1 | 1.13mi |
| 2024 Sulky Ln Aubrey, TX | 3.0 | 2.0 | 1461 | $2,046 | $1.40 | 12d | 1 | 1.15mi |
| 2028 Sulky Ln Aubrey, TX | 3.0 | 2.0 | 1311 | $1,900 | $1.45 | 43d | 1 | 1.16mi |
| 2061 Belgian Dr Aubrey, TX | 4.0 | 2.0 | 1656 | $2,116 | $1.28 | 24d | 1 | 1.20mi |
| 213 S Magnolia St Aubrey, TX | 2.0 | 2.5 | 1261 | $1,395 | $1.11 | 43d | 1 | 1.22mi |
| 608 Arabian Ln Aubrey, TX | 4.0 | 2.0 | 2062 | $2,150 | $1.04 | 7d | 1 | 1.30mi |
| 604 Arabian Ln Aubrey, TX | 4.0 | 2.0 | 2062 | $2,150 | $1.04 | 7d | 1 | 1.31mi |
| 660 Stud Dr Aubrey, TX | 4.0 | 2.0 | 2062 | $2,499 | $1.21 | 1d | 1 | 1.35mi |
| 608 Stud Dr Aubrey, TX | 4.0 | 2.0 | 2062 | $2,250 | $1.09 | 24d | 1 | 1.36mi |
| 2220 Pommel Ln Aubrey, TX | 4.0 | 2.0 | 2062 | $1,995 | $0.97 | 10d | 1 | 1.37mi |
| 206 Linda St Aubrey, TX | 3.0 | 2.0 | 1600 | $1,850 | $1.16 | 24d | 1 | 1.39mi |
| 215 Linda St Aubrey, TX | 3.0 | 2.0 | 1350 | $1,825 | $1.35 | 44d | 1 | 1.46mi |
| 215 Linda St Aubrey, TX | 3.0 | 2.0 | 1350 | $1,795 | $1.33 | 5d | 1 | 1.46mi |
HOA detail
- Monthly dues
- $48 · $576/yr
- Likely covers
- landscaping
Listing history 27 events
-
2026-06-18days on market $285,000 Active 51 DOM
-
2026-06-17days on market $285,000 Active 50 DOM
-
2026-06-16days on market $285,000 Active 49 DOM
-
2026-06-15days on market $285,000 Active 48 DOM
-
2026-06-13days on market $285,000 Active 46 DOM
-
2026-06-13pricedays on market $285,000 Active 45 DOM
-
2026-06-09days on market $296,000 Active 42 DOM
-
2026-06-08days on market $296,000 Active 41 DOM
-
2026-06-07days on market $296,000 Active 40 DOM
-
2026-06-04days on market $296,000 Active 37 DOM
-
2026-06-03days on market $296,000 Active 36 DOM
-
2026-06-02days on market $296,000 Active 35 DOM
-
2026-06-01days on market $296,000 Active 34 DOM
-
2026-05-31days on market $296,000 Active 33 DOM
-
2026-05-14price $308,000 494-char remark
-
2026-04-28$320,000 Active 494-char remark
-
2026-04-13soldstatus
-
2025-02-07historical
-
2025-01-02price $345,000
-
2024-12-31price $400,000
-
2024-11-07$350,000 Active
-
2024-09-30historical
-
2024-09-23price $340,000
-
2024-08-06price $349,999
-
2024-05-23price $358,000
-
2024-05-18price $369,900
-
2024-05-09$379,900 Active
ⓘ Source: listings_history table (triggers on properties + properties_extension) + one-shot
backfill from property_details.listing_events for pre-trigger history.
Tax reassessment forecast TX · Resets to sale price
- Current annual tax
- $5,787 · $482/mo
- Projected year-2 tax
- $5,787 · $482/mo
- Expected delta
- $0/yr ($0/mo · 0.0%)
ⓘ Screening estimate from a state-policy table — verify with the county assessor before closing.
Climate risk First Street
- Flood 1/10 Low FEMA zone X (unshaded) · 0% chance over 30 yrs
- Wildfire 6/10 Major
- Heat 7/10 Severe 7 d/yr ≥109°F today · 22 d/yr by 30 yrs out
- Wind 5/10 Major 26% chance of damaging wind over 30 yrs
- Air quality 3/10 Moderate 3 unhealthy d/yr today · 4 by 30 yrs out
Nearby sold comps map
Loading sold comps map…
Walkable amenities ~0.75 mi
Loading nearby amenities…
Taxation est. · year 1
- Rental income
- $26,075
- − Mortgage interest
- −$15,964
- − Property taxes
- −$5,787
- − Insurance
- −$1,425
- − Repairs & maintenance
- −$2,086
- − Management
- −$2,086
- − HOA
- −$576
- − Depreciation
- −$8,291
- Taxable loss
- −$10,141
- Est. tax savings @ 24.0%
- +$2,434
- After-tax cash flow
- $-2,690/yr
For passive investors: Depreciation is non-cash, so a rental often shows a tax loss while cash-flowing — sheltering income. Rental losses are passive: they offset passive income freely, and up to $25,000/yr can offset ordinary (W-2) income if you actively participate and your MAGI is under $100k (phasing out to $0 by $150k); unused losses carry forward. On sale, claimed depreciation is recaptured at up to 25%, and gains may owe capital-gains tax (a 1031 exchange can defer both). Figures are a year-1 estimate at your 24.0% rate — not tax advice; consult a CPA.
Schools (NCES district)
- District
- Aubrey ISD
- NCES district ID
- 4808910
- Math proficiency
- 50% ▼ -9.00%
- Reading proficiency
- 52% ▼ -3.00%
- Median HH income
- $77,154
- Composite
- 46.21/100
- National rank
- #2492
- State rank
- #119 of 826 in TX
Livability — Aubrey
- Score
- 71/100
- State rank
- #332
- US rank
- #7241
Category grades
Schools grade is shown separately in the Schools card above.
Census & demographics
- Census place
- Aubrey, TX
- County
- Denton County · 901,654 people
- City population
- 62,127
- Metro
- Dallas-Fort Worth-Arlington, TX
- Population (ZIP)
- 62,127
- Household income
- $111,402
- Rent vs Own
- Severe rent burden
- 959.0
Population outlook (Denton County) Hauer SSP2
- Today (2025)
- 1,053,010 people
- By 2030
- 1,192,269 · +13.2%
- By 2040
- 1,472,920 · +39.9%
- By 2050
- 1,746,506 · +65.9%
- By 2075
- 2,358,497 · +124.0%
- By 2100
- 2,779,183 · +163.9%
Race, ethnicity, and origin ACS 2023
- Neighborhood character
- Diverse neighborhood (Simpson 0.63)
- Race & ethnicity
- White 55% Black 19% Hispanic / Latino 17% Two or more races 13% Asian 4%
- Hispanic origin (detail)
- Mexican 12% Puerto Rican 1%
- Common ancestry
- Lithuanian 4% Slovak 2% Italian 1%
- Foreign-born
- 11% · Canada, Jamaica
- Languages at home
- 82% English-only · Spanish 10% Other Indo-European 2% Other Asian/Pacific 2%
Political lean MEDSL · Denton
- 2024 margin
- R (+13.2) · D 42.7% · R 55.8% · Other 1.5%
- 2008→2024 swing
- +11.0pp toward D · 2008: -24.2pp · 2024: -13.2pp
- All cycles
- 2024: R+13.2 2020: R+8.1 2016: R+20.2 2012: R+31.7 2008: R+24.2
Not yet ingested
- Civics
- —
Market trends
- HPI YoY
- ▼ -59.76%
- Current HPI
- 254.2895
- Rent YoY
- ▼ -1.88%
- Metro
- Dallas-Fort Worth-Arlington, TX
- State GDP YoY
- ▲ 3.95%
- F500 in state
- 110
Industry mix (Fortune 500 HQ in TX)
| Industry | F500 HQs | Revenue |
|---|---|---|
| Energy | 16 | $1,198B |
|
||
| Technology | 5 | $198B |
|
||
| Engineering / Construction | 4 | $72B |
|
||
| Energy Services | 3 | $60B |
|
||
| Utilities | 3 | $41B |
|
||
| Healthcare | 2 | $330B |
|
||
Price history
-25.0% since first listed15 events — show timeline
- 2026-06-11 Price Changed $285,000 NTREIS
- 2026-05-28 Price Changed $296,000 NTREIS
- 2026-05-14 Price Changed $308,000 NTREIS
- 2026-04-28 Listed $320,000 NTREIS
- 2026-04-13 Sold (Public Records) — Public Records
- 2025-02-07 Listing Removed — NTREIS
- 2025-01-02 Price Changed $345,000 NTREIS
- 2024-12-31 Price Changed $400,000 NTREIS
- 2024-11-07 Listed $350,000 NTREIS
- 2024-09-30 Listing Removed — NTREIS
- 2024-09-23 Price Changed $340,000 NTREIS
- 2024-08-06 Price Changed $349,999 NTREIS
- 2024-05-23 Price Changed $358,000 NTREIS
- 2024-05-18 Price Changed $369,900 NTREIS
- 2024-05-09 Listed $379,900 NTREIS
Property tax history
+61.4%/yrLatest (2025): $5,787 · -0.1% YoY. Source: county tax records.
Cash-flow waterfall
monthlySold comps — $/sqft
last 12 mo · ≤1 miLoading sold comps…