22 Elder Dr · Duluth, MN
Flood risk 1/10 · Minimal
- FEMA flood zone
- X
- Chance of flooding over 30 yrs
- 0.0%
- Est. flood insurance / yr
- $473 – $860
Fire risk 3/10 · Minor
- Est. fire insurance / yr
- $888 – $1,650
Heat risk 1/10 · Minimal
- Hot days now (above 89°F)
- 7 days/yr
- Hot days in 30 yrs
- 14 days/yr
Wind risk 1/10 · Minimal
- Chance of severe wind over 30 yrs
- —
Air-quality risk 1/10 · Minimal
- Unhealthy air days now
- 0 days/yr
- Unhealthy air days in 30 yrs
- 0 days/yr
Risk factors via First Street. Map © Google.
Why this score? — see what drove the A- grade
The composite is a weighted blend of 9 inputs, each scored 0–100. Each bar is that input's sub-score; the figure is the points it added to the 100-point composite (weight × sub-score).
- Cash flow +30.0/30.0
- 1% rule +10.0/10.0
- DSCR +10.0/10.0
- Appreciation +10.0/10.0
- ARV discount +7.5/15.0
- Livability +4.1/5.0
- Schools +3.9/10.0
- Rent growth +2.5/5.0
- Condition / age +2.2/5.0
$64,900
🖨 Deal sheet 📄 Offer letter ✓ Due diligence
Listing remarks
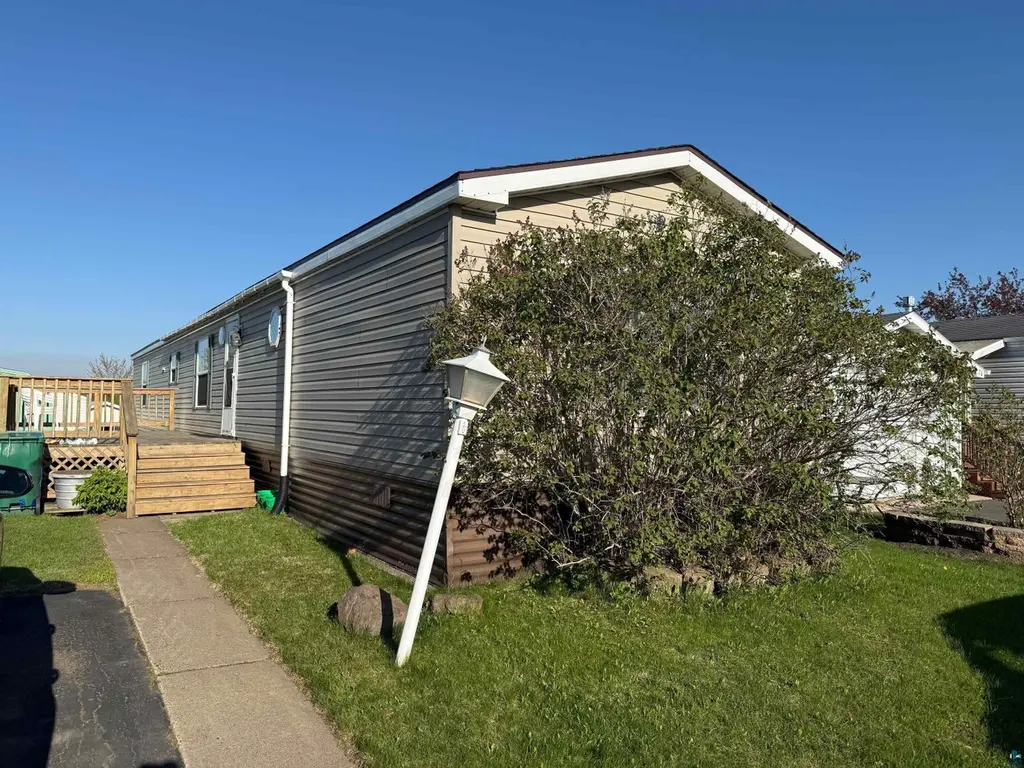
Don't miss out on the opportunity for affordable housing! This 3 br, 2 bath mobile home sits on a slab in Zenith Terrace. Very large side deck to enjoy the outdoors on. Spaciously large bedroom. Open floor plan with a large kitchen/dining area. Large laundry room and second bathroom. Zenith Terrace has playgrounds, recreational storage available, and a community center. Prospective buyers must also apply through the Zenith Terrace management for approval to purchase. Lot rent of $770 includes mowing and garbage.
Key facts
- Open floor plan
- Large side deck
- Large laundry room
Tags
Property features AI
Finance
- Financial info: Land lease payment $770
Exterior
- Parking: No on-site parking
- Utilities: Public water; Public sewer
- Home design: Single family detached residence; One-story
- Construction: Other foundation
- Exterior features: Leased lot
Interior
- Bathrooms: 2 full bathrooms
- Heating & cooling: Forced air heating; Natural gas heating
- Interior features: Master bedroom on the main floor; Crawl space basement
Neighborhood map
What this means for you Summary
Snapshot
- This is a 3-bed/2.0-bath single-family listed at $65k. Condition is rated fair.
Deal economics
- At list price, monthly cash flow is $609 ($7k/yr) — positive.
- The deal already cash-flows at list — no discount required.
- Meets the 1% rule at list price ($1k rent vs $65k).
- Recommended offer: $64k (1.5% below list) — sets the bar for market timing.
- Cap rate 17.5% vs local median 4.9% in Duluth — top-decile yield for the area; either an underpriced asset or a hidden risk that comps aren't pricing in. Stress-test before assuming the spread holds.
Location & tenants
- Location reads 82/100 on livability (#36 in MN, #1,060 nationally) — a professional / high-income tenant draw. Strengths: commute A+, cost of living A+, housing A+; Watch: amenities F.
- Proctor Public School District (suburban): math 39% / reading 49% proficiency, ranked #177 of 301 in MN (top 59%) — families likely to look elsewhere, expect single-tenant / working-renter base with shorter leases.
- Market conditions: 50 active listings in the ZIP; 639 units permitted in St. Louis County in 2024 (338 in 5+ unit buildings).
Forward outlook
- In year one you build about $7k of equity ($449 loan paydown + $6k appreciation (10.0% local appreciation)).
- At projected returns (10.0% appreciation + 3.0% rent growth), your $18k cash investment doubles in ~2 years — after that, you're playing with house money.
- By year 5, paydown + projected appreciation supports a ~$32k cash-out refi (75% LTV) — recoverable capital for the next deal without selling this one.
Negotiation context
- It's been on market 17 days — a 2% lower offer ($64k) is reasonable based on typical stale-listing flexibility.
Questions for the listing agent
- Have any recent inspections been done? Can we get a copy of the seller's disclosures and any deferred-maintenance estimates?
- Is there a deadline driving the sale (1031 exchange, divorce, estate, relocation)? That informs how much negotiation room exists.
- Schools are B-rated — typically a magnet for longer-tenancy family renters. What's the average tenant stay here, and is there a school-zone premium baked into asking?
- What's the average days-on-market for RENTAL listings here right now (not sales)? A rising rental-DOM trend means longer vacancies and softer asking-rent achievability than the comps imply.
- What's the recent tenant-quality profile in this submarket — average credit score on applications, eviction rate, late-payment / NSF rate, and stable-employment percentage? A property-management company in the area should have these aggregated.
- How much new for-sale + rental construction is in the pipeline within 1–3 miles? Heavy new supply typically softens prices + rents 12–24 months out; constrained supply supports both.
Investment metrics
- 1% rule
- 2.06% ✓
- Cap rate
- 17.55%
- Cash-on-cash
- 40.20%
- DSCR
- 2.79
- GRM
- 4.0
CMA / ARV
- ARV (on-the-fly)
- $175,360
- Comps found
- 12
Show comp detail 12 sales within ~0.75 mi
| Address | Dist | Beds/Ba | Sqft | Sold | Price | $/sf | Match |
|---|---|---|---|---|---|---|---|
| 33 Ivy Dr | 0.27mi | 3/2.0 | 1,296 (+1%) | 2mo | $98,500 | $76 | 84 |
| 21 Kalmia Dr | 0.15mi | 3/2.0 | 1,216 (-5%) | 1mo | $85,000 | $70 | 84 |
| 48 Arbutus Dr | 0.17mi | 3/2.0 | 1,216 (-5%) | 0mo | $70,000 | $58 | 83 |
| 7 Greenbriar Dr | 0.28mi | 2/2.0 (-1) | 1,216 (-5%) | 1mo | $80,000 | $66 | 73 |
| 9234 Brook St | 0.44mi | 3/2.0 | 1,216 (-5%) | 0mo | $245,000 | $201 | 71 |
| 8 4th St | 0.47mi | 3/2.0 | 1,371 (+7%) | 1mo | $175,000 | $128 | 65 |
| 9235 Meadow St | 0.40mi | 3/1.0 | 1,309 (+2%) | 10mo | $179,000 | $137 | 65 |
| 111 2nd St | 0.48mi | 2/2.5 (-1) | 1,332 (+4%) | 1mo | $310,000 | $233 | 63 |
| 110 Grove St | 0.40mi | 2/2.0 (-1) | 1,156 (-10%) | 5mo | $271,000 | $234 | 56 |
| 21 4th St | 0.51mi | 3/2.0 | 1,390 (+9%) | 13mo | $150,000 | $108 | 51 |
| 9123 Brook St | 0.43mi | 2/2.0 (-1) | 1,091 (-15%) | 7mo | $220,000 | $202 | 45 |
| 710 N Boundary Ave | 0.69mi | 3/2.5 | 1,411 (+10%) | 10mo | $320,000 | $227 | 40 |
Match score weights: distance 35% · size 25% · config 20% · recency 20%. Top-matched comps best support the ARV.
Projected returns pro-forma
10.0% appreciation · 3.0% rent growth · sell at horizon
- IRR
- 55.4%
- Equity multiple
- 5.08×
- Total profit
- $74,135
- Equity at exit
- $58,467
- IRR
- 48.9%
- Equity multiple
- 11.34×
- Total profit
- $187,868
- Equity at exit
- $126,086
Cash invested: $18,172 (down + closing). Projections, not guarantees.
Landlord ↔ Tenant lean methodology
- Overall (STATE)
- 46 Balanced
- State Minnesota
- 46 Balanced · D+2
- County
- — inherits STATE
- City
- — inherits STATE
ZIP-level market 55810
- Home prices YoY
- 11.6%
- Active inventory
- 50
- Price-to-rent
- 4.0×
Monthly cashflow live
- Estimated rent
- $1,338 medium interval (Pro) →
- Mortgage (P&I)
- −$340
- Tax est. 1.5%
- −$81 /mo · $974/yr
- Insurance
- −$27
- HOA
- −$0
- Vacancy / Maint / Mgmt
- −$281
- Net cashflow
- $609
Break-even live
UW: 25.0% down · 7.5% · 30yr · 1.5% tax · 5.0% vac · 8.0% maint · 8.0% mgmt
Financing live
Cash to close
- Down payment
- $16,225
- Closing costs
- $1,947
- Reserves months
- —
- Total cash needed
- —
Loan-product check · same deal, 3 products live
Conventional
25% down · 7.5% · 30yr
- Down + closing
- —
- Monthly P&I
- —
- Monthly cashflow
- —
- DSCR
- —
- Eligible?
- —
Personal DTI + credit; lowest rate.
DSCR
20% down · 8.5% · 30yr
- Down + closing
- —
- Monthly P&I
- —
- Monthly cashflow
- —
- DSCR
- —
- Eligible?
- —
No personal income docs; deal must DSCR.
Hard money
10% down · 12.0% · 12mo
- Down + closing
- —
- Monthly P&I
- —
- Monthly cashflow
- —
- DSCR
- —
- Eligible?
- —
Short-term bridge; refi at stabilization.
Listing history 13 events
-
2026-06-19days on market $64,900 Active 17 DOM
-
2026-06-18days on market $64,900 Active 16 DOM
-
2026-06-17days on market $64,900 Active 15 DOM
-
2026-06-16days on market $64,900 Active 14 DOM
-
2026-06-15days on market $64,900 Active 13 DOM
-
2026-06-14days on market $64,900 Active 11 DOM
-
2026-06-13days on market $64,900 Active 10 DOM
-
2026-06-10days on market $64,900 Active 8 DOM
-
2026-06-09days on market $64,900 Active 7 DOM
-
2026-06-08days on market $64,900 Active 6 DOM
-
2026-06-07days on market $64,900 Active 5 DOM
-
2026-06-03remarks 518-char remark
-
2026-06-03$64,900 Active 1 DOM
ⓘ Source: listings_history table (triggers on properties + properties_extension) + one-shot
backfill from property_details.listing_events for pre-trigger history.
Climate risk First Street
- Flood 1/10 Low FEMA zone X · 0% chance over 30 yrs
- Wildfire 3/10 Moderate
- Heat 1/10 Low 7 d/yr ≥89°F today · 14 d/yr by 30 yrs out
- Wind 1/10 Low
- Air quality 1/10 Low 0 unhealthy d/yr today · 0 by 30 yrs out
Nearby sold comps map
Loading sold comps map…
Walkable amenities ~0.75 mi
Loading nearby amenities…
Taxation est. · year 1
- Rental income
- $16,059
- − Mortgage interest
- −$3,635
- − Property taxes
- −$974
- − Insurance
- −$324
- − Repairs & maintenance
- −$1,285
- − Management
- −$1,285
- − Depreciation
- −$1,888
- Taxable income
- $6,668
- Est. tax owed @ 24.0%
- −$1,600
- After-tax cash flow
- $5,704/yr
For passive investors: Depreciation is non-cash, so a rental often shows a tax loss while cash-flowing — sheltering income. Rental losses are passive: they offset passive income freely, and up to $25,000/yr can offset ordinary (W-2) income if you actively participate and your MAGI is under $100k (phasing out to $0 by $150k); unused losses carry forward. On sale, claimed depreciation is recaptured at up to 25%, and gains may owe capital-gains tax (a 1031 exchange can defer both). Figures are a year-1 estimate at your 24.0% rate — not tax advice; consult a CPA.
Condition & rehab AI · 13 photos
This mobile home requires moderate repairs and maintenance to improve its condition and value. Key areas for improvement include the kitchen, bathrooms, exterior siding, and flooring. Painting and updating fixtures can significantly enhance its appeal and value.
Repairs flagged
- Moderate kitchen cabinets — Cluttered and dated
- Moderate bathroom fixtures — Dated and in need of replacement
- Moderate exterior siding — Weathered and discolored
- Moderate kitchen flooring — Worn and dated
Value-add opportunities
- Both Paint interior walls — Fresh paint can improve the home's appearance and value
- Both Replace dated kitchen cabinets and flooring — New cabinets and flooring can significantly enhance the home's appeal and value
- Both Replace dated bathroom fixtures — New fixtures can improve functionality and aesthetics
- Both Paint exterior siding — Fresh paint can improve the home's curb appeal and value
Renovation cost estimate screening
| Repair item | Severity | Est. cost |
|---|---|---|
| kitchen cabinets · Cluttered and dated | Moderate | $3,000–15,000 |
| bathroom fixtures · Dated and in need of replacement | Moderate | $3,000–15,000 |
| exterior siding · Weathered and discolored | Moderate | $3,000–15,000 |
| kitchen flooring · Worn and dated | Moderate | $3,000–15,000 |
| Total estimated repair cost · 4 items | $12,000–60,000 |
Value-add ROI direction
- Both Paint interior walls — Fresh paint can improve the home's appearance and value ↑
- Both Replace dated kitchen cabinets and flooring — New cabinets and flooring can significantly enhance the home's appeal and value ↑
- Both Replace dated bathroom fixtures — New fixtures can improve functionality and aesthetics ↑
- Both Paint exterior siding — Fresh paint can improve the home's curb appeal and value ↑
ⓘ Cost ranges are severity-bucket heuristics (US national rule-of-thumb). Get contractor quotes + a written scope before underwriting a rehab budget.
Schools (NCES district)
- District
- Proctor Public School District
- NCES district ID
- 2730090
- Math proficiency
- 39% ▼ -20.00%
- Reading proficiency
- 49% ▼ -11.00%
- Median HH income
- $61,151
- Composite
- 38.84/100
- National rank
- #4106
- State rank
- #177 of 301 in MN
Livability — Duluth
- Score
- 82/100
- State rank
- #36
- US rank
- #1060
Category grades
Schools grade is shown separately in the Schools card above.
Census & demographics
- Census place
- Duluth, MN
- City population
- 71,097
- Population (ZIP)
- 8,305
Population outlook (St. Louis County) Hauer SSP2
- Today (2025)
- 202,411 people
- By 2030
- 203,234 · +0.4%
- By 2040
- 202,520 · +0.1%
- By 2050
- 200,853 · -0.8%
- By 2075
- 200,943 · -0.7%
- By 2100
- 192,058 · -5.1%
Race, ethnicity, and origin ACS 2023
- Neighborhood character
- Predominantly White (90%)
- Race & ethnicity
- White 90% Two or more races 4% Native American 2% Asian 1% Black 1%
- Common ancestry
- Portuguese 13% Romanian 5% Lithuanian 3%
- Foreign-born
- 1% · China, Vietnam
- Languages at home
- 98% English-only · Other Indo-European 1%
Political lean MEDSL · St. Louis
- 2024 margin
- D (+13.7) · D 55.9% · R 42.2% · Other 1.8%
- 2008→2024 swing
- -18.8pp toward R · 2008: 32.5pp · 2024: 13.7pp
- All cycles
- 2024: D+13.7 2020: D+15.6 2016: D+11.8 2012: D+29.6 2008: D+32.5
Not yet ingested
- Civics
- —
Market trends
- HPI YoY
- ▲ 53.59%
- Current HPI
- 515.02
- Rent YoY
- —
- Metro
- —
- State GDP YoY
- ▲ 2.41%
- F500 in state
- 34
Industry mix (Fortune 500 HQ in MN)
| Industry | F500 HQs | Revenue |
|---|---|---|
| Healthcare | 2 | $407B |
|
||
| Retail | 2 | $150B |
|
||
| Consumer Goods | 2 | $32B |
|
||
| Industrial Machinery | 2 | $6B |
|
||
| Agriculture | 1 | $40B |
|
||
| Healthcare / Medical Devices | 1 | $32B |
|
||
Price history
1 event — show timeline
- 2026-06-01 Listed $64,900 LSAR
Cash-flow waterfall
monthlySold comps — $/sqft
last 12 mo · ≤1 miLoading sold comps…