268 Marie St · Jacksonville, NC
Flood risk 8/10 · Major
- FEMA flood zone
- X (unshaded)
- Chance of flooding over 30 yrs
- 0.99%
- Est. flood insurance / yr
- $507 – $1,088
Fire risk 5/10 · Moderate
- Est. fire insurance / yr
- $906 – $1,684
Heat risk 9/10 · Severe
- Hot days now (above 106°F)
- 7 days/yr
- Hot days in 30 yrs
- 18 days/yr
Wind risk 8/10 · Major
- Chance of severe wind over 30 yrs
- 98.0%
Air-quality risk 3/10 · Minor
- Unhealthy air days now
- 2 days/yr
- Unhealthy air days in 30 yrs
- 4 days/yr
Risk factors via First Street. Map © Google.
Why this score? — see what drove the D grade
The composite is a weighted blend of 9 inputs, each scored 0–100. Each bar is that input's sub-score; the figure is the points it added to the 100-point composite (weight × sub-score).
- Cash flow +15.0/30.0
- ARV discount +7.5/15.0
- 1% rule +5.0/10.0
- DSCR +5.0/10.0
- Schools +3.9/10.0
- Livability +3.6/5.0
- Rent growth +3.5/5.0
- Condition / age +1.0/5.0
- Appreciation +0.0/10.0
$30,000
🖨 Deal sheet 📄 Offer letter ✓ Due diligence
Listing remarks
Step into comfortable, relaxed living with this beautifully laid-out 2001 TIMB manufactured home, offering an impressive 28x48 floor plan that gives you all the space you need to live and entertain. The open floor plan creates a bright, airy atmosphere that flows effortlessly from room to room, making the home feel even larger than its already generous footprint. The kitchen is a true centerpiece, featuring a convenient island that& apos; s perfect for meal prep, casual dining, or gathering with family and friends. Priced at just $30,000, this is a home-only sale & acirc; & euro; & rdquo; a fantastic opportunity to own your own place while enjoying the perks of a well-maint
Key facts
- Open floor plan
- Open green spaces
- Community pool
Tags
Neighborhood map
What this means for you Summary
Snapshot
- This is a 3-bed/2.0-bath other listed at $30k. Condition is rated poor.
Deal economics
- At list price, monthly cash flow is $893 ($11k/yr) — positive.
- The deal already cash-flows at list — no discount required.
- Meets the 1% rule at list price ($1k rent vs $30k).
- Recommended offer: $30k (1.5% below list) — sets the bar for market timing.
- Cap rate 44.7% vs local median 4.4% in Jacksonville — top-decile yield for the area; either an underpriced asset or a hidden risk that comps aren't pricing in. Stress-test before assuming the spread holds.
Location & tenants
- Location reads 71/100 on livability (#111 in NC) — a middle-class / working-renter tenant base. Strengths: cost of living A+, housing A+, health & safety A+; Watch: schools C-, employment D, crime F.
- Onslow County Schools (other): math 42% / reading 49% proficiency, ranked #84 of 178 in NC (top 47%) — families likely to look elsewhere, expect single-tenant / working-renter base with shorter leases.
- Market conditions: Rents rising (+3.9%/yr); 604 active listings in the ZIP; 19 comparable units currently listed for rent nearby; rentals at typical pace (median 21d on market — plan ~3-4 weeks tenant-placement turnaround); 1,246 units permitted in Onslow County in 2024 (0 in 5+ unit buildings).
Forward outlook
- Local home prices are declining (-3.0%/yr); year-one equity from $207 of loan paydown is wiped out by about $900 of value loss. Plan a longer hold.
- At projected returns (-3.0% appreciation + 3.9% rent growth), your $8k cash investment doubles in ~1 year — after that, you're playing with house money.
Negotiation context
- It's been on market 24 days — a 2% lower offer ($30k) is reasonable based on typical stale-listing flexibility.
Risks & watch-outs
- Watch-outs: flood insurance adds $66/mo.
- Climate carrying-cost: severe flood risk; severe wind risk, 98% chance of damaging wind over 30y; moderate wildfire risk; extreme-heat days projected 7→18/yr by 2055 (HVAC capex compounding) — expect insurance premiums to compound above CPI over the hold.
Questions for the listing agent
- Have any recent inspections been done? Can we get a copy of the seller's disclosures and any deferred-maintenance estimates?
- What's the actual annual flood-insurance premium (NFIP or private), and is the property in a SFHA with mandatory coverage?
- Is there a deadline driving the sale (1031 exchange, divorce, estate, relocation)? That informs how much negotiation room exists.
- Crime grade is F in this area — have there been break-ins, vandalism, or insurance claims at this property in the last 3 years? What carrier currently insures it and at what premium?
- The area grade is low — what's the realistic commute time and amenity access for the typical tenant pool here? Any planned neighborhood developments (good or bad) we should know about?
- What's the average days-on-market for RENTAL listings here right now (not sales)? A rising rental-DOM trend means longer vacancies and softer asking-rent achievability than the comps imply.
- What's the recent tenant-quality profile in this submarket — average credit score on applications, eviction rate, late-payment / NSF rate, and stable-employment percentage? A property-management company in the area should have these aggregated.
- How much new for-sale + rental construction is in the pipeline within 1–3 miles? Heavy new supply typically softens prices + rents 12–24 months out; constrained supply supports both.
Investment metrics
- 1% rule
- 4.92% ✓
- Cap rate
- 44.66%
- Cash-on-cash
- 137.01%
- DSCR
- 7.10
- GRM
- 1.7
CMA / ARV
No comps found within radius.
Projected returns pro-forma
-3.0% appreciation · 3.86% rent growth · sell at horizon
- IRR
- —
- Equity multiple
- 7.35×
- Total profit
- $53,343
- Equity at exit
- $4,473
- IRR
- —
- Equity multiple
- 15.92×
- Total profit
- $125,295
- Equity at exit
- $2,594
Cash invested: $8,400 (down + closing). Projections, not guarantees.
Landlord ↔ Tenant lean methodology
- Overall (STATE)
- 85 Strongly Landlord-Friendly
- State North Carolina
- 85 Strongly Landlord-Friendly · R+3
- County
- — inherits STATE
- City
- — inherits STATE
ZIP-level market 28546
- Home prices YoY
- -19.3%
- Rents YoY
- 3.9%
- Active inventory
- 604
- Price-to-rent
- 1.7×
Monthly cashflow live
- Estimated rent
- $1,476 high interval (Pro) →
- Mortgage (P&I)
- −$157
- Tax est. 1.5%
- −$38 /mo · $450/yr
- Insurance
- −$12
- Flood insurance flood zone
- −$66 /mo · $798/yr
- HOA
- −$0
- Vacancy / Maint / Mgmt
- −$310
- Net cashflow
- $893
Break-even live
UW: 25.0% down · 7.5% · 30yr · 1.5% tax · 5.0% vac · 8.0% maint · 8.0% mgmt
Financing live
Cash to close
- Down payment
- $7,500
- Closing costs
- $900
- Reserves months
- —
- Total cash needed
- —
Loan-product check · same deal, 3 products live
Conventional
25% down · 7.5% · 30yr
- Down + closing
- —
- Monthly P&I
- —
- Monthly cashflow
- —
- DSCR
- —
- Eligible?
- —
Personal DTI + credit; lowest rate.
DSCR
20% down · 8.5% · 30yr
- Down + closing
- —
- Monthly P&I
- —
- Monthly cashflow
- —
- DSCR
- —
- Eligible?
- —
No personal income docs; deal must DSCR.
Hard money
10% down · 12.0% · 12mo
- Down + closing
- —
- Monthly P&I
- —
- Monthly cashflow
- —
- DSCR
- —
- Eligible?
- —
Short-term bridge; refi at stabilization.
Rent comps 19 comps
| Address | Beds | Baths | Sqft | Rent | $/sqft | DOM | Units | Dist |
|---|---|---|---|---|---|---|---|---|
| 553 Corbin St Lot A-633 Jacksonville, NC | 3.0 | 2.0 | 1216 | $48,000 | $39.47 | 21d | 1 | 0.11mi |
| 553 Corbin St Lot A-255 Jacksonville, NC | 2.0 | 2.0 | 896 | $18,000 | $20.09 | 21d | 1 | 0.11mi |
| 553 Corbin St Lot A-620 Jacksonville, NC | 3.0 | 2.0 | 980 | $20,000 | $20.41 | 21d | 1 | 0.32mi |
| 553 Corbin St Lot A-334 Jacksonville, NC | 3.0 | 2.0 | 952 | $15,000 | $15.76 | 21d | 1 | 0.32mi |
| 553 Corbin St Lot A-634 Jacksonville, NC | 3.0 | 2.0 | 952 | $12,000 | $12.61 | 21d | 1 | 0.32mi |
| 131 Cornerstone Pl Jacksonville, NC | 2.0 | 2.5 | 928 | $1,100 | $1.19 | 21d | 1 | 0.51mi |
| 104 Spring Meadows Cir Jacksonville, NC | 2.0 | 2.5 | 992 | $1,100 | $1.11 | 13d | 1 | 0.73mi |
| 209 Mesa Ln Jacksonville, NC | 2.0 | 2.5 | 992 | $1,350 | $1.36 | 21d | 1 | 0.87mi |
| 106 Pinegrove Ct Jacksonville, NC | 2.0 | 2.5 | 992 | $1,200 | $1.21 | 13d | 1 | 0.90mi |
| 507 Birchwood Ct Jacksonville, NC | 3.0 | 2.0 | 1314 | $1,525 | $1.16 | 13d | 1 | 0.97mi |
| 977 W Pueblo Dr Jacksonville, NC | 2.0 | 2.5 | 992 | $1,195 | $1.20 | 21d | 1 | 1.01mi |
| 981 W Pueblo Dr Jacksonville, NC | 2.0 | 2.0 | 882 | $1,250 | $1.42 | 21d | 1 | 1.02mi |
| 102 Riverbirch Pl Jacksonville, NC | 3.0 | 2.5 | 1520 | $2,400 | $1.58 | 21d | 1 | 1.02mi |
| 120 Palace Cir Jacksonville, NC | 3.0 | 2.5 | 1378 | $1,400 | $1.02 | 21d | 1 | 1.04mi |
| 236 White Oak Blvd Jacksonville, NC | 3.0 | 2.0 | 1275 | $1,650 | $1.29 | 21d | 1 | 1.07mi |
| 1110 Pueblo Dr Jacksonville, NC | 2.0 | 2.5 | 992 | $1,250 | $1.26 | 21d | 1 | 1.16mi |
| 2033 Brandymill Ln Jacksonville, NC | 2.0 | 2.5 | 992 | $1,300 | $1.31 | 21d | 1 | 1.17mi |
| 110 Sycamore Dr Jacksonville, NC | 3.0 | 2.0 | 1433 | $1,750 | $1.22 | 21d | 1 | 1.22mi |
| 821 Shadowridge Rd Jacksonville, NC | 3.0 | 2.0 | 1488 | $750 | $0.50 | 21d | 1 | 1.41mi |
Listing history 17 events
-
2026-06-19days on market $30,000 Active 24 DOM
-
2026-06-18days on market $30,000 Active 23 DOM
-
2026-06-17days on market $30,000 Active 22 DOM
-
2026-06-16days on market $30,000 Active 21 DOM
-
2026-06-15days on market $30,000 Active 20 DOM
-
2026-06-14days on market $30,000 Active 18 DOM
-
2026-06-13days on market $30,000 Active 17 DOM
-
2026-06-10days on market $30,000 Active 15 DOM
-
2026-06-09days on market $30,000 Active 14 DOM
-
2026-06-09days on market $30,000 Active 13 DOM
-
2026-06-07days on market $30,000 Active 12 DOM
-
2026-06-03days on market $30,000 Active 8 DOM
-
2026-06-02days on market $30,000 Active 7 DOM
-
2026-06-01days on market $30,000 Active 6 DOM
-
2026-05-31days on market $30,000 Active 5 DOM
-
2026-05-30days on market $30,000 Active 4 DOM
-
2026-05-26$30,000 Active
ⓘ Source: listings_history table (triggers on properties + properties_extension) + one-shot
backfill from property_details.listing_events for pre-trigger history.
Climate risk First Street
- Flood 8/10 Severe FEMA zone X (unshaded) · 99% chance over 30 yrs
- Wildfire 5/10 Major
- Heat 9/10 Extreme 7 d/yr ≥106°F today · 18 d/yr by 30 yrs out
- Wind 8/10 Severe 98% chance of damaging wind over 30 yrs
- Air quality 3/10 Moderate 2 unhealthy d/yr today · 4 by 30 yrs out
Nearby sold comps map
Loading sold comps map…
Walkable amenities ~0.75 mi
Loading nearby amenities…
Taxation est. · year 1
- Rental income
- $17,718
- − Mortgage interest
- −$1,680
- − Property taxes
- −$450
- − Insurance
- −$948
- − Repairs & maintenance
- −$1,417
- − Management
- −$1,417
- − Depreciation
- −$873
- Taxable income
- $10,932
- Est. tax owed @ 24.0%
- −$2,624
- After-tax cash flow
- $8,088/yr
For passive investors: Depreciation is non-cash, so a rental often shows a tax loss while cash-flowing — sheltering income. Rental losses are passive: they offset passive income freely, and up to $25,000/yr can offset ordinary (W-2) income if you actively participate and your MAGI is under $100k (phasing out to $0 by $150k); unused losses carry forward. On sale, claimed depreciation is recaptured at up to 25%, and gains may owe capital-gains tax (a 1031 exchange can defer both). Figures are a year-1 estimate at your 24.0% rate — not tax advice; consult a CPA.
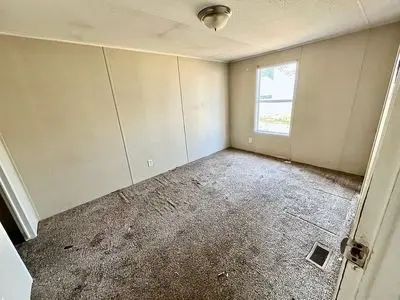
Condition & rehab AI · 1 photo
This manufactured home requires extensive repairs and updates to its exterior, interior, and HVAC systems, significantly impacting its value. Immediate action is needed to address these issues before considering resale or rental.
Repairs flagged
- Major roof — No visible roof condition
- Major exterior siding — No visible siding condition
- Major interior walls/paint — No visible interior condition
- Major HVAC/mechanical — No visible HVAC/mechanical condition
Value-add opportunities
- Both exterior painting and siding repair — Improves curb appeal and home value
- Both HVAC system replacement — Enhances comfort and energy efficiency
- Both interior painting and minor repairs — Enhances home aesthetics and value
Renovation cost estimate screening
| Repair item | Severity | Est. cost |
|---|---|---|
| roof · No visible roof condition | Major | $15,000–50,000 |
| exterior siding · No visible siding condition | Major | $15,000–50,000 |
| interior walls/paint · No visible interior condition | Major | $15,000–50,000 |
| HVAC/mechanical · No visible HVAC/mechanical condition | Major | $15,000–50,000 |
| Total estimated repair cost · 4 items | $60,000–200,000 |
Value-add ROI direction
- Both exterior painting and siding repair — Improves curb appeal and home value ↑
- Both HVAC system replacement — Enhances comfort and energy efficiency ↑
- Both interior painting and minor repairs — Enhances home aesthetics and value ↑
ⓘ Cost ranges are severity-bucket heuristics (US national rule-of-thumb). Get contractor quotes + a written scope before underwriting a rehab budget.
Schools (NCES district)
- District
- Onslow County Schools
- NCES district ID
- 3703450
- Math proficiency
- 42% ▲ 6.00%
- Reading proficiency
- 49% ▲ 5.00%
- Median HH income
- $46,076
- Composite
- 38.66/100
- National rank
- #4148
- State rank
- #84 of 178 in NC
Livability — Jacksonville
- Score
- 71/100
- State rank
- #111
- US rank
- #6991
Category grades
Schools grade is shown separately in the Schools card above.
Census & demographics
- Census place
- Jacksonville, NC
- County
- Onslow County · 164,453 people
- City population
- 96,397
- Metro
- Jacksonville, NC
- Population (ZIP)
- 47,256
- Household income
- $63,561
- Rent vs Own
- Severe rent burden
- 1830.0
Population outlook (Onslow County) Hauer SSP2
- Today (2025)
- 189,789 people
- By 2030
- 194,463 · +2.5%
- By 2040
- 193,629 · +2.0%
- By 2050
- 193,248 · +1.8%
- By 2075
- 196,995 · +3.8%
- By 2100
- 201,513 · +6.2%
Race, ethnicity, and origin ACS 2023
- Neighborhood character
- Diverse neighborhood (Simpson 0.62)
- Race & ethnicity
- White 57% Black 18% Hispanic / Latino 16% Two or more races 13% Asian 2%
- Hispanic origin (detail)
- Mexican 5% Puerto Rican 5% Dominican 1%
- Common ancestry
- Romanian 1% Serbian 1% Slovak 1%
- Foreign-born
- 5% · Canada, South Korea
- Languages at home
- 89% English-only · Spanish 8% German/W. Germanic 1% Tagalog/Filipino 1%
Political lean MEDSL · Onslow
- 2024 margin
- Solid R (+35.9) · D 31.5% · R 67.5% · Other 1.0%
- 2008→2024 swing
- -14.5pp toward R · 2008: -21.5pp · 2024: -35.9pp
- All cycles
- 2024: R+35.9 2020: R+30.2 2016: R+34.6 2012: R+27.0 2008: R+21.5
Not yet ingested
- Civics
- —
Market trends
- HPI YoY
- ▼ -50.75%
- Current HPI
- 211.9993
- Rent YoY
- ▲ 3.86%
- Metro
- Jacksonville, NC
- State GDP YoY
- ▲ 3.28%
- F500 in state
- 26
Industry mix (Fortune 500 HQ in NC)
| Industry | F500 HQs | Revenue |
|---|---|---|
| Financial Services | 2 | $213B |
|
||
| Retail | 2 | $95B |
|
||
| Industrial Conglomerate | 1 | $38B |
|
||
| Metals / Steel | 1 | $35B |
|
||
| Utilities | 1 | $30B |
|
||
| Industrial Machinery | 1 | $19B |
|
||
Price history
1 event — show timeline
- 2026-05-26 Listed $30,000 FSBO.com
Cash-flow waterfall
monthlySold comps — $/sqft
last 12 mo · ≤1 miLoading sold comps…