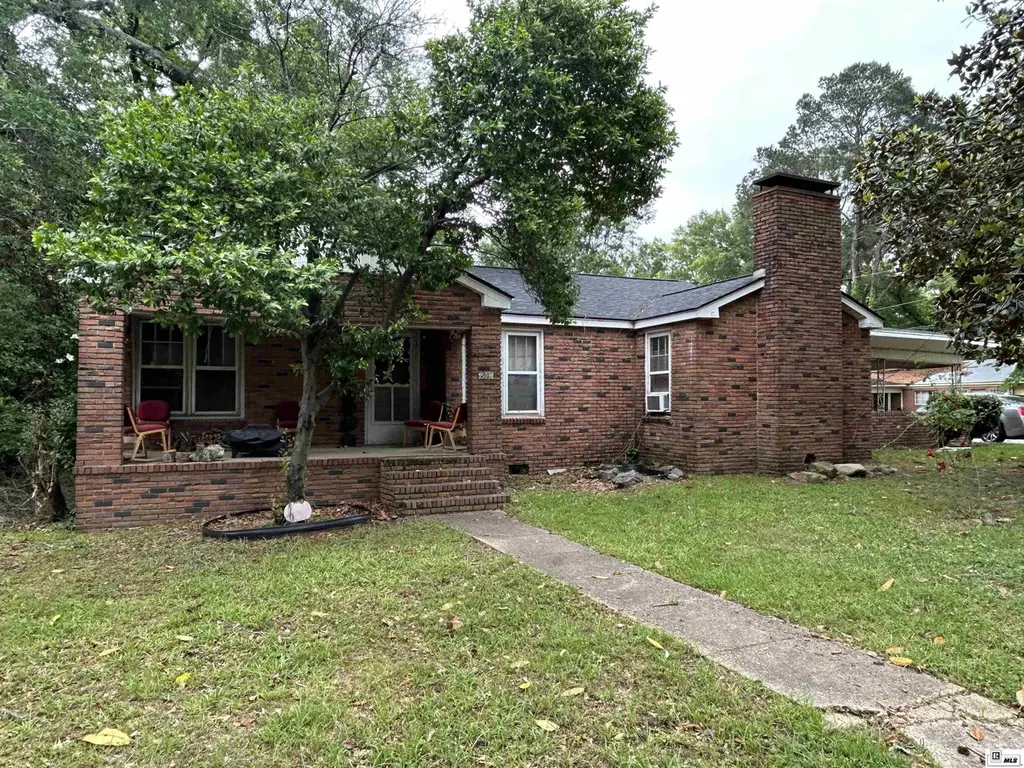
503 S Farmerville St · Ruston, LA
Flood risk No data
- FEMA flood zone
- —
- Chance of flooding over 30 yrs
- —
- Est. flood insurance / yr
- —
Fire risk No data
- Est. fire insurance / yr
- —
Heat risk No data
- Hot days now (above threshold)
- —
- Hot days in 30 yrs
- —
Wind risk No data
- Chance of severe wind over 30 yrs
- —
Air-quality risk No data
- Unhealthy air days now
- —
- Unhealthy air days in 30 yrs
- —
Risk factors via First Street. Map © Google.
Why this score? — see what drove the B grade
The composite is a weighted blend of 9 inputs, each scored 0–100. Each bar is that input's sub-score; the figure is the points it added to the 100-point composite (weight × sub-score).
- Cash flow +30.0/30.0
- 1% rule +10.0/10.0
- DSCR +10.0/10.0
- ARV discount +7.5/15.0
- Rent growth +4.2/5.0
- Livability +3.4/5.0
- Schools +3.3/10.0
- Condition / age +2.5/5.0
- Appreciation +0.0/10.0
$73,000
🖨 Deal sheet 📄 Offer letter ✓ Due diligence
Listing remarks
Charming 2-bedroom, 1-bath home offering comfort, simplicity, and great potential. This property features a functional layout with inviting living spaces throughout. Perfect for first-time homebuyers, downsizers, or investors looking for a solid opportunity.
Key facts
- 2 garage spots
- Listed 53 days
Property features AI
Finance
- Other: Directions: From Hwy 167 downtown Ruston, turn on Mississippi east, right on Farmerville Street, go over the bridge; the house is on the left
- HOA & community: No association amenities
Exterior
- Parking: Garage with 2 parking spaces
- Utilities: Public water; Public sewer
- Home design: Single-family residence (site-built); One level / single-story; Entry level: 1
- Construction: Brick veneer construction; Pillar/post/pier foundation
- Exterior features: Covered patio/porch; Irregular-shaped lot; Asphalt roof
Interior
- Kitchen: No appliances reported
- Bedrooms: 2 bedrooms on the main level
- Bathrooms: 1 full bathroom
- Heating & cooling: Central heating; Central air conditioning
- Interior features: No built-in appliances reported; No fireplace
Neighborhood map
What this means for you Summary
Snapshot
- This is a 2-bed/1.0-bath single-family listed at $73k.
Deal economics
- At list price, monthly cash flow is $581 ($7k/yr) — positive.
- The deal already cash-flows at list — no discount required.
- Meets the 1% rule at list price ($1k rent vs $73k).
- Recommended offer: $71k (3.0% below list) — sets the bar for market timing.
- Cap rate 15.8% vs local median 3.2% in Ruston — top-decile yield for the area; either an underpriced asset or a hidden risk that comps aren't pricing in. Stress-test before assuming the spread holds.
Location & tenants
- Location reads 68/100 on livability (#86 in LA) — a middle-class / working-renter tenant base. Strengths: cost of living A+, health & safety A+; Watch: amenities C-, crime F, commute F.
- Lincoln Parish (town): math 35% / reading 45% proficiency, ranked #24 of 98 in LA (top 24%) — families likely to look elsewhere, expect single-tenant / working-renter base with shorter leases; 62% free/reduced lunch — lower-income household profile, screen leases tightly.
- Market conditions: Rents rising fast (+6.6%/yr); 276 active listings in the ZIP; 2 comparable units currently listed for rent nearby; lower-income renter base — watch delinquency; 171 units permitted in Lincoln Parish in 2024 (0 in 5+ unit buildings).
- This rent runs 44% of the median local income ($37k/yr) — at the standard rent-burdened threshold; future hikes will face affordability resistance.
Forward outlook
- Local home prices are declining (-3.0%/yr); year-one equity from $505 of loan paydown is wiped out by about $2k of value loss. Plan a longer hold.
- Lincoln County population projected at +15% by 2050 — long-run rental-demand tailwind backs the buy-and-hold thesis.
- At projected returns (-3.0% appreciation + 6.6% rent growth), your $20k cash investment doubles in ~4 years — after that, you're playing with house money.
Negotiation context
- It's been on market 54 days — a 3% lower offer ($71k) is reasonable based on typical stale-listing flexibility.
Questions for the listing agent
- It's been on market 54 days. Have you received any prior offers? Is the seller open to a 3% concession, seller financing, or rate buy-down credit?
- Is there a deadline driving the sale (1031 exchange, divorce, estate, relocation)? That informs how much negotiation room exists.
- Schools are B-rated — typically a magnet for longer-tenancy family renters. What's the average tenant stay here, and is there a school-zone premium baked into asking?
- Crime grade is F in this area — have there been break-ins, vandalism, or insurance claims at this property in the last 3 years? What carrier currently insures it and at what premium?
- What's the average days-on-market for RENTAL listings here right now (not sales)? A rising rental-DOM trend means longer vacancies and softer asking-rent achievability than the comps imply.
- What's the recent tenant-quality profile in this submarket — average credit score on applications, eviction rate, late-payment / NSF rate, and stable-employment percentage? A property-management company in the area should have these aggregated.
- How much new for-sale + rental construction is in the pipeline within 1–3 miles? Heavy new supply typically softens prices + rents 12–24 months out; constrained supply supports both.
Investment metrics
- 1% rule
- 1.85% ✓
- Cap rate
- 15.84%
- Cash-on-cash
- 34.11%
- DSCR
- 2.52
- GRM
- 4.5
CMA / ARV
- ARV (median comp)
- $174,659
- List price
- $73,000
- Delta
- -58.20%
- Verdict
- UNDERPRICED
- Comps
- 20 within 1.0 mi
Show comp detail 4 sales within ~0.75 mi
| Address | Dist | Beds/Ba | Sqft | Sold | Price | $/sf | Match |
|---|---|---|---|---|---|---|---|
| 806 Eastland Ave | 0.27mi | 3/2.0 (+1) | 1,762 (-2%) | 9mo | $92,500 | $52 | 67 |
| 1203 Kenwood Dr | 0.73mi | 3/1.0 (+1) | 1,762 (-2%) | 2mo | $171,000 | $97 | 55 |
| 406 S Sparta St | 0.32mi | 2/2.0 | 1,579 (-12%) | 7mo | $179,000 | $113 | 55 |
| 201 N Farmerville St | 0.44mi | 2/1.0 | 1,632 (-10%) | 16mo | $130,000 | $80 | 50 |
Match score weights: distance 35% · size 25% · config 20% · recency 20%. Top-matched comps best support the ARV.
Projected returns pro-forma
-3.0% appreciation · 6.6% rent growth · sell at horizon
- IRR
- 33.5%
- Equity multiple
- 2.48×
- Total profit
- $30,259
- Equity at exit
- $10,885
- IRR
- 42.3%
- Equity multiple
- 5.72×
- Total profit
- $96,453
- Equity at exit
- $6,312
Cash invested: $20,440 (down + closing). Projections, not guarantees.
Landlord ↔ Tenant lean methodology
- Overall (STATE)
- 90 Strongly Landlord-Friendly
- State Louisiana
- 90 Strongly Landlord-Friendly · R+12
- County
- — inherits STATE
- City
- — inherits STATE
ZIP-level market 71270
- Home prices YoY
- -16.1%
- Rents YoY
- 6.6%
- Active inventory
- 276
- Price-to-rent
- 4.5×
Monthly cashflow live
- Estimated rent
- $1,351 medium interval (Pro) →
- Mortgage (P&I)
- −$383
- Tax from tax record
- −$73 /mo · $879/yr
- Insurance
- −$30
- HOA
- −$0
- Vacancy / Maint / Mgmt
- −$284
- Net cashflow
- $581
Break-even live
UW: 25.0% down · 7.5% · 30yr · 1.5% tax · 5.0% vac · 8.0% maint · 8.0% mgmt
Financing live
Cash to close
- Down payment
- $18,250
- Closing costs
- $2,190
- Reserves months
- —
- Total cash needed
- —
Loan-product check · same deal, 3 products live
Conventional
25% down · 7.5% · 30yr
- Down + closing
- —
- Monthly P&I
- —
- Monthly cashflow
- —
- DSCR
- —
- Eligible?
- —
Personal DTI + credit; lowest rate.
DSCR
20% down · 8.5% · 30yr
- Down + closing
- —
- Monthly P&I
- —
- Monthly cashflow
- —
- DSCR
- —
- Eligible?
- —
No personal income docs; deal must DSCR.
Hard money
10% down · 12.0% · 12mo
- Down + closing
- —
- Monthly P&I
- —
- Monthly cashflow
- —
- DSCR
- —
- Eligible?
- —
Short-term bridge; refi at stabilization.
Rent comps 2 comps
| Address | Beds | Baths | Sqft | Rent | $/sqft | DOM | Units | Dist |
|---|---|---|---|---|---|---|---|---|
| 511 S Monroe St Ruston, LA | 2.0 | 1.0 | 1237 | $1,200 | $0.97 | 43d | 1 | 0.58mi |
| 209 Goode Ave Ruston, LA | 3.0 | 2.0 | 1600 | $2,100 | $1.31 | 43d | 1 | 1.06mi |
Listing history 18 events
-
2026-06-19days on market $73,000 Active 54 DOM
-
2026-06-18days on market $73,000 Active 53 DOM
-
2026-06-17days on market $73,000 Active 52 DOM
-
2026-06-16days on market $73,000 Active 51 DOM
-
2026-06-15days on market $73,000 Active 50 DOM
-
2026-06-14days on market $73,000 Active 48 DOM
-
2026-06-12pricedays on market $73,000 Active 47 DOM
-
2026-06-09days on market $78,000 Active 44 DOM
-
2026-06-08days on market $78,000 Active 43 DOM
-
2026-06-07days on market $78,000 Active 42 DOM
-
2026-06-05days on market $78,000 Active 39 DOM
-
2026-06-03days on market $78,000 Active 38 DOM
-
2026-06-02days on market $78,000 Active 37 DOM
-
2026-06-01days on market $78,000 Active 36 DOM
-
2026-05-31days on market $78,000 Active 35 DOM
-
2026-05-30days on market $78,000 Active 34 DOM
-
2026-04-24$78,000 Active 258-char remark
-
2001-03-05soldstatus $84,000
ⓘ Source: listings_history table (triggers on properties + properties_extension) + one-shot
backfill from property_details.listing_events for pre-trigger history.
Tax reassessment forecast LA · Resets to sale price
- Current annual tax
- $879 · $73/mo
- Projected year-2 tax
- $879 · $73/mo
- Expected delta
- $0/yr ($0/mo · 0.0%)
ⓘ Screening estimate from a state-policy table — verify with the county assessor before closing.
Nearby sold comps map
Loading sold comps map…
Walkable amenities ~0.75 mi
Loading nearby amenities…
Taxation est. · year 1
- Rental income
- $16,216
- − Mortgage interest
- −$4,089
- − Property taxes
- −$879
- − Insurance
- −$365
- − Repairs & maintenance
- −$1,297
- − Management
- −$1,297
- − Depreciation
- −$2,124
- Taxable income
- $6,164
- Est. tax owed @ 24.0%
- −$1,479
- After-tax cash flow
- $5,493/yr
For passive investors: Depreciation is non-cash, so a rental often shows a tax loss while cash-flowing — sheltering income. Rental losses are passive: they offset passive income freely, and up to $25,000/yr can offset ordinary (W-2) income if you actively participate and your MAGI is under $100k (phasing out to $0 by $150k); unused losses carry forward. On sale, claimed depreciation is recaptured at up to 25%, and gains may owe capital-gains tax (a 1031 exchange can defer both). Figures are a year-1 estimate at your 24.0% rate — not tax advice; consult a CPA.
Schools (NCES district)
- District
- Lincoln Parish
- NCES district ID
- 2200990
- Math proficiency
- 35% ▼ -32.00%
- Reading proficiency
- 45% ▼ -27.00%
- Median HH income
- $33,901
- Composite
- 32.92/100
- National rank
- #5599
- State rank
- #24 of 98 in LA
Livability — Ruston
- Score
- 68/100
- State rank
- #86
- US rank
- #9522
Category grades
Schools grade is shown separately in the Schools card above.
Census & demographics
- Census place
- Ruston, LA
- County
- Lincoln Parish · 32,885 people
- City population
- 32,885
- Metro
- Ruston, LA
- Population (ZIP)
- 32,885
- Household income
- $36,791
- Rent vs Own
- Severe rent burden
- 2476.0
Population outlook (Lincoln County) Hauer SSP2
- Today (2025)
- 49,595 people
- By 2030
- 50,954 · +2.7%
- By 2040
- 53,601 · +8.1%
- By 2050
- 57,178 · +15.3%
- By 2075
- 69,580 · +40.3%
- By 2100
- 79,862 · +61.0%
Race, ethnicity, and origin ACS 2023
- Neighborhood character
- Diverse neighborhood (Simpson 0.60)
- Race & ethnicity
- White 51% Black 38% Two or more races 6% Hispanic / Latino 4% Asian 2% Native American 1%
- Common ancestry
- Lithuanian 4% Slovak 2% Serbian 1%
- Foreign-born
- 3% · Canada, Vietnam
- Languages at home
- 95% English-only · Spanish 2% Other Indo-European 1% Arabic 1%
Political lean MEDSL · Lincoln
- 2024 margin
- Strong R (+25.4) · D 36.5% · R 62.0% · Other 1.6%
- 2008→2024 swing
- -13.0pp toward R · 2008: -12.5pp · 2024: -25.4pp
- All cycles
- 2024: R+25.4 2020: R+19.5 2016: R+19.6 2012: R+14.7 2008: R+12.5
Not yet ingested
- Civics
- —
Market trends
- HPI YoY
- ▼ -40.69%
- Current HPI
- 212.8211
- Rent YoY
- ▲ 6.60%
- Metro
- Ruston, LA
- State GDP YoY
- ▲ 3.29%
- F500 in state
- 10
Industry mix (Fortune 500 HQ in LA)
| Industry | F500 HQs | Revenue |
|---|---|---|
| Telecommunications | 2 | $23B |
|
||
| Utilities | 1 | $12B |
|
||
| Wholesale / Distribution | 1 | $5B |
|
||
| Advertising | 1 | $2B |
|
||
Price history
-13.1% since first listed3 events — show timeline
- 2026-06-09 Price Changed $73,000 NELABOR
- 2026-04-24 Listed $78,000 NELABOR
- 2001-03-05 Sold (Public Records) $84,000 Public Records
Property tax history
+3.8%/yrLatest (2025): $879 · -0.0% YoY. Source: county tax records.
Cash-flow waterfall
monthlySold comps — $/sqft
last 12 mo · ≤1 miLoading sold comps…