 Triplex
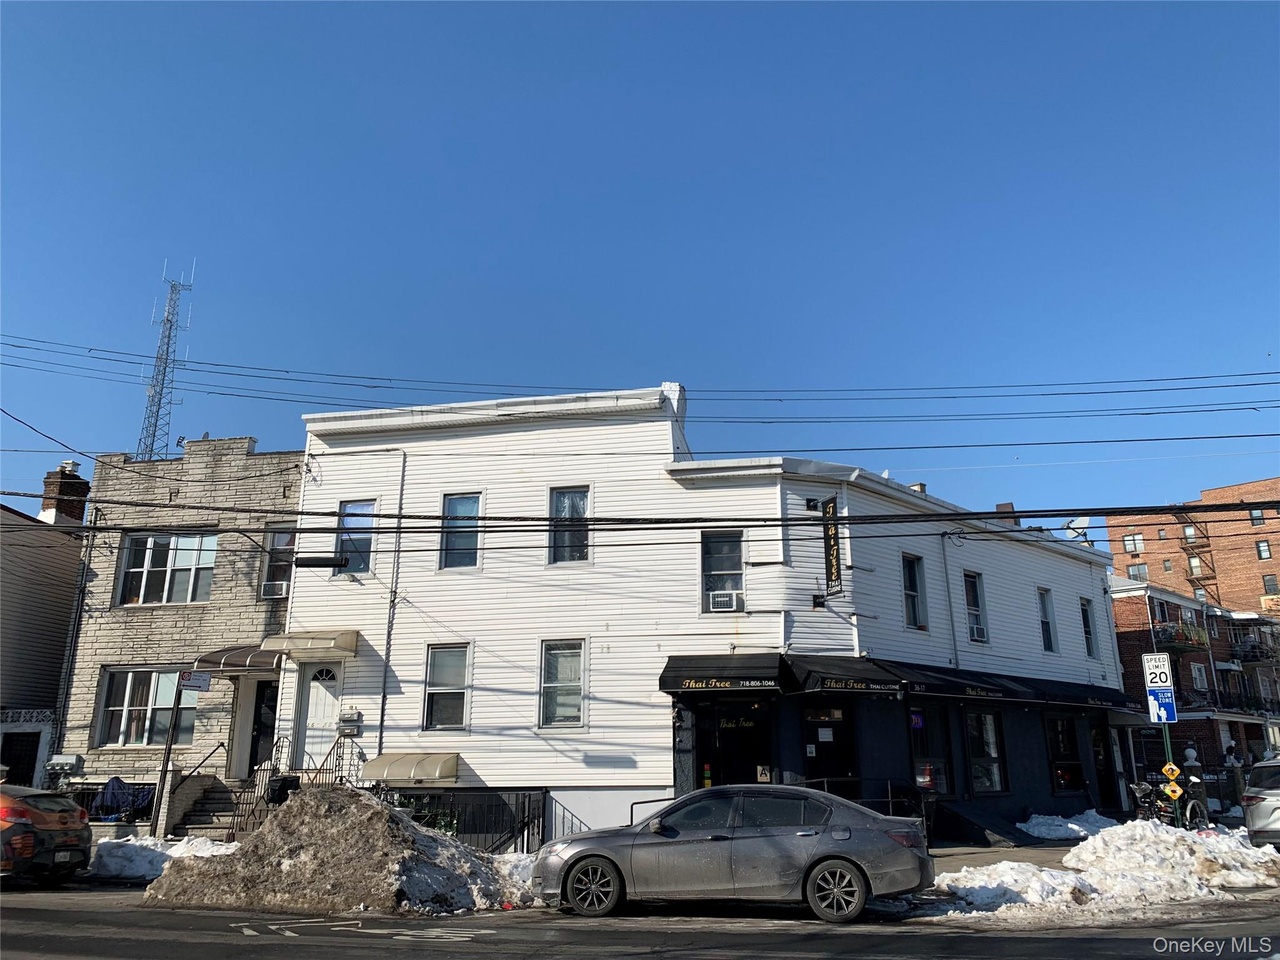
3617 Greenpoint Ave · New York, NY
Flood risk No data
- FEMA flood zone
- —
- Chance of flooding over 30 yrs
- —
- Est. flood insurance / yr
- —
Fire risk No data
- Est. fire insurance / yr
- —
Heat risk No data
- Hot days now (above threshold)
- —
- Hot days in 30 yrs
- —
Wind risk No data
- Chance of severe wind over 30 yrs
- —
Air-quality risk No data
- Unhealthy air days now
- —
- Unhealthy air days in 30 yrs
- —
Risk factors via First Street. Map © Google.
Why this score? — see what drove the D grade
The composite is a weighted blend of 9 inputs, each scored 0–100. Each bar is that input's sub-score; the figure is the points it added to the 100-point composite (weight × sub-score).
- Cash flow +14.6/30.0
- Appreciation +7.8/10.0
- Schools +5.0/10.0
- DSCR +4.4/10.0
- 1% rule +4.0/10.0
- Livability +3.8/5.0
- Rent growth +2.8/5.0
- Condition / age +2.5/5.0
- ARV discount +0.0/15.0
$1,800,000
🖨 Deal sheet (PDF) 📄 Offer letter ✓ Due diligence
Multi-family units
County records classify this as Multi-Family (2-4 Unit). Listing-text estimate: 3 units. confirmed
Listing remarks
Large 3 family house with attached Storefront. All free market rent with plenty of upside. All electrical updated Steps from LIRR Station
Key facts
- Attached storefront
- Electrical updated
- 1,461 sq ft lot
Tags
Property features AI
Exterior
- Parking: No carport; No designated parking
- Utilities: Public sewer; Electricity available
- Home design: Triplex
- Construction: Frame construction
- Exterior features: Frame construction; Not waterfront
Interior
- Bedrooms: Includes a bedroom on the first floor
- Heating & cooling: Baseboard heating; Wall/window air conditioning units
- Interior features: First-floor bedroom; Basement with common access
Neighborhood map
What this means for you Summary
Snapshot
- This is a 3 × 2-bed/?-bath units multifamily listed at $1.80M.
Deal economics
- At list price, monthly cash flow is $413 ($5k/yr) — positive. Per door: $138/mo.
- The deal already cash-flows at list — no discount required.
- To meet the 1% rule (rent ≥ 1% of price), the offer needs to be $1.63M (9.6% below list).
- Recommended offer: $1.63M (9.6% below list) — sets the bar for 1% rule.
- Cap rate 6.6% vs local median 2.6% in New York — top-decile yield for the area; either an underpriced asset or a hidden risk that comps aren't pricing in. Stress-test before assuming the spread holds.
Location & tenants
- Location reads 75/100 on livability (#268 in NY, #4,188 nationally) — a middle-class / working-renter tenant base. Strengths: amenities A+, commute A+, health & safety A; Watch: crime F, cost of living F.
- Zoned schools: Elm Tree Elementary School (math 27% / reading 52%, grade F, #1,444 of 2,108 statewide, top 71%, 806 students, 94% FRL); Is 227 Louis Armstrong (math 52% / reading 69%, grade B+, #153 of 729 statewide, top 21%, 1,528 students, 68% FRL); Midwood High School (math 94% / reading 96%, grade A+, #83 of 1,100 statewide, top 8%, 4,062 students, 73% FRL).
- Market conditions: Rents rising (+1.1%/yr); 259 active listings in the ZIP; high-income renter base; 5,302 units permitted in Queens County in 2024 (4,918 in 5+ unit buildings).
- At $16,269/mo this rent would consume 161% of the median local household income ($121k/yr) (locally 3440% of renters already pay >50% of income on rent) — very limited rent-growth headroom before tenants either downsize or default.
Forward outlook
- In year one you build about $114k of equity ($12k loan paydown + $101k appreciation (5.6% local appreciation)).
- Queens County population projected at +16% by 2050 — long-run rental-demand tailwind backs the buy-and-hold thesis.
- At projected returns (5.6% appreciation + 1.1% rent growth), your $504k cash investment doubles in ~4 years — after that, you're playing with house money.
- By year 2, paydown + projected appreciation supports a ~$182k cash-out refi (75% LTV) — recoverable capital for the next deal without selling this one.
Negotiation context
- It's been on market 119 days — a 9% lower offer ($1.64M) is reasonable based on typical stale-listing flexibility.
- 2 sale attempts with the ask held roughly flat each time — persistent listings suggest the price (not the market) is what's stuck; bring a comps-based counter.
Risks & watch-outs
- Watch-outs: built in 1931 — expect roof / HVAC / electrical / plumbing capex.
Questions for the listing agent
- It's been on market 119 days. Have you received any prior offers? Is the seller open to a 10% concession, seller financing, or rate buy-down credit?
- Can we see the unit-by-unit rent roll, current vacancy, and any below-market leases? What's the average tenancy length?
- What capital expenditures (roof, boiler, parking lot, exteriors) have been made in the last 5 years, and what's planned in the next 2?
- Built in 1931 — when were the roof, HVAC, electrical panel, plumbing, and water heater last replaced?
- Why hasn't it sold? Are there any deal-killer items the seller is aware of (foundation, flood, title, zoning, code violations)?
- Is there a deadline driving the sale (1031 exchange, divorce, estate, relocation)? That informs how much negotiation room exists.
- Schools are B-rated — typically a magnet for longer-tenancy family renters. What's the average tenant stay here, and is there a school-zone premium baked into asking?
- Crime grade is F in this area — have there been break-ins, vandalism, or insurance claims at this property in the last 3 years? What carrier currently insures it and at what premium?
- The area grade is low — what's the realistic commute time and amenity access for the typical tenant pool here? Any planned neighborhood developments (good or bad) we should know about?
- What's the average days-on-market for RENTAL listings here right now (not sales)? A rising rental-DOM trend means longer vacancies and softer asking-rent achievability than the comps imply.
- What's the recent tenant-quality profile in this submarket — average credit score on applications, eviction rate, late-payment / NSF rate, and stable-employment percentage? A property-management company in the area should have these aggregated.
- How much new apartment / multifamily construction is in the pipeline within 1–3 miles? Heavy new supply (>2% of stock underway) typically softens rents 12–24 months out; light construction supports rent growth.
Investment metrics
- 1% rule
- 0.90% ✗
- Cap rate
- 6.57%
- Cash-on-cash
- 0.98%
- DSCR
- 1.04
- GRM
- 9.2
CMA / ARV
- ARV (on-the-fly)
- $1,366,400
- Comps found
- 1
Show comp detail 1 sale within ~0.75 mi
| Address | Dist | Beds/Ba | Sqft | Sold | Price | $/sf | Match |
|---|---|---|---|---|---|---|---|
| 4858 38th St | 0.07mi | 6/2.0 | 3,300 (+3%) | 23mo | $1,410,000 | $427 | 72 |
Match score weights: distance 35% · size 25% · config 20% · recency 20%. Top-matched comps best support the ARV.
Projected returns pro-forma
5.62% appreciation · 1.09% rent growth · sell at horizon
- IRR
- 14.4%
- Equity multiple
- 1.94×
- Total profit
- $474,737
- Equity at exit
- $1,088,110
- IRR
- 14.2%
- Equity multiple
- 3.64×
- Total profit
- $1,330,417
- Equity at exit
- $1,936,784
Cash invested: $504,000 (down + closing). Projections, not guarantees.
Landlord ↔ Tenant lean methodology
- Overall (CITY)
- 0 Strongly Tenant-Friendly
- State New York
- 15 Strongly Tenant-Friendly · D+10
- County
- — inherits STATE
- City New York
- 0 Strongly Tenant-Friendly · D+34
ZIP-level market 11101
- Home prices YoY
- 1.1%
- Rents YoY
- 1.1%
- Active inventory
- 259
- Price-to-rent
- 27.7×
Monthly cashflow live
- Estimated rent
- $16,269 high interval (Pro) →
- Mortgage (P&I)
- −$9,439
- Tax est. 1.5%
- −$2,250 /mo · $27,000/yr
- Insurance
- −$750
- HOA
- −$0
- Vacancy / Maint / Mgmt
- −$3,416
- Net cashflow
- $413
Break-even live
Sensitivity live
| Price | -10% $1,657 | -5% $1,035 | +0% $413 | +5% $-209 | +10% $-831 |
|---|---|---|---|---|---|
| Rent | -10% $-872 | -5% $-230 | +0% $413 | +5% $1,056 | +10% $1,698 |
| Rate | -1.0pp $1,320 | -0.5pp $871 | base $413 | +0.5pp $-53 | +1.0pp $-528 |
3-unit breakdown (identical units grouped — click to expand)
| Units | Beds | Baths | Est. rent |
|---|---|---|---|
| 3× units | 2 | — | $16,269 |
| #1 | 2 | — | $5,423 |
| #2 | 2 | — | $5,423 |
| #3 | 2 | — | $5,423 |
| Total (3 units) | $16,269 | ||
UW: 25.0% down · 7.5% · 30yr · 1.5% tax · 5.0% vac · 8.0% maint · 8.0% mgmt
Financing live
Cash to close
- Down payment
- $450,000
- Closing costs
- $54,000
- Reserves months
- —
- Total cash needed
- —
Loan-product check · same deal, 3 products live
Conventional
25% down · 7.5% · 30yr
- Down + closing
- —
- Monthly P&I
- —
- Monthly cashflow
- —
- DSCR
- —
- Eligible?
- —
Personal DTI + credit; lowest rate.
DSCR
20% down · 8.5% · 30yr
- Down + closing
- —
- Monthly P&I
- —
- Monthly cashflow
- —
- DSCR
- —
- Eligible?
- —
No personal income docs; deal must DSCR.
Hard money
10% down · 12.0% · 12mo
- Down + closing
- —
- Monthly P&I
- —
- Monthly cashflow
- —
- DSCR
- —
- Eligible?
- —
Short-term bridge; refi at stabilization.
Listing history 7 events
-
2026-06-03days on market $1,800,000 Active 119 DOM
-
2026-06-01days on market $1,800,000 Active 117 DOM
-
2026-05-31days on market $1,800,000 Active 116 DOM
-
2026-02-04$1,800,000 Active
-
2026-02-01historical
-
2025-12-04price $1,790,000
-
2025-10-30$1,890,000 Active
ⓘ Source: listings_history table (triggers on properties + properties_extension) + one-shot
backfill from property_details.listing_events for pre-trigger history.
Nearby sold comps map
Loading sold comps map…
Walkable amenities ~0.75 mi
Loading nearby amenities…
Taxation est. · year 1
- Rental income
- $195,228
- − Mortgage interest
- −$100,828
- − Property taxes
- −$27,000
- − Insurance
- −$9,000
- − Repairs & maintenance
- −$15,618
- − Management
- −$15,618
- − Depreciation
- −$52,364
- Taxable loss
- −$25,200
- Est. tax savings @ 24.0%
- +$6,048
- After-tax cash flow
- $11,005/yr
For passive investors: Depreciation is non-cash, so a rental often shows a tax loss while cash-flowing — sheltering income. Rental losses are passive: they offset passive income freely, and up to $25,000/yr can offset ordinary (W-2) income if you actively participate and your MAGI is under $100k (phasing out to $0 by $150k); unused losses carry forward. On sale, claimed depreciation is recaptured at up to 25%, and gains may owe capital-gains tax (a 1031 exchange can defer both). Figures are a year-1 estimate at your 24.0% rate — not tax advice; consult a CPA.
Schools (NCES district)
No district data.
Livability — New York
- Score
- 75/100
- State rank
- #268
- US rank
- #4188
Category grades
Schools grade is shown separately in the Schools card above.
Census & demographics
- Census place
- New York, NY
- County
- Queens County · 1,914,869 people
- City population
- 7,731,280
- Metro
- New York-Newark-Jersey City, NY-NJ-PA
- Population (ZIP)
- 42,219
- Household income
- $121,062
- Rent vs Own
- Severe rent burden
- 3440.0
Population outlook (Queens County) Hauer SSP2
- Today (2025)
- 2,546,320 people
- By 2030
- 2,643,059 · +3.8%
- By 2040
- 2,815,563 · +10.6%
- By 2050
- 2,944,423 · +15.6%
- By 2075
- 3,123,338 · +22.7%
- By 2100
- 3,098,688 · +21.7%
Race, ethnicity, and origin ACS 2023
- Neighborhood character
- Highly diverse neighborhood (Simpson 0.74)
- Race & ethnicity
- White 34% Asian 31% Hispanic / Latino 19% Two or more races 11% Black 10%
- Hispanic origin (detail)
- Mexican 5% Puerto Rican 3% Dominican 2%
- Common ancestry
- Romanian 2% Lithuanian 1% Scotch-Irish 1%
- Foreign-born
- 41% · Canada, China, South Korea
- Languages at home
- 52% English-only · Spanish 15% Other Indo-European 11% Chinese 10%
Political lean MEDSL · Queens
- 2024 margin
- Strong D (+24.6) · D 62.3% · R 37.7%
- 2008→2024 swing
- -26.2pp toward R · 2008: 50.8pp · 2024: 24.6pp
- All cycles
- 2024: D+24.6 2020: D+45.2 2016: D+53.4 2012: D+58.5 2008: D+50.8
Not yet ingested
- Civics
- —
Market trends
- HPI YoY
- ▲ 5.62%
- Current HPI
- 500.0296
- Rent YoY
- ▲ 1.09%
- Metro
- New York-Newark-Jersey City, NY-NJ-PA
- State GDP YoY
- ▲ 2.60%
- F500 in state
- 92
Industry mix (Fortune 500 HQ in NY)
| Industry | F500 HQs | Revenue |
|---|---|---|
| Financial Services | 10 | $950B |
|
||
| Consumer Goods | 9 | $162B |
|
||
| Insurance | 4 | $225B |
|
||
| Telecommunications | 2 | $144B |
|
||
| Pharmaceuticals | 2 | $112B |
|
||
| Media / Entertainment | 2 | $69B |
|
||
Price history
-4.8% since first listed4 events — show timeline
- 2026-02-04 Listed $1,800,000 OneKey® MLS as Distributed by MLS Grid
- 2026-02-01 Listing Removed — OneKey® MLS as Distributed by MLS Grid
- 2025-12-04 Price Changed $1,790,000 OneKey® MLS as Distributed by MLS Grid
- 2025-10-30 Listed $1,890,000 OneKey® MLS as Distributed by MLS Grid
Cash-flow waterfall
monthlySold comps — $/sqft
last 12 mo · ≤1 miLoading sold comps…