234 Fire Box Dr · Felton, DE
Flood risk 1/10 · Minimal
- FEMA flood zone
- X (unshaded)
- Chance of flooding over 30 yrs
- 0.0%
- Est. flood insurance / yr
- $507 – $1,088
Fire risk 1/10 · Minimal
- Est. fire insurance / yr
- $476 – $884
Heat risk 8/10 · Major
- Hot days now (above 102°F)
- 7 days/yr
- Hot days in 30 yrs
- 16 days/yr
Wind risk 6/10 · Moderate
- Chance of severe wind over 30 yrs
- 74.0%
Air-quality risk 2/10 · Minimal
- Unhealthy air days now
- 1 days/yr
- Unhealthy air days in 30 yrs
- 2 days/yr
Risk factors via First Street. Map © Google.
Why this score? — see what drove the D+ grade
The composite is a weighted blend of 9 inputs, each scored 0–100. Each bar is that input's sub-score; the figure is the points it added to the 100-point composite (weight × sub-score).
- ARV discount +15.0/15.0
- Cash flow +14.1/30.0
- DSCR +4.3/10.0
- Livability +3.6/5.0
- 1% rule +3.0/10.0
- Schools +3.0/10.0
- Rent growth +2.5/5.0
- Condition / age +2.5/5.0
- Appreciation +0.0/10.0
$299,900
🖨 Deal sheet (PDF) 📄 Offer letter ✓ Due diligence
Listing remarks
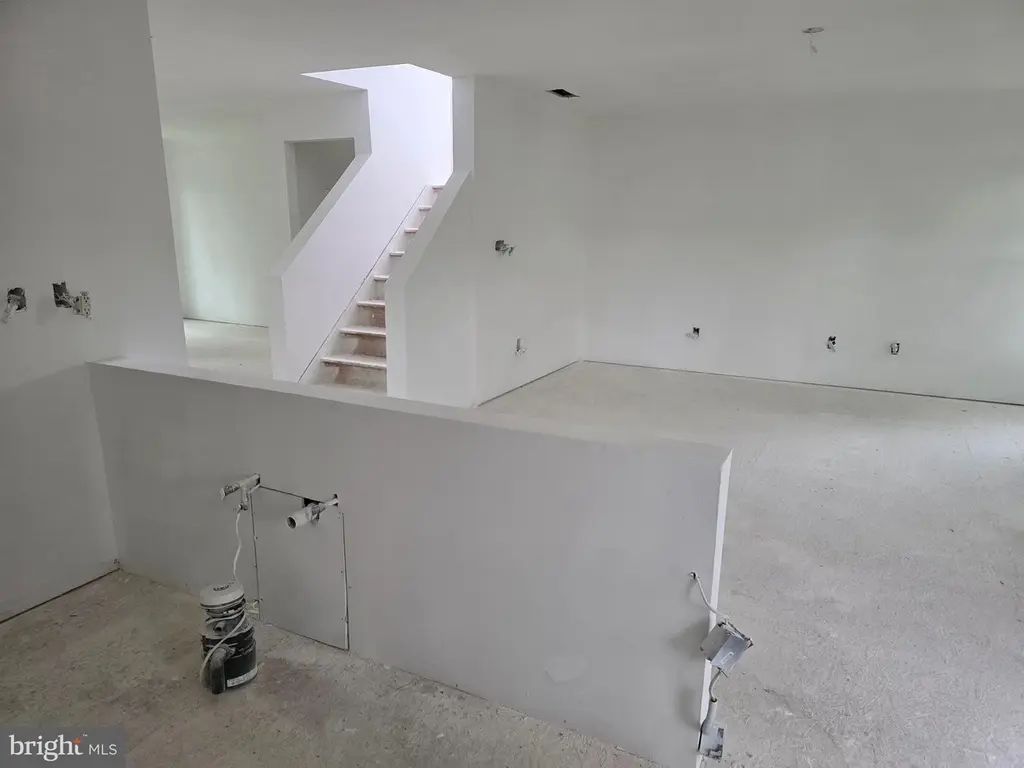
Investors Alert! This 4 bed 2.5 bath contemporary style home is ready to be completed with your personal finishing touches. The property is being sold in "as is" condition.
Key facts
- 0.26 acre lot
- 2 garage spots
- Built 2004
Property features AI
Finance
- HOA & community: HOA fee $267 annually
Exterior
- Parking: Attached front-entry garage with 2 garage spaces
- Utilities: Public water; Public septic; Natural gas hot water; Natural gas heating
- Home design: Detached single-family home; Vinyl siding exterior
- Construction: Built year reported by assessor; Crawl space foundation
- Exterior features: Lot dimensions approximately 95.69 x 131.91; Not in a federal flood zone; Tidal water: none
Interior
- Bedrooms: Four bedrooms on the upper level
- Bathrooms: Two full bathrooms on upper level; One half bathroom on main level
- Heating & cooling: Forced air heating; Central air conditioning
- Interior features: No basement; Finished living area reported by assessor
Neighborhood map
What this means for you Summary
Snapshot
- This is a 3-bed/2.5-bath single-family listed at $300k.
Deal economics
- At list price, monthly cash flow is $42 ($502/yr) — positive.
- The deal already cash-flows at list — no discount required.
- To meet the 1% rule (rent ≥ 1% of price), the offer needs to be $240k (20.0% below list).
- Recommended offer: $240k (20.0% below list) — sets the bar for 1% rule.
- Cap rate 6.5% vs local median 4.3% in Felton — top-decile yield for the area; either an underpriced asset or a hidden risk that comps aren't pricing in. Stress-test before assuming the spread holds.
Location & tenants
- Location reads 72/100 on livability (#18 in DE) — a middle-class / working-renter tenant base. Strengths: cost of living A+, housing A+, health & safety A+; Watch: amenities F, commute F.
- Lake Forest School District (rural): math 26% / reading 44% proficiency, ranked #13 of 26 in DE (top 50%) — families likely to look elsewhere, expect single-tenant / working-renter base with shorter leases.
- Zoned schools: Lake Forest North Elementary School (math 37% / reading 47%, grade F, #21 of 105 statewide, top 21%, 452 students, 0% FRL); Chipman (W.T.) Middle School (math 24% / reading 45%, grade F, #12 of 36 statewide, top 34%, 965 students, 0% FRL); Lake Forest High School (math 27% / reading 47%, grade F, #16 of 40 statewide, top 38%, 870 students, 0% FRL) — zoned schools average 0% FRL vs 47% district-wide (47 pts lower); this property's tenant base skews higher-income than the district average.
- Market conditions: 136 active listings in the ZIP; 1 comparable units currently listed for rent nearby; 1,201 units permitted in Kent County in 2024 (116 in 5+ unit buildings).
Forward outlook
- Local home prices are declining (-3.0%/yr); year-one equity from $2k of loan paydown is wiped out by about $9k of value loss. Plan a longer hold.
- Kent County population projected at +22% by 2050 — long-run rental-demand tailwind backs the buy-and-hold thesis.
Negotiation context
- It's been on market 63 days — a 6% lower offer ($282k) is reasonable based on typical stale-listing flexibility.
Risks & watch-outs
- Climate carrying-cost: major wind risk, 74% chance of damaging wind over 30y; extreme-heat days projected 7→16/yr by 2055 (HVAC capex compounding) — expect insurance premiums to compound above CPI over the hold.
Questions for the listing agent
- It's been on market 63 days. Have you received any prior offers? Is the seller open to a 20% concession, seller financing, or rate buy-down credit?
- What does the HOA fee cover, when was the last increase, and are there any pending special assessments or reserve-fund shortfalls?
- Why hasn't it sold? Are there any deal-killer items the seller is aware of (foundation, flood, title, zoning, code violations)?
- Is there a deadline driving the sale (1031 exchange, divorce, estate, relocation)? That informs how much negotiation room exists.
- The area grade is low — what's the realistic commute time and amenity access for the typical tenant pool here? Any planned neighborhood developments (good or bad) we should know about?
- What's the average days-on-market for RENTAL listings here right now (not sales)? A rising rental-DOM trend means longer vacancies and softer asking-rent achievability than the comps imply.
- What's the recent tenant-quality profile in this submarket — average credit score on applications, eviction rate, late-payment / NSF rate, and stable-employment percentage? A property-management company in the area should have these aggregated.
- How much new for-sale + rental construction is in the pipeline within 1–3 miles? Heavy new supply typically softens prices + rents 12–24 months out; constrained supply supports both.
Investment metrics
- 1% rule
- 0.80% ✗
- Cap rate
- 6.46%
- Cash-on-cash
- 0.60%
- DSCR
- 1.03
- GRM
- 10.4
CMA / ARV
- ARV (median comp)
- $360,572
- List price
- $299,900
- Delta
- -16.83%
- Verdict
- UNDERPRICED
- Comps
- 20 within 1.0 mi
Show comp detail 12 sales within ~0.75 mi
| Address | Dist | Beds/Ba | Sqft | Sold | Price | $/sf | Match |
|---|---|---|---|---|---|---|---|
| 107 Albert Pl | 0.21mi | 4/2.5 (+1) | 2,078 (+6%) | 5mo | $397,000 | $191 | 72 |
| 261 Andrews Lake Rd | 0.08mi | 3/2.0 | 1,674 (-15%) | 1mo | $255,000 | $152 | 69 |
| 158 N Ember Dr | 0.20mi | 3/2.0 | 1,827 (-7%) | 13mo | $370,000 | $203 | 66 |
| 125 E Chimney Top Ln | 0.11mi | 4/2.5 (+1) | 2,184 (+11%) | 8mo | $380,400 | $174 | 65 |
| 114 Acorn Forest Dr | 0.62mi | 3/2.5 | 1,932 (-2%) | 8mo | $405,000 | $210 | 61 |
| 480 Andrews Lake Rd | 0.18mi | 4/3.0 (+1) | 2,128 (+8%) | 13mo | $352,500 | $166 | 60 |
| 573 N Erin Ave | 0.67mi | 4/2.5 (+1) | 1,944 (-1%) | 9mo | $395,000 | $203 | 54 |
| 163 Mayflower Dr | 0.69mi | 3/2.5 | 2,121 (+8%) | 1mo | $395,000 | $186 | 54 |
| 248 S Ember Dr | 0.28mi | 4/2.5 (+1) | 2,183 (+11%) | 12mo | $375,000 | $172 | 54 |
| 62 Winery Way | 0.51mi | 4/3.0 (+1) | 2,218 (+13%) | 1mo | $464,900 | $210 | 47 |
| 89 New England Dr | 0.69mi | 4/2.0 (+1) | 1,698 (-14%) | 18mo | $397,990 | $234 | 23 |
| 178 Plantation Dr | 0.70mi | 4/2.0 (+1) | 1,698 (-14%) | 18mo | $394,990 | $233 | 22 |
Match score weights: distance 35% · size 25% · config 20% · recency 20%. Top-matched comps best support the ARV.
Projected returns pro-forma
-3.0% appreciation · 3.0% rent growth · sell at horizon
- IRR
- -15.4%
- Equity multiple
- 0.45×
- Total profit
- $-46,032
- Equity at exit
- $44,716
- IRR
- -6.9%
- Equity multiple
- 0.56×
- Total profit
- $-37,053
- Equity at exit
- $25,930
Cash invested: $83,972 (down + closing). Projections, not guarantees.
Landlord ↔ Tenant lean methodology
- Overall (STATE)
- 70 Landlord-Friendly
- State Delaware
- 70 Landlord-Friendly · D+7
- County
- — inherits STATE
- City
- — inherits STATE
ZIP-level market 19943
- Home prices YoY
- -14.3%
- Active inventory
- 136
- Price-to-rent
- 10.4×
Monthly cashflow live
- Estimated rent
- $2,400 medium interval (Pro) →
- Mortgage (P&I)
- −$1,573
- Tax from tax record
- −$135 /mo · $1,614/yr
- Insurance
- −$125
- HOA
- −$22
- Vacancy / Maint / Mgmt
- −$504
- Net cashflow
- $42
Break-even live
Sensitivity live
| Price | -10% $212 | -5% $127 | +0% $42 | +5% $-43 | +10% $-128 |
|---|---|---|---|---|---|
| Rent | -10% $-148 | -5% $-53 | +0% $42 | +5% $137 | +10% $231 |
| Rate | -1.0pp $193 | -0.5pp $118 | base $42 | +0.5pp $-36 | +1.0pp $-115 |
UW: 25.0% down · 7.5% · 30yr · 1.5% tax · 5.0% vac · 8.0% maint · 8.0% mgmt
Financing live
Cash to close
- Down payment
- $74,975
- Closing costs
- $8,997
- Reserves months
- —
- Total cash needed
- —
Loan-product check · same deal, 3 products live
Conventional
25% down · 7.5% · 30yr
- Down + closing
- —
- Monthly P&I
- —
- Monthly cashflow
- —
- DSCR
- —
- Eligible?
- —
Personal DTI + credit; lowest rate.
DSCR
20% down · 8.5% · 30yr
- Down + closing
- —
- Monthly P&I
- —
- Monthly cashflow
- —
- DSCR
- —
- Eligible?
- —
No personal income docs; deal must DSCR.
Hard money
10% down · 12.0% · 12mo
- Down + closing
- —
- Monthly P&I
- —
- Monthly cashflow
- —
- DSCR
- —
- Eligible?
- —
Short-term bridge; refi at stabilization.
Rent comps 1 comps
| Address | Beds | Baths | Sqft | Rent | $/sqft | DOM | Units | Dist |
|---|---|---|---|---|---|---|---|---|
| 34 E Chimney Top Ln Felton, DE | 3.0 | 2.5 | 1586 | $2,400 | $1.51 | 45d | 1 | 0.17mi |
HOA detail
- Monthly dues
- $22 · $264/yr
Listing history 20 events
-
2026-06-21days on market $299,900 Active 63 DOM
-
2026-06-19days on market $299,900 Active 61 DOM
-
2026-06-18days on market $299,900 Active 60 DOM
-
2026-06-17days on market $299,900 Active 59 DOM
-
2026-06-16days on market $299,900 Active 58 DOM
-
2026-06-15days on market $299,900 Active 57 DOM
-
2026-06-14days on market $299,900 Active 55 DOM
-
2026-06-13days on market $299,900 Active 54 DOM
-
2026-06-10days on market $299,900 Active 52 DOM
-
2026-06-09days on market $299,900 Active 51 DOM
-
2026-06-08days on market $299,900 Active 50 DOM
-
2026-06-07days on market $299,900 Active 49 DOM
-
2026-06-05days on market $299,900 Active 46 DOM
-
2026-06-03days on market $299,900 Active 45 DOM
-
2026-06-02days on market $299,900 Active 44 DOM
-
2026-06-01days on market $299,900 Active 43 DOM
-
2026-05-31days on market $299,900 Active 42 DOM
-
2026-05-30days on market $299,900 Active 41 DOM
-
2026-05-14price $299,900 183-char remark
-
2026-04-19$330,000 Active 183-char remark
ⓘ Source: listings_history table (triggers on properties + properties_extension) + one-shot
backfill from property_details.listing_events for pre-trigger history.
Tax reassessment forecast DE · Partial reset (capped growth)
- Current annual tax
- $1,614 · $135/mo
- Projected year-2 tax
- $1,677 · $140/mo
- Expected delta
- +$63/yr (+$5/mo · 3.9%)
ⓘ Screening estimate from a state-policy table — verify with the county assessor before closing.
Climate risk First Street
- Flood 1/10 Low FEMA zone X (unshaded) · 0% chance over 30 yrs
- Wildfire 1/10 Low
- Heat 8/10 Severe 7 d/yr ≥102°F today · 16 d/yr by 30 yrs out
- Wind 6/10 Major 74% chance of damaging wind over 30 yrs
- Air quality 2/10 Low 1 unhealthy d/yr today · 2 by 30 yrs out
Nearby sold comps map
Loading sold comps map…
Walkable amenities ~0.75 mi
Loading nearby amenities…
Taxation est. · year 1
- Rental income
- $28,800
- − Mortgage interest
- −$16,799
- − Property taxes
- −$1,614
- − Insurance
- −$1,500
- − Repairs & maintenance
- −$2,304
- − Management
- −$2,304
- − HOA
- −$264
- − Depreciation
- −$8,724
- Taxable loss
- −$4,709
- Est. tax savings @ 24.0%
- +$1,130
- After-tax cash flow
- $1,632/yr
For passive investors: Depreciation is non-cash, so a rental often shows a tax loss while cash-flowing — sheltering income. Rental losses are passive: they offset passive income freely, and up to $25,000/yr can offset ordinary (W-2) income if you actively participate and your MAGI is under $100k (phasing out to $0 by $150k); unused losses carry forward. On sale, claimed depreciation is recaptured at up to 25%, and gains may owe capital-gains tax (a 1031 exchange can defer both). Figures are a year-1 estimate at your 24.0% rate — not tax advice; consult a CPA.
Schools (NCES district)
- District
- Lake Forest School District
- NCES district ID
- 1000790
- Math proficiency
- 26% ▼ -23.00%
- Reading proficiency
- 44% ▼ -14.00%
- Median HH income
- $52,034
- Composite
- 30.47/100
- National rank
- #6225
- State rank
- #13 of 26 in DE
Livability — Felton
- Score
- 72/100
- State rank
- #18
- US rank
- #6154
Category grades
Schools grade is shown separately in the Schools card above.
Census & demographics
- Population (ZIP)
- 13,167
Population outlook (Kent County) Hauer SSP2
- Today (2025)
- 194,477 people
- By 2030
- 204,351 · +5.1%
- By 2040
- 222,135 · +14.2%
- By 2050
- 236,483 · +21.6%
- By 2075
- 266,327 · +36.9%
- By 2100
- 275,335 · +41.6%
Race, ethnicity, and origin ACS 2023
- Neighborhood character
- Predominantly White (73%)
- Race & ethnicity
- White 73% Black 18% Hispanic / Latino 5% Two or more races 4%
- Common ancestry
- Scotch-Irish 2% Portuguese 2% Romanian 2%
- Foreign-born
- 3% · Canada, China, Jamaica
- Languages at home
- 95% English-only · Spanish 4%
Political lean MEDSL · Kent
- 2024 margin
- Toss-up / Even · D 50.2% · R 48.2% · Other 1.7%
- 2008→2024 swing
- -7.8pp toward R · 2008: 9.8pp · 2024: 2.0pp
- All cycles
- 2024: D+2.0 2020: D+4.1 2016: R+4.9 2012: D+4.9 2008: D+9.8
Not yet ingested
- Civics
- —
Market trends
- HPI YoY
- ▼ -35.03%
- Current HPI
- 209.4766
- Rent YoY
- —
- Metro
- —
- State GDP YoY
- —
- F500 in state
- 0
Price history
-9.1% since first listed2 events — show timeline
- 2026-05-14 Price Changed $299,900 BRIGHT MLS
- 2026-04-19 Listed $330,000 BRIGHT MLS
Property tax history
+2.9%/yrLatest (2025): $1,614 · +2.2% YoY. Source: county tax records.
Cash-flow waterfall
monthlySold comps — $/sqft
last 12 mo · ≤1 miLoading sold comps…