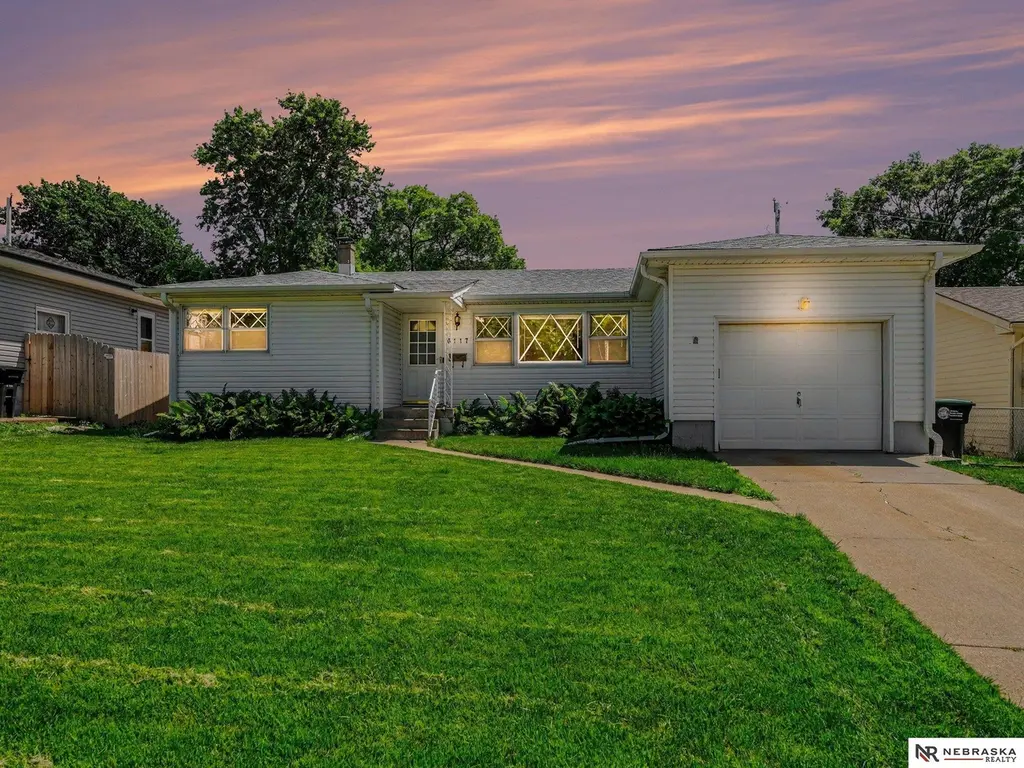
6117 Elm St · Omaha, NE
Flood risk 1/10 · Minimal
- FEMA flood zone
- X (unshaded)
- Chance of flooding over 30 yrs
- 0.0%
- Est. flood insurance / yr
- $473 – $860
Fire risk 1/10 · Minimal
- Est. fire insurance / yr
- $1,161 – $2,155
Heat risk 3/10 · Minor
- Hot days now (above 104°F)
- 7 days/yr
- Hot days in 30 yrs
- 15 days/yr
Wind risk 2/10 · Minimal
- Chance of severe wind over 30 yrs
- —
Air-quality risk 2/10 · Minimal
- Unhealthy air days now
- 2 days/yr
- Unhealthy air days in 30 yrs
- 2 days/yr
Risk factors via First Street. Map © Google.
Why this score? — see what drove the D+ grade
The composite is a weighted blend of 9 inputs, each scored 0–100. Each bar is that input's sub-score; the figure is the points it added to the 100-point composite (weight × sub-score).
- ARV discount +12.6/15.0
- Cash flow +10.6/30.0
- Appreciation +5.0/10.0
- Livability +4.2/5.0
- 1% rule +3.3/10.0
- DSCR +3.0/10.0
- Rent growth +2.5/5.0
- Condition / age +2.5/5.0
- Schools +2.1/10.0
$260,000
🖨 Deal sheet (PDF) 📄 Offer letter ✓ Due diligence
Listing remarks MLS
PENDING on the market for backup offers only. Unlock the potential of this hidden gem in desirable Aksarben Heights! Nestled just moments away from the vibrant Aksarben area, this investor special presents a prime opportunity for savvy buyers. With 3 bedrooms upstairs plus a non-conforming 4th bedroom in the basement, along with 2 bathrooms, this home awaits your creative touch to transform it into a modern masterpiece. Imagine stepping into instant equity as you update this space to suit your style. The neighborhood's charm is unbeatable, offering easy access to an array of dining and shopping options. Don't miss out on this chance to make your mark in one of Omaha's most sought-after locales! Property is SOLD AS-IS.
Key facts
- New carpet
- Bonus kitchenette
- Egress window
Tags
Property features AI
Exterior
- Parking: Attached garage for 1 vehicle; One covered parking space
- Utilities: Public water; Public sewer
- Home design: Single-family residence (not new); Above-grade and below-grade finished living areas
- Construction: Built in 1958; Block foundation; Composition roof
- Exterior features: Deck; Full chain-link fencing; Level lot, subdivided
Interior
- Kitchen: Main kitchen on the main floor with vinyl flooring and ceiling fan; Second kitchen located in the basement; Appliances included: Oven, Refrigerator, Dishwasher, Cooktop
- Bedrooms: Primary bedroom on main floor with wood flooring and ceiling fan; Second bedroom on main floor with wood flooring and ceiling fan; Third bedroom on main floor with wood flooring
- Flooring: Wood flooring in main living areas and bedrooms; Carpet in some areas; Vinyl flooring in kitchen
- Bathrooms: Three bathrooms total: one full bath, one three-quarter bath, and one half bath; Two bathrooms on the main level
- Heating & cooling: Natural gas forced-air heating; Central air conditioning
- Interior features: Second kitchen; Ceiling fans throughout; Partially finished basement with workshop and finished rec/office space
- Laundry & utility: Basement utility/workshop area
Neighborhood map
What this means for you Summary
Snapshot
- This is a 3-bed/2.5-bath single-family listed at $260k.
Deal economics
- At list price, monthly cash flow is $-130 ($-2k/yr) — negative.
- To cash-flow at today's rent, offer at most $237k (8.8% below list).
- To meet the 1% rule (rent ≥ 1% of price), the offer needs to be $216k (17.1% below list).
- Recommended offer: $216k (17.1% below list) — sets the bar for 1% rule.
- Cap rate 5.7% vs local median 3.6% in Omaha — top-decile yield for the area; either an underpriced asset or a hidden risk that comps aren't pricing in. Stress-test before assuming the spread holds.
Location & tenants
- Location reads 84/100 on livability (#7 in NE, #663 nationally) — a professional / high-income tenant draw. Strengths: amenities A+, commute A+, cost of living A+; Watch: crime F.
- Omaha Public Schools (urban): math 20% / reading 28% proficiency, ranked #110 of 111 in NE (top 99%) — low school quality limits family demand, transient renter base, plan for 1-2y turnover; 62% free/reduced lunch — lower-income household profile, screen leases tightly.
- Zoned schools: Belle Ryan Elementary School (math 22% / reading 37%, grade F, #427 of 502 statewide, top 87%, 305 students, 0% FRL); Norris Middle School (math 11% / reading 16%, grade F, #126 of 128 statewide, top 98%, 1,187 students, 0% FRL); Buena Vista High School (721 students, 0% FRL) — zoned schools average 0% FRL vs 62% district-wide (62 pts lower); this property's tenant base skews higher-income than the district average.
- Market conditions: 2 active listings in the ZIP; 15 comparable units currently listed for rent nearby; rentals leasing fast (median 14d on market — plan ~1-2 weeks tenant-placement turnaround); 4,539 units permitted in Douglas County in 2024 (2,583 in 5+ unit buildings).
Forward outlook
- In year one you build about $10k of equity ($2k loan paydown + $8k appreciation (3.0% local appreciation)).
- Douglas County population projected at +28% by 2050 — long-run rental-demand tailwind backs the buy-and-hold thesis.
- By year 4, paydown + projected appreciation supports a ~$33k cash-out refi (75% LTV) — recoverable capital for the next deal without selling this one.
Negotiation context
- Only 2 days on market — expect competitive offers; lowballing is unlikely to land.
- 3 sale attempts since 2y ago with the ask held roughly flat each time — persistent listings suggest the price (not the market) is what's stuck; bring a comps-based counter.
Risks & watch-outs
- Watch-outs: built in 1958 — expect roof / HVAC / electrical / plumbing capex.
Questions for the listing agent
- What do current leases actually rent for vs. the listed asking? Can we see a recent rent roll and the last 12 months of T-12 income?
- Built in 1958 — when were the roof, HVAC, electrical panel, plumbing, and water heater last replaced?
- Is there a deadline driving the sale (1031 exchange, divorce, estate, relocation)? That informs how much negotiation room exists.
- Crime grade is F in this area — have there been break-ins, vandalism, or insurance claims at this property in the last 3 years? What carrier currently insures it and at what premium?
- The area grade is low — what's the realistic commute time and amenity access for the typical tenant pool here? Any planned neighborhood developments (good or bad) we should know about?
- What's the average days-on-market for RENTAL listings here right now (not sales)? A rising rental-DOM trend means longer vacancies and softer asking-rent achievability than the comps imply.
- What's the recent tenant-quality profile in this submarket — average credit score on applications, eviction rate, late-payment / NSF rate, and stable-employment percentage? A property-management company in the area should have these aggregated.
- How much new for-sale + rental construction is in the pipeline within 1–3 miles? Heavy new supply typically softens prices + rents 12–24 months out; constrained supply supports both.
Investment metrics
- 1% rule
- 0.83% ✗
- Cap rate
- 5.69%
- Cash-on-cash
- -2.15%
- DSCR
- 0.90
- GRM
- 10.1
CMA / ARV
- ARV (on-the-fly)
- $293,406
- Comps found
- 12
Show comp detail 12 sales within ~0.75 mi
| Address | Dist | Beds/Ba | Sqft | Sold | Price | $/sf | Match |
|---|---|---|---|---|---|---|---|
| 5630 Oak St | 0.25mi | 3/2.0 | 1,984 (+7%) | 4mo | $275,000 | $139 | 72 |
| 2601 S 60 St | 0.17mi | 4/2.0 (+1) | 1,671 (-10%) | 2mo | $222,000 | $133 | 66 |
| 2109 S 61st Ave | 0.43mi | 3/2.0 | 1,685 (-9%) | 2mo | $385,000 | $228 | 61 |
| 6020 Hickory St | 0.71mi | 3/2.0 | 1,867 (+0%) | 6mo | $337,000 | $181 | 59 |
| 6036 Walnut St | 0.64mi | 4/2.0 (+1) | 1,792 (-4%) | 1mo | $245,000 | $137 | 57 |
| 6152 Hickory St | 0.71mi | 3/2.0 | 1,751 (-6%) | 6mo | $250,000 | $143 | 51 |
| 5608 Cedar St | 0.64mi | 3/2.0 | 1,677 (-10%) | 3mo | $265,000 | $158 | 50 |
| 6019 Hickory St | 0.68mi | 3/2.0 | 1,727 (-7%) | 6mo | $330,000 | $191 | 49 |
| 5602 A St | 0.62mi | 3/2.5 | 1,654 (-11%) | 4mo | $320,000 | $193 | 49 |
| 5858 Hickory St | 0.71mi | 4/2.0 (+1) | 1,968 (+6%) | 2mo | $334,500 | $170 | 48 |
| 5714 A St | 0.57mi | 4/2.0 (+1) | 2,133 (+15%) | 0mo | $270,000 | $127 | 41 |
| 5620 Walnut St | 0.71mi | 2/1.0 (-1) | 1,588 (-14%) | 2mo | $249,900 | $157 | 30 |
Match score weights: distance 35% · size 25% · config 20% · recency 20%. Top-matched comps best support the ARV.
Projected returns pro-forma
3.0% appreciation · 3.0% rent growth · sell at horizon
- IRR
- 5.5%
- Equity multiple
- 1.32×
- Total profit
- $23,082
- Equity at exit
- $116,907
- IRR
- 8.5%
- Equity multiple
- 2.29×
- Total profit
- $93,908
- Equity at exit
- $180,168
Cash invested: $72,800 (down + closing). Projections, not guarantees.
Landlord ↔ Tenant lean methodology
- Overall (STATE)
- 83 Strongly Landlord-Friendly
- State Nebraska
- 83 Strongly Landlord-Friendly · R+13
- County
- — inherits STATE
- City
- — inherits STATE
ZIP-level market 68106-0000
- Active inventory
- 2
- Price-to-rent
- 10.1×
Monthly cashflow live
- Estimated rent
- $2,155 high interval (Pro) →
- Mortgage (P&I)
- −$1,363
- Tax from tax record
- −$361 /mo · $4,331/yr
- Insurance
- −$108
- HOA
- −$0
- Vacancy / Maint / Mgmt
- −$453
- Net cashflow
- $-130
Break-even live
Sensitivity live
| Price | -10% $17 | -5% $-57 | +0% $-130 | +5% $-204 | +10% $-277 |
|---|---|---|---|---|---|
| Rent | -10% $-300 | -5% $-215 | +0% $-130 | +5% $-45 | +10% $40 |
| Rate | -1.0pp $1 | -0.5pp $-64 | base $-130 | +0.5pp $-198 | +1.0pp $-266 |
UW: 25.0% down · 7.5% · 30yr · 1.5% tax · 5.0% vac · 8.0% maint · 8.0% mgmt
Financing live
Cash to close
- Down payment
- $65,000
- Closing costs
- $7,800
- Reserves months
- —
- Total cash needed
- —
Loan-product check · same deal, 3 products live
Conventional
25% down · 7.5% · 30yr
- Down + closing
- —
- Monthly P&I
- —
- Monthly cashflow
- —
- DSCR
- —
- Eligible?
- —
Personal DTI + credit; lowest rate.
DSCR
20% down · 8.5% · 30yr
- Down + closing
- —
- Monthly P&I
- —
- Monthly cashflow
- —
- DSCR
- —
- Eligible?
- —
No personal income docs; deal must DSCR.
Hard money
10% down · 12.0% · 12mo
- Down + closing
- —
- Monthly P&I
- —
- Monthly cashflow
- —
- DSCR
- —
- Eligible?
- —
Short-term bridge; refi at stabilization.
Rent comps 15 comps
| Address | Beds | Baths | Sqft | Rent | $/sqft | DOM | Units | Dist |
|---|---|---|---|---|---|---|---|---|
| 2130 S 61st Ave Omaha, NE | 3.0 | 2.0 | 2023 | $2,350 | $1.16 | 4d | 1 | 0.40mi |
| 2225 S 64th Plz Omaha, NE | 2.0 | 1.0–2.0 | 905 | $2,795 | $3.09 | 4d | 30 | 0.43mi |
| 2115 S 61st St Omaha, NE | 3.0 | 2.0 | 1696 | $2,400 | $1.42 | 25d | 1 | 0.43mi |
| 2001 S 60th St Omaha, NE | 3.0 | 2.0 | 1965 | $2,095 | $1.07 | 16d | 1 | 0.56mi |
| 3315 S 70th St Omaha, NE | 2.0 | 1.0–2.0 | 932 | $2,995 | $3.21 | 4d | 131 | 0.79mi |
| 7101 Mercy Rd Omaha, NE | 3.0 | 1.0–2.0 | 1011 | $3,335 | $3.30 | 4d | 26 | 0.84mi |
| 5518 Woolworth Ave Omaha, NE | 4.0 | 3.0 | 1765 | $2,700 | $1.53 | 13d | 1 | 0.96mi |
| 2132 S 48th Ave Omaha, NE | 3.0 | 2.0 | 1849 | $1,900 | $1.03 | 4d | 1 | 1.11mi |
| 5136 Poppleton Ave Omaha, NE | 2.0 | 1.5 | 1440 | $1,600 | $1.11 | 13d | 1 | 1.19mi |
| 5132 Poppleton Ave Unit 5136 Omaha, NE | 2.0 | 1.5 | 1440 | $1,600 | $1.11 | 13d | 1 | 1.20mi |
| 2924 Westgate Rd Omaha, NE | 3.0 | 2.0 | 1337 | $2,100 | $1.57 | 25d | 1 | 1.22mi |
| 2130 S 47th St Omaha, NE | 4.0 | 2.0 | 1270 | $2,100 | $1.65 | 45d | 1 | 1.24mi |
| 4844 Hickory St Omaha, NE | 3.0 | 1.5 | 1575 | $2,100 | $1.33 | 25d | 1 | 1.24mi |
| 5156 Pierce St Omaha, NE | 3.0 | 1.5 | 1400 | $1,695 | $1.21 | 45d | 1 | 1.25mi |
| 4841 Pierce St Omaha, NE | 3.0 | 1.0 | 1350 | $2,000 | $1.48 | 4d | 1 | 1.44mi |
Listing history 3 events
-
2026-06-15status $260,000 Pending 2 DOM
-
2026-06-13remarks 693-char remark
-
2026-06-13$260,000 New 2 DOM
ⓘ Source: listings_history table (triggers on properties + properties_extension) + one-shot
backfill from property_details.listing_events for pre-trigger history.
Tax reassessment forecast NE · Resets to sale price
- Current annual tax
- $4,331 · $361/mo
- Projected year-2 tax
- $4,498 · $375/mo
- Expected delta
- +$167/yr (+$14/mo · 3.9%)
ⓘ Screening estimate from a state-policy table — verify with the county assessor before closing.
Climate risk First Street
- Flood 1/10 Low FEMA zone X (unshaded) · 0% chance over 30 yrs
- Wildfire 1/10 Low
- Heat 3/10 Moderate 7 d/yr ≥104°F today · 15 d/yr by 30 yrs out
- Wind 2/10 Low
- Air quality 2/10 Low 2 unhealthy d/yr today · 2 by 30 yrs out
Nearby sold comps map
Loading sold comps map…
Walkable amenities ~0.75 mi
Loading nearby amenities…
Taxation est. · year 1
- Rental income
- $25,860
- − Mortgage interest
- −$14,564
- − Property taxes
- −$4,331
- − Insurance
- −$1,300
- − Repairs & maintenance
- −$2,069
- − Management
- −$2,069
- − Depreciation
- −$7,564
- Taxable loss
- −$6,036
- Est. tax savings @ 24.0%
- +$1,449
- After-tax cash flow
- $-114/yr
For passive investors: Depreciation is non-cash, so a rental often shows a tax loss while cash-flowing — sheltering income. Rental losses are passive: they offset passive income freely, and up to $25,000/yr can offset ordinary (W-2) income if you actively participate and your MAGI is under $100k (phasing out to $0 by $150k); unused losses carry forward. On sale, claimed depreciation is recaptured at up to 25%, and gains may owe capital-gains tax (a 1031 exchange can defer both). Figures are a year-1 estimate at your 24.0% rate — not tax advice; consult a CPA.
Schools (NCES district)
- District
- Omaha Public Schools
- NCES district ID
- 3174820
- Math proficiency
- 20% ▼ -10.00%
- Reading proficiency
- 28% ▼ -5.00%
- Median HH income
- $46,039
- Composite
- 20.83/100
- National rank
- #8502
- State rank
- #110 of 111 in NE
Livability — Omaha
- Score
- 84/100
- State rank
- #7
- US rank
- #663
Category grades
Schools grade is shown separately in the Schools card above.
Census & demographics
- Census place
- Omaha, NE
Population outlook (Douglas County) Hauer SSP2
- Today (2025)
- 625,245 people
- By 2030
- 661,613 · +5.8%
- By 2040
- 732,395 · +17.1%
- By 2050
- 801,988 · +28.3%
- By 2075
- 968,637 · +54.9%
- By 2100
- 1,101,871 · +76.2%
Not yet ingested
- Political lean
- —
- Race & ethnicity
- —
- Common origin
- —
- Civics
- —
Market trends
- HPI YoY
- —
- Current HPI
- —
- Rent YoY
- —
- Metro
- —
- State GDP YoY
- ▲ 0.68%
- F500 in state
- 2
Industry mix (Fortune 500 HQ in NE)
| Industry | F500 HQs | Revenue |
|---|---|---|
| Conglomerate | 1 | $371B |
|
||
Price history
+200.6% since first listed9 events — show timeline
- 2026-06-13 Pending — GPRMLS
- 2026-06-11 Listed $260,000 GPRMLS
- 2024-08-15 Sold (Public Records) $235,000 Public Records
- 2024-08-09 Sold (MLS) $235,000 GPRMLS
- 2024-07-13 Pending — GPRMLS
- 2024-07-08 Listing Removed — GPRMLS
- 2024-07-08 Listed $230,000 GPRMLS
- 2024-06-24 Listed $230,000 GPRMLS
- 1995-06-30 Sold (Public Records) $86,500 Public Records
Property tax history
+4.1%/yrLatest (2025): $4,331 · +24.2% YoY. Source: county tax records.
Cash-flow waterfall
monthlySold comps — $/sqft
last 12 mo · ≤1 miLoading sold comps…