2720 Clear Root Cir · Fort Worth, TX
Flood risk No data
- FEMA flood zone
- —
- Chance of flooding over 30 yrs
- —
- Est. flood insurance / yr
- —
Fire risk No data
- Est. fire insurance / yr
- —
Heat risk No data
- Hot days now (above threshold)
- —
- Hot days in 30 yrs
- —
Wind risk No data
- Chance of severe wind over 30 yrs
- —
Air-quality risk No data
- Unhealthy air days now
- —
- Unhealthy air days in 30 yrs
- —
Risk factors via First Street. Map © Google.
Why this score? — see what drove the D grade
The composite is a weighted blend of 9 inputs, each scored 0–100. Each bar is that input's sub-score; the figure is the points it added to the 100-point composite (weight × sub-score).
- Cash flow +15.1/30.0
- ARV discount +7.5/15.0
- DSCR +4.6/10.0
- Livability +4.0/5.0
- Condition / age +4.0/5.0
- 1% rule +3.4/10.0
- Rent growth +2.5/5.0
- Schools +2.0/10.0
- Appreciation +0.0/10.0
$265,999
🖨 Deal sheet (PDF) 📄 Offer letter ✓ Due diligence
Listing remarks
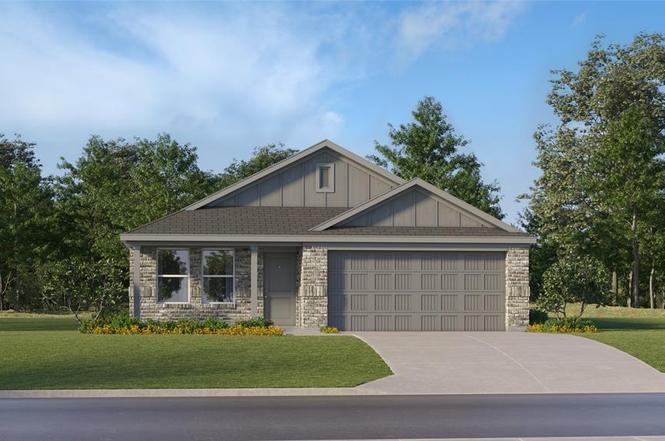
This single-story home shares an open layout between the kitchen, nook and family room for easy entertaining, along with access to the covered patio for year-round outdoor lounging. A luxe owner's suite is in a rear of the home and comes complete with an en-suite bathroom and walk-in closet. There are two secondary bedrooms at the front of the home, ideal for household members and overnight guests. Prices, dimensions and features may vary and are subject to change. Photos are for illustrative purposes only.
Key facts
- Walk-in closet
- Open layout
- Covered patio
Tags
Neighborhood map
What this means for you Summary
Snapshot
- This is a 3-bed/2.0-bath other listed at $266k. Condition is rated good.
Deal economics
- At list price, monthly cash flow is $89 ($1k/yr) — positive.
- The deal already cash-flows at list — no discount required.
- To meet the 1% rule (rent ≥ 1% of price), the offer needs to be $223k (16.0% below list).
- Recommended offer: $223k (16.0% below list) — sets the bar for 1% rule.
- Cap rate 6.7% vs local median 3.9% in Fort Worth — top-decile yield for the area; either an underpriced asset or a hidden risk that comps aren't pricing in. Stress-test before assuming the spread holds.
Location & tenants
- Location reads 80/100 on livability (#49 in TX, #1,954 nationally) — a professional / high-income tenant draw. Strengths: amenities A+, cost of living A+, housing A+; Watch: crime F.
- Fort Worth ISD (urban): math 18% / reading 28% proficiency, ranked #742 of 826 in TX (top 90%) — low school quality limits family demand, transient renter base, plan for 1-2y turnover; 73% free/reduced lunch — lower-income household profile, screen leases tightly.
- Zoned schools: Western Hills El (math 10% / reading 18%, grade F, #4,127 of 4,322 statewide, top 96%, 548 students, 97% FRL) — zoned schools average 97% FRL vs 73% district-wide (24 pts higher); higher-poverty schools than district average — tighter screening recommended.
- Market conditions: Rents soft (-0.2%/yr); 553 active listings in the ZIP; 40 comparable units currently listed for rent nearby; rentals at typical pace (median 23d on market — plan ~3-4 weeks tenant-placement turnaround); solid renter incomes; 18,938 units permitted in Tarrant County in 2024 (8,336 in 5+ unit buildings).
- This rent runs 33% of the median local income ($80k/yr) — at the standard rent-burdened threshold; future hikes will face affordability resistance.
Forward outlook
- Local home prices are declining (-3.0%/yr); year-one equity from $2k of loan paydown is wiped out by about $8k of value loss. Plan a longer hold.
- Tarrant County population projected at +41% by 2050 — long-run rental-demand tailwind backs the buy-and-hold thesis.
Negotiation context
- It's been on market 15 days — a 2% lower offer ($262k) is reasonable based on typical stale-listing flexibility.
Questions for the listing agent
- What does the HOA fee cover, when was the last increase, and are there any pending special assessments or reserve-fund shortfalls?
- Is there a deadline driving the sale (1031 exchange, divorce, estate, relocation)? That informs how much negotiation room exists.
- Schools are D-rated, which usually means shorter tenancies and higher turnover. Who's the typical renter profile here, and what's been the actual vacancy rate?
- Crime grade is F in this area — have there been break-ins, vandalism, or insurance claims at this property in the last 3 years? What carrier currently insures it and at what premium?
- The area grade is low — what's the realistic commute time and amenity access for the typical tenant pool here? Any planned neighborhood developments (good or bad) we should know about?
- What's the average days-on-market for RENTAL listings here right now (not sales)? A rising rental-DOM trend means longer vacancies and softer asking-rent achievability than the comps imply.
- What's the recent tenant-quality profile in this submarket — average credit score on applications, eviction rate, late-payment / NSF rate, and stable-employment percentage? A property-management company in the area should have these aggregated.
- How much new for-sale + rental construction is in the pipeline within 1–3 miles? Heavy new supply typically softens prices + rents 12–24 months out; constrained supply supports both.
Investment metrics
- 1% rule
- 0.84% ✗
- Cap rate
- 6.70%
- Cash-on-cash
- 1.44%
- DSCR
- 1.06
- GRM
- 9.9
CMA / ARV
No comps found within radius.
Projected returns pro-forma
-3.0% appreciation · 0.0% rent growth · sell at horizon
- IRR
- -17.2%
- Equity multiple
- 0.41×
- Total profit
- $-44,035
- Equity at exit
- $39,661
- IRR
- -15.3%
- Equity multiple
- 0.24×
- Total profit
- $-56,604
- Equity at exit
- $22,999
Cash invested: $74,480 (down + closing). Projections, not guarantees.
Landlord ↔ Tenant lean methodology
- Overall (STATE)
- 87 Strongly Landlord-Friendly
- State Texas
- 87 Strongly Landlord-Friendly · R+5
- County
- — inherits STATE
- City
- — inherits STATE
ZIP-level market 76108
- Home prices YoY
- -32.5%
- Rents YoY
- -0.2%
- Active inventory
- 553
- Price-to-rent
- 9.9×
Monthly cashflow live
- Estimated rent
- $2,235 high interval (Pro) →
- Mortgage (P&I)
- −$1,395
- Tax from tax record
- −$89 /mo · $1,073/yr
- Insurance
- −$111
- HOA
- −$81
- Vacancy / Maint / Mgmt
- −$469
- Net cashflow
- $89
Break-even live
Sensitivity live
| Price | -10% $240 | -5% $165 | +0% $89 | +5% $14 | +10% $-61 |
|---|---|---|---|---|---|
| Rent | -10% $-87 | -5% $1 | +0% $89 | +5% $177 | +10% $266 |
| Rate | -1.0pp $223 | -0.5pp $157 | base $89 | +0.5pp $20 | +1.0pp $-50 |
UW: 25.0% down · 7.5% · 30yr · 1.5% tax · 5.0% vac · 8.0% maint · 8.0% mgmt
Financing live
Cash to close
- Down payment
- $66,500
- Closing costs
- $7,980
- Reserves months
- —
- Total cash needed
- —
Loan-product check · same deal, 3 products live
Conventional
25% down · 7.5% · 30yr
- Down + closing
- —
- Monthly P&I
- —
- Monthly cashflow
- —
- DSCR
- —
- Eligible?
- —
Personal DTI + credit; lowest rate.
DSCR
20% down · 8.5% · 30yr
- Down + closing
- —
- Monthly P&I
- —
- Monthly cashflow
- —
- DSCR
- —
- Eligible?
- —
No personal income docs; deal must DSCR.
Hard money
10% down · 12.0% · 12mo
- Down + closing
- —
- Monthly P&I
- —
- Monthly cashflow
- —
- DSCR
- —
- Eligible?
- —
Short-term bridge; refi at stabilization.
Rent comps 40 comps
| Address | Beds | Baths | Sqft | Rent | $/sqft | DOM | Units | Dist |
|---|---|---|---|---|---|---|---|---|
| 2408 Edisto Beach Dr Fort Worth, TX | 4.0 | 2.0 | 1773 | $2,199 | $1.24 | 7d | 1 | 0.14mi |
| 10116 Dalgreen Cir Fort Worth, TX | 4.0 | 2.0 | 1667 | $2,420 | $1.45 | 45d | 1 | 0.20mi |
| 2713 Center Creek Ln Fort Worth, TX | 3.0 | 2.0 | 1464 | $2,340 | $1.60 | 7d | 1 | 0.21mi |
| 2708 River Knoll Ln Fort Worth, TX | 4.0 | 2.0 | 1667 | $2,365 | $1.42 | 45d | 1 | 0.21mi |
| 2712 River Knoll Ln Fort Worth, TX | 3.0 | 2.0 | 1260 | $2,099 | $1.67 | 16d | 1 | 0.21mi |
| 2716 River Knoll Ln Fort Worth, TX | 3.0 | 2.0 | 1260 | $2,099 | $1.67 | 22d | 1 | 0.22mi |
| 2745 Center Creek Ln Fort Worth, TX | 3.0 | 2.0 | 1260 | $2,225 | $1.77 | 45d | 1 | 0.24mi |
| 10136 Dalgreen Cir Fort Worth, TX | 3.0–4.0 | 2.0–2.5 | 1575 | $2,165 | $1.37 | 0d | 1 | 0.25mi |
| 9704 Calhoun Falls Dr Fort Worth, TX | 3.0 | 2.0 | 1469 | $2,175 | $1.48 | 26d | 1 | 0.25mi |
| 10140 Dalgreen Cir Fort Worth, TX | 4.0 | 2.0 | 1660 | $2,420 | $1.46 | 8d | 1 | 0.26mi |
| 2316 Stallings Rd Fort Worth, TX | 3.0 | 2.0 | 1429 | $2,295 | $1.61 | 26d | 1 | 0.28mi |
| 2656 Mistwood Dr Fort Worth, TX | 3.0 | 2.0 | 1260 | $2,245 | $1.78 | 3d | 1 | 0.28mi |
| 2712 Mistwood Dr Fort Worth, TX | 3.0 | 2.0 | 1474 | $2,295 | $1.56 | 21d | 1 | 0.29mi |
| 2712 Mistwood Dr Fort Worth, TX | 3.0 | 2.0 | 1474 | $2,309 | $1.57 | 45d | 1 | 0.29mi |
| 2205 Sadlers Creek Ln Fort Worth, TX | 3.0 | 2.0 | 1802 | $2,326 | $1.29 | 45d | 1 | 0.29mi |
| 2757 Mistwood Dr Fort Worth, TX | 4.0 | 2.0 | 1707 | $2,375 | $1.39 | 3d | 1 | 0.29mi |
| 2765 Mistwood Dr Fort Worth, TX | 3.0 | 2.0 | 1474 | $2,275 | $1.54 | 45d | 1 | 0.30mi |
| 9708 Apex Dr Fort Worth, TX | 4.0 | 2.0 | 1776 | $2,300 | $1.30 | 45d | 1 | 0.41mi |
| 2220 Barnwell Dr Fort Worth, TX | 3.0 | 2.0 | 1463 | $2,200 | $1.50 | 12d | 1 | 0.43mi |
| 9732 Walnut Cove Dr Fort Worth, TX | 4.0 | 2.0 | 1584 | $2,074 | $1.31 | 22d | 1 | 0.47mi |
| 3104 Middleview Rd Fort Worth, TX | 3.0 | 2.0 | 1540 | $1,995 | $1.30 | 26d | 1 | 0.49mi |
| 10241 Pleasant Mound Dr Fort Worth, TX | 3.0 | 2.0 | 1765 | $2,090 | $1.18 | 14d | 1 | 0.52mi |
| 3120 Middleview Rd Fort Worth, TX | 3.0 | 2.5 | 1543 | $1,899 | $1.23 | 0d | 1 | 0.53mi |
| 10240 Dawson Trl Fort Worth, TX | 3.0 | 2.5 | 1844 | $1,871 | $1.01 | 45d | 1 | 0.53mi |
| 10221 Dallam Ln Fort Worth, TX | 3.0 | 2.0 | 1464 | $1,969 | $1.34 | 45d | 1 | 0.54mi |
| 9925 Amaryllis Ln Fort Worth, TX | 3.0 | 2.0 | 1556 | $2,195 | $1.41 | 16d | 1 | 0.55mi |
| 9749 Fallston Dr Fort Worth, TX | 4.0 | 2.0 | 1773 | $2,550 | $1.44 | 46d | 1 | 0.57mi |
| 10061 Pronghorn Ln Fort Worth, TX | 3.0 | 2.0 | 1694 | $1,995 | $1.18 | 3d | 1 | 0.60mi |
| 3213 Westland Ave Fort Worth, TX | 3.0 | 2.0 | 1509 | $1,995 | $1.32 | 45d | 1 | 0.61mi |
| 2521 Ensenada Ln Fort Worth, TX | 3.0 | 2.0 | 1600 | $1,950 | $1.22 | 45d | 1 | 0.62mi |
| 2732 Brea Canyon Rd Fort Worth, TX | 3.0 | 2.0 | 1582 | $2,100 | $1.33 | 18d | 1 | 0.63mi |
| 9721 Cherryville Rd Fort Worth, TX | 4.0 | 2.0 | 1814 | $2,500 | $1.38 | 18d | 1 | 0.64mi |
| 10409 Pleasant Mound Dr Fort Worth, TX | 3.0 | 2.0 | 1441 | $1,925 | $1.34 | 45d | 1 | 0.66mi |
| 2516 Concina Way Fort Worth, TX | 3.0 | 2.0 | 1464 | $1,879 | $1.28 | 21d | 1 | 0.70mi |
| 9413 Fallston Dr Fort Worth, TX | 4.0 | 2.0 | 1649 | $2,455 | $1.49 | 45d | 1 | 0.72mi |
| 1625 Vandemere Ct Fort Worth, TX | 4.0 | 2.0 | 1729 | $2,510 | $1.45 | 26d | 1 | 0.76mi |
| 1625 Gatesville Ct Fort Worth, TX | 4.0 | 2.0 | 1729 | $2,510 | $1.45 | 7d | 1 | 0.76mi |
| 1621 Gatesville Ct Fort Worth, TX | 3.0 | 2.0 | 1532 | $2,305 | $1.50 | 22d | 1 | 0.77mi |
| 1613 Garysburg Ct Fort Worth, TX | 3.0 | 2.0 | 1532 | $2,305 | $1.50 | 14d | 1 | 0.78mi |
| 1609 Vandemere Ct Fort Worth, TX | 4.0 | 2.0 | 1729 | $2,510 | $1.45 | 22d | 1 | 0.79mi |
HOA detail
- Monthly dues
- $81 · $972/yr
Listing history 3 events
-
2026-02-20status Pending
-
2026-02-15price $265,999
-
2026-02-05$267,999 Active
ⓘ Source: listings_history table (triggers on properties + properties_extension) + one-shot
backfill from property_details.listing_events for pre-trigger history.
Tax reassessment forecast TX · Resets to sale price
- Current annual tax
- $1,073 · $89/mo
- Projected year-2 tax
- $4,868 · $406/mo
- Expected delta
- +$3,795/yr (+$316/mo · 353.8%)
ⓘ Screening estimate from a state-policy table — verify with the county assessor before closing.
Nearby sold comps map
Loading sold comps map…
Walkable amenities ~0.75 mi
Loading nearby amenities…
Taxation est. · year 1
- Rental income
- $26,816
- − Mortgage interest
- −$14,900
- − Property taxes
- −$1,073
- − Insurance
- −$1,330
- − Repairs & maintenance
- −$2,145
- − Management
- −$2,145
- − HOA
- −$972
- − Depreciation
- −$7,738
- Taxable loss
- −$3,488
- Est. tax savings @ 24.0%
- +$837
- After-tax cash flow
- $1,908/yr
For passive investors: Depreciation is non-cash, so a rental often shows a tax loss while cash-flowing — sheltering income. Rental losses are passive: they offset passive income freely, and up to $25,000/yr can offset ordinary (W-2) income if you actively participate and your MAGI is under $100k (phasing out to $0 by $150k); unused losses carry forward. On sale, claimed depreciation is recaptured at up to 25%, and gains may owe capital-gains tax (a 1031 exchange can defer both). Figures are a year-1 estimate at your 24.0% rate — not tax advice; consult a CPA.
Condition & rehab AI · 13 photos
This single-story home features a good condition with a good score of 80. It is move-in ready with minor cosmetic updates needed for the exterior and windows.
Value-add opportunities
- Resale Paint exterior siding — Enhances curb appeal and value
- Rental Clean windows — Improves natural light and air circulation
Renovation cost estimate screening
Value-add ROI direction
- Resale Paint exterior siding — Enhances curb appeal and value ↑
- Rental Clean windows — Improves natural light and air circulation ↑
ⓘ Cost ranges are severity-bucket heuristics (US national rule-of-thumb). Get contractor quotes + a written scope before underwriting a rehab budget.
Schools (NCES district)
- District
- Fort Worth ISD
- NCES district ID
- 4819700
- Math proficiency
- 18% ▼ -16.00%
- Reading proficiency
- 28% ▼ -6.00%
- Median HH income
- $42,109
- Composite
- 19.61/100
- National rank
- #8753
- State rank
- #742 of 826 in TX
Livability — Fort Worth
- Score
- 80/100
- State rank
- #49
- US rank
- #1954
Category grades
Schools grade is shown separately in the Schools card above.
Census & demographics
- Census place
- Fort Worth, TX
- County
- Tarrant County · 2,033,669 people
- City population
- 911,619
- Metro
- Dallas-Fort Worth-Arlington, TX
- Population (ZIP)
- 45,537
- Household income
- $80,412
- Rent vs Own
- Severe rent burden
- 774.0
Population outlook (Tarrant County) Hauer SSP2
- Today (2025)
- 2,380,417 people
- By 2030
- 2,578,900 · +8.3%
- By 2040
- 2,974,995 · +25.0%
- By 2050
- 3,350,489 · +40.8%
- By 2075
- 4,216,909 · +77.2%
- By 2100
- 4,741,527 · +99.2%
Race, ethnicity, and origin ACS 2023
- Neighborhood character
- Diverse neighborhood (Simpson 0.62)
- Race & ethnicity
- White 52% Hispanic / Latino 32% Two or more races 17% Black 8% Asian 3% Native American 1%
- Hispanic origin (detail)
- Mexican 26% Puerto Rican 1%
- Common ancestry
- Slovak 2% Lithuanian 1% Romanian 1%
- Foreign-born
- 11% · Canada, Vietnam
- Languages at home
- 76% English-only · Spanish 21% Vietnamese 1% Tagalog/Filipino 1%
Political lean MEDSL · Tarrant
- 2024 margin
- Lean R (+5.1) · D 46.7% · R 51.9% · Other 1.4%
- 2008→2024 swing
- +6.6pp toward D · 2008: -11.7pp · 2024: -5.1pp
- All cycles
- 2024: R+5.1 2020: D+0.2 2016: R+8.7 2012: R+15.7 2008: R+11.7
Not yet ingested
- Civics
- —
Market trends
- HPI YoY
- ▼ -141.39%
- Current HPI
- 294.2459
- Rent YoY
- ▼ -0.18%
- Metro
- Dallas-Fort Worth-Arlington, TX
- State GDP YoY
- ▲ 3.95%
- F500 in state
- 110
Industry mix (Fortune 500 HQ in TX)
| Industry | F500 HQs | Revenue |
|---|---|---|
| Energy | 16 | $1,198B |
|
||
| Technology | 5 | $198B |
|
||
| Engineering / Construction | 4 | $72B |
|
||
| Energy Services | 3 | $60B |
|
||
| Utilities | 3 | $41B |
|
||
| Healthcare | 2 | $330B |
|
||
Price history
-0.7% since first listed3 events — show timeline
- 2026-02-20 Pending — NTREIS
- 2026-02-15 Price Changed $265,999 NTREIS
- 2026-02-05 Listed $267,999 NTREIS
Cash-flow waterfall
monthlySold comps — $/sqft
last 12 mo · ≤1 miLoading sold comps…