 🏗️ New Construction
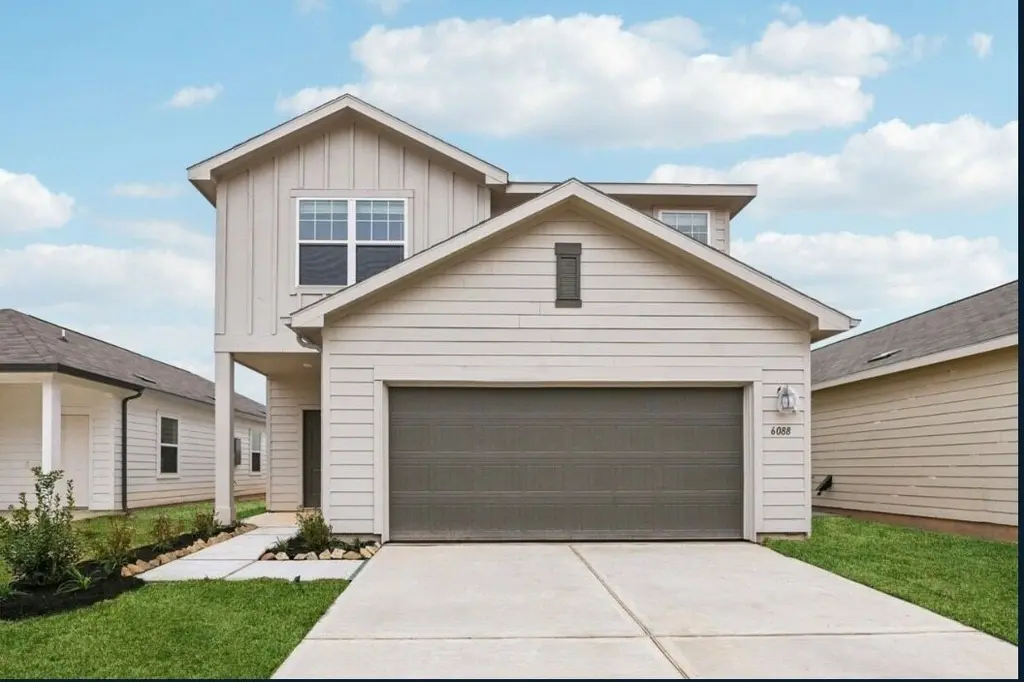
6007 Majestic Creek Trl · Houston, TX
Flood risk No data
- FEMA flood zone
- —
- Chance of flooding over 30 yrs
- —
- Est. flood insurance / yr
- —
Fire risk No data
- Est. fire insurance / yr
- —
Heat risk No data
- Hot days now (above threshold)
- —
- Hot days in 30 yrs
- —
Wind risk No data
- Chance of severe wind over 30 yrs
- —
Air-quality risk No data
- Unhealthy air days now
- —
- Unhealthy air days in 30 yrs
- —
Risk factors via First Street. Map © Google.
Why this score? — see what drove the F grade
The composite is a weighted blend of 9 inputs, each scored 0–100. Each bar is that input's sub-score; the figure is the points it added to the 100-point composite (weight × sub-score).
- Cash flow +7.5/30.0
- ARV discount +7.5/15.0
- Condition / age +4.0/5.0
- Livability +3.7/5.0
- Rent growth +2.9/5.0
- Schools +2.8/10.0
- 1% rule +2.4/10.0
- DSCR +1.7/10.0
- Appreciation +0.0/10.0
$279,990
🖨 Deal sheet 📄 Offer letter ✓ Due diligence
Listing remarks
Spacious Two-Story Living with LVP Flooring and First-Floor Guest Suite The Magellan is a beautifully designed two-story home offering 2,260 square feet with 4 bedrooms, 3 bathrooms, and a 2-car garage. One bedroom and a full bath are located on the first floor, ideal for guests or flexible living. The open-concept main level features LVP flooring throughout the main living areas and a modern kitchen with granite countertops, a large island, soft close cabinets and drawers, and stainless steel appliances, creating a seamless flow for everyday living and entertaining. Upstairs includes a spacious game room and a private primary suite with a walk-in closet and en suite bath. Located in the R
Key facts
- Two-story living
- Large island
- Lvp flooring
Tags
Property features AI
Finance
- Other: Municipal Utility District disclosure available
- Financial info: Lease not considered
- HOA & community: Association: ASI Sterling; Annual association fee of $700
Exterior
- Parking: Attached garage; 2-car garage
- Security: Smoke detector(s)
- Utilities: Public water; Public sewer
- Home design: Residential property; Under construction (new construction); Full ownership; Slab foundation; Composition roof
- Construction: Built by Starlight Homes; Cement siding; Composition roof; 2026 construction; Slab foundation
- Exterior features: Deck; Patio; Private yard; Subdivision setting; Concrete road access
Interior
- Kitchen: Dishwasher; Electric oven; Electric range; Microwave; Refrigerator; Granite counters; Pantry; Breakfast bar; Kitchen open to family room
- Bedrooms: 4 total rooms (includes bedrooms and other living spaces)
- Flooring: Carpet; Plank flooring; Vinyl
- Bathrooms: 3 full bathrooms
- Heating & cooling: Central electric heating; Central electric cooling; Programmable thermostat; Energy-efficient HVAC and insulated construction
- Interior features: Breakfast bar; Granite counters; High ceilings; Kitchen/family room combo; Pantry; Tub with shower; Programmable thermostat; Low emissivity windows; Ventilation for improved indoor air quality
- Laundry & utility: Washer hookup; Electric dryer hookup; Washer and dryer listed among appliances
Neighborhood map
What this means for you Summary
Snapshot
- This is a 4-bed/3.0-bath single-family listed at $280k. Condition is rated good.
Deal economics
- At list price, monthly cash flow is $-400 ($-5k/yr) — negative.
- To cash-flow at today's rent, offer at most $268k (4.4% below list).
- To meet the 1% rule (rent ≥ 1% of price), the offer needs to be $241k (13.8% below list).
- Recommended offer: $241k (13.8% below list) — sets the bar for 1% rule.
- Cap rate 4.8% vs local median 3.2% in Houston — top-decile yield for the area; either an underpriced asset or a hidden risk that comps aren't pricing in. Stress-test before assuming the spread holds.
Location & tenants
- Location reads 74/100 on livability (#184 in TX, #4,771 nationally) — a middle-class / working-renter tenant base. Strengths: amenities A+, cost of living A+, housing A+; Watch: crime F.
- New Caney ISD (suburban): math 31% / reading 32% proficiency, ranked #570 of 826 in TX (top 69%) — families likely to look elsewhere, expect single-tenant / working-renter base with shorter leases.
- Zoned schools: Pine Valley Middle (math 33% / reading 30%, grade F, #997 of 1,662 statewide, top 61%, 776 students, 77% FRL); New Caney H S (math 24% / reading 31%, grade F, #1,183 of 1,632 statewide, top 73%, 2,428 students, 78% FRL) — zoned schools average 78% FRL vs 57% district-wide (21 pts higher); higher-poverty schools than district average — tighter screening recommended.
- Market conditions: Rents rising (+1.6%/yr); 941 active listings in the ZIP; 8 comparable units currently listed for rent nearby; rentals lingering (median 44d on market — plan ~5-8 weeks vacancy on turnover, expect pricing pressure); 50% of comp listings sitting > 30 days — soft ceiling on asking rent; solid renter incomes; 13,259 units permitted in Montgomery County in 2024 (1,402 in 5+ unit buildings).
- This rent runs 30% of the median local income ($96k/yr) — at the standard rent-burdened threshold; future hikes will face affordability resistance.
Forward outlook
- Local home prices are declining (-3.0%/yr); year-one equity from $2k of loan paydown is wiped out by about $10k of value loss. Plan a longer hold.
- Montgomery County population projected at +65% by 2050 — long-run rental-demand tailwind backs the buy-and-hold thesis.
Negotiation context
- Only 9 days on market — expect competitive offers; lowballing is unlikely to land.
Questions for the listing agent
- What do current leases actually rent for vs. the listed asking? Can we see a recent rent roll and the last 12 months of T-12 income?
- What does the HOA fee cover, when was the last increase, and are there any pending special assessments or reserve-fund shortfalls?
- Is there a deadline driving the sale (1031 exchange, divorce, estate, relocation)? That informs how much negotiation room exists.
- Schools are D-rated, which usually means shorter tenancies and higher turnover. Who's the typical renter profile here, and what's been the actual vacancy rate?
- Crime grade is F in this area — have there been break-ins, vandalism, or insurance claims at this property in the last 3 years? What carrier currently insures it and at what premium?
- The area grade is low — what's the realistic commute time and amenity access for the typical tenant pool here? Any planned neighborhood developments (good or bad) we should know about?
- What's the average days-on-market for RENTAL listings here right now (not sales)? A rising rental-DOM trend means longer vacancies and softer asking-rent achievability than the comps imply.
- What's the recent tenant-quality profile in this submarket — average credit score on applications, eviction rate, late-payment / NSF rate, and stable-employment percentage? A property-management company in the area should have these aggregated.
- How much new for-sale + rental construction is in the pipeline within 1–3 miles? Heavy new supply typically softens prices + rents 12–24 months out; constrained supply supports both.
Investment metrics
- 1% rule
- 0.74% ✗
- Cap rate
- 4.82%
- Cash-on-cash
- -5.26%
- DSCR
- 0.77
- GRM
- 11.2
CMA / ARV
- ARV (on-the-fly)
- $325,440
- Comps found
- 12
Show comp detail 12 sales within ~0.75 mi
| Address | Dist | Beds/Ba | Sqft | Sold | Price | $/sf | Match |
|---|---|---|---|---|---|---|---|
| 5971 Triumph Oaks Trl | 0.13mi | 4/3.0 | 2,260 (0%) | 2mo | $309,990 | $137 | 92 |
| 5978 Triumph Oaks Trl | 0.17mi | 4/3.0 | 2,260 (0%) | 1mo | $309,790 | $137 | 91 |
| 3702 Kennedy Clover Ct | 0.20mi | 4/2.5 | 2,279 (+1%) | 3mo | $342,790 | $150 | 85 |
| 6060 Majestic Creek Trl | 0.11mi | 4/3.0 | 2,121 (-6%) | 1mo | $302,540 | $143 | 84 |
| 3716 Kennedy Clover Ct | 0.24mi | 4/2.5 | 2,279 (+1%) | 2mo | $339,490 | $149 | 84 |
| 6111 Emperor Pines Trl | 0.08mi | 4/2.5 | 2,121 (-6%) | 3mo | $289,900 | $137 | 81 |
| 3722 Kennedy Clover Ct | 0.25mi | 5/3.0 (+1) | 2,218 (-2%) | 2mo | $284,990 | $128 | 79 |
| 5990 Triumph Oaks Trl | 0.18mi | 4/2.5 | 2,121 (-6%) | 2mo | $304,990 | $144 | 78 |
| 3844 Sunbird Creek Trl | 0.35mi | 4/2.5 | 2,338 (+4%) | 1mo | $336,990 | $144 | 75 |
| 4127 Slow Creek Ct | 0.44mi | 5/3.0 (+1) | 2,218 (-2%) | 2mo | $328,540 | $148 | 70 |
| 4134 Slow Creek Ct | 0.45mi | 5/3.0 (+1) | 2,218 (-2%) | 1mo | $342,290 | $154 | 70 |
| 4503 Whitehaven Ridge Way | 0.53mi | 3/2.5 (-1) | 2,182 (-4%) | 1mo | $285,000 | $131 | 61 |
Match score weights: distance 35% · size 25% · config 20% · recency 20%. Top-matched comps best support the ARV.
Projected returns pro-forma
-3.0% appreciation · 1.65% rent growth · sell at horizon
- IRR
- -26.8%
- Equity multiple
- 0.11×
- Total profit
- $-81,356
- Equity at exit
- $48,524
- IRR
- -29.7%
- Equity multiple
- -0.28×
- Total profit
- $-116,254
- Equity at exit
- $28,138
Cash invested: $91,123 (down + closing). Projections, not guarantees.
Landlord ↔ Tenant lean methodology
- Overall (STATE)
- 87 Strongly Landlord-Friendly
- State Texas
- 87 Strongly Landlord-Friendly · R+5
- County
- — inherits STATE
- City
- — inherits STATE
ZIP-level market 77365
- Home prices YoY
- -33.0%
- Rents YoY
- 1.6%
- Active inventory
- 941
- Price-to-rent
- 9.7×
Monthly cashflow live
- Estimated rent
- $2,414 high interval (Pro) →
- Mortgage (P&I)
- −$1,707
- Tax est. 1.5%
- −$407 /mo · $4,882/yr
- Insurance
- −$136
- HOA
- −$58
- Vacancy / Maint / Mgmt
- −$507
- Net cashflow
- $-400
Break-even live
UW: 25.0% down · 7.5% · 30yr · 1.5% tax · 5.0% vac · 8.0% maint · 8.0% mgmt
Financing live
Cash to close
- Down payment
- $81,360
- Closing costs
- $9,763
- Reserves months
- —
- Total cash needed
- —
Loan-product check · same deal, 3 products live
Conventional
25% down · 7.5% · 30yr
- Down + closing
- —
- Monthly P&I
- —
- Monthly cashflow
- —
- DSCR
- —
- Eligible?
- —
Personal DTI + credit; lowest rate.
DSCR
20% down · 8.5% · 30yr
- Down + closing
- —
- Monthly P&I
- —
- Monthly cashflow
- —
- DSCR
- —
- Eligible?
- —
No personal income docs; deal must DSCR.
Hard money
10% down · 12.0% · 12mo
- Down + closing
- —
- Monthly P&I
- —
- Monthly cashflow
- —
- DSCR
- —
- Eligible?
- —
Short-term bridge; refi at stabilization.
Rent comps 8 comps
| Address | Beds | Baths | Sqft | Rent | $/sqft | DOM | Units | Dist |
|---|---|---|---|---|---|---|---|---|
| 6313 Barrington Cliff Trl Porter, TX | 3.0 | 2.0 | 1800 | $2,134 | $1.19 | 43d | 1 | 0.72mi |
| 6313 Barrington Cliff Trl Porter, TX | 3.0 | 2.0 | 1800 | $1,999 | $1.11 | 1d | 1 | 0.73mi |
| 5714 Straight Way Kingwood, TX | 3.0 | 2.0 | 1788 | $1,830 | $1.02 | 19d | 1 | 0.99mi |
| 5706 Straight Way Kingwood, TX | 4.0 | 2.5 | 2346 | $2,095 | $0.89 | 15d | 1 | 1.01mi |
| 3311 Pleasant Hollow Ln Porter, TX | 5.0 | 3.5 | 3196 | $3,320 | $1.04 | 16d | 1 | 1.05mi |
| 3514 Creek Manor Dr Kingwood, TX | 4.0 | 2.5 | 2274 | $1,995 | $0.88 | 43d | 1 | 1.20mi |
| 23227 Albert Dr Porter, TX | 4.0 | 2.0 | 1800 | $2,300 | $1.28 | 43d | 1 | 1.32mi |
| 9323 Darby Knoll Way Porter, TX | 4.0 | 2.5 | 2182 | $2,595 | $1.19 | 43d | 1 | 1.44mi |
HOA detail
- Monthly dues
- $58 · $696/yr
Listing history 7 events
-
2026-06-18days on market $279,990 Active 9 DOM
-
2026-06-17days on market $279,990 Active 8 DOM
-
2026-06-16days on market $279,990 Active 7 DOM
-
2026-06-15days on market $279,990 Active 6 DOM
-
2026-06-13days on market $279,990 Active 4 DOM
-
2026-06-10remarks 699-char remark
-
2026-06-10$279,990 Active 1 DOM
ⓘ Source: listings_history table (triggers on properties + properties_extension) + one-shot
backfill from property_details.listing_events for pre-trigger history.
Nearby sold comps map
Loading sold comps map…
Walkable amenities ~0.75 mi
Loading nearby amenities…
Taxation est. · year 1
- Rental income
- $28,972
- − Mortgage interest
- −$18,230
- − Property taxes
- −$4,882
- − Insurance
- −$1,627
- − Repairs & maintenance
- −$2,318
- − Management
- −$2,318
- − HOA
- −$696
- − Depreciation
- −$9,467
- Taxable loss
- −$10,565
- Est. tax savings @ 24.0%
- +$2,536
- After-tax cash flow
- $-2,261/yr
For passive investors: Depreciation is non-cash, so a rental often shows a tax loss while cash-flowing — sheltering income. Rental losses are passive: they offset passive income freely, and up to $25,000/yr can offset ordinary (W-2) income if you actively participate and your MAGI is under $100k (phasing out to $0 by $150k); unused losses carry forward. On sale, claimed depreciation is recaptured at up to 25%, and gains may owe capital-gains tax (a 1031 exchange can defer both). Figures are a year-1 estimate at your 24.0% rate — not tax advice; consult a CPA.
Condition & rehab AI · 12 photos
This two-story home is in good condition with a modern kitchen and bathrooms. It has a good curb appeal and is move-in ready. Potential value can be increased with minor cosmetic upgrades.
Value-add opportunities
- Both Painting the exterior and interior walls — Fresh paint can enhance the home's curb appeal and interior aesthetics.
- Both Landscaping improvements — Enhanced landscaping can increase both resale and rental value.
- Both Upgrading the flooring in the bedrooms — Replacing carpet with hardwood or tile can increase both resale and rental value.
- Both Upgrading the kitchen appliances — Modernizing the kitchen appliances can increase both resale and rental value.
- Both Upgrading the bathrooms with modern fixtures — Modernizing the bathrooms can increase both resale and rental value.
Renovation cost estimate screening
Value-add ROI direction
- Both Painting the exterior and interior walls — Fresh paint can enhance the home's curb appeal and interior aesthetics. ↑
- Both Landscaping improvements — Enhanced landscaping can increase both resale and rental value. ↑
- Both Upgrading the flooring in the bedrooms — Replacing carpet with hardwood or tile can increase both resale and rental value. ↑
- Both Upgrading the kitchen appliances — Modernizing the kitchen appliances can increase both resale and rental value. ↑
- Both Upgrading the bathrooms with modern fixtures — Modernizing the bathrooms can increase both resale and rental value. ↑
ⓘ Cost ranges are severity-bucket heuristics (US national rule-of-thumb). Get contractor quotes + a written scope before underwriting a rehab budget.
Schools (NCES district)
- District
- New Caney ISD
- NCES district ID
- 4832400
- Math proficiency
- 31% ▼ -16.00%
- Reading proficiency
- 32% ▼ -6.00%
- Median HH income
- $55,380
- Composite
- 27.97/100
- National rank
- #6857
- State rank
- #570 of 826 in TX
Livability — Houston
- Score
- 74/100
- State rank
- #184
- US rank
- #4771
Category grades
Schools grade is shown separately in the Schools card above.
Census & demographics
- County
- Montgomery County · 663,713 people
- City population
- 3,226,434
- Metro
- Houston-The Woodlands-Sugar Land, TX
- Population (ZIP)
- 46,418
- Household income
- $95,702
- Rent vs Own
- Severe rent burden
- 1016.0
Population outlook (Montgomery County) Hauer SSP2
- Today (2025)
- 713,896 people
- By 2030
- 805,263 · +12.8%
- By 2040
- 992,708 · +39.1%
- By 2050
- 1,179,590 · +65.2%
- By 2075
- 1,628,084 · +128.1%
- By 2100
- 1,937,880 · +171.5%
Race, ethnicity, and origin ACS 2023
- Neighborhood character
- Diverse neighborhood (Simpson 0.59)
- Race & ethnicity
- Hispanic / Latino 46% White 44% Two or more races 15% Black 5% Asian 3%
- Hispanic origin (detail)
- Mexican 39% Puerto Rican 1%
- Common ancestry
- Lithuanian 4% Slovak 2% Romanian 2%
- Foreign-born
- 18% · Canada
- Languages at home
- 59% English-only · Spanish 36% Other Indo-European 2% Russian/Polish/Slavic 1%
Political lean MEDSL · Montgomery
- 2024 margin
- Solid R (+45.5) · D 26.8% · R 72.3%
- 2008→2024 swing
- +7.2pp toward D · 2008: -52.7pp · 2024: -45.5pp
- All cycles
- 2024: R+45.5 2020: R+43.8 2016: R+51.4 2012: R+60.7 2008: R+52.7
Not yet ingested
- Civics
- —
Market trends
- HPI YoY
- ▼ -111.46%
- Current HPI
- 225.9903
- Rent YoY
- ▲ 1.65%
- Metro
- Houston-The Woodlands-Sugar Land, TX
- State GDP YoY
- ▲ 3.95%
- F500 in state
- 110
Industry mix (Fortune 500 HQ in TX)
| Industry | F500 HQs | Revenue |
|---|---|---|
| Energy | 16 | $1,198B |
|
||
| Technology | 5 | $198B |
|
||
| Engineering / Construction | 4 | $72B |
|
||
| Energy Services | 3 | $60B |
|
||
| Utilities | 3 | $41B |
|
||
| Healthcare | 2 | $330B |
|
||
Price history
-10.6% since first listed2 events — show timeline
- 2026-06-09 Price Changed $279,990 HARMLS
- 2026-06-09 Listed $313,290 HARMLS
Cash-flow waterfall
monthlySold comps — $/sqft
last 12 mo · ≤1 miLoading sold comps…