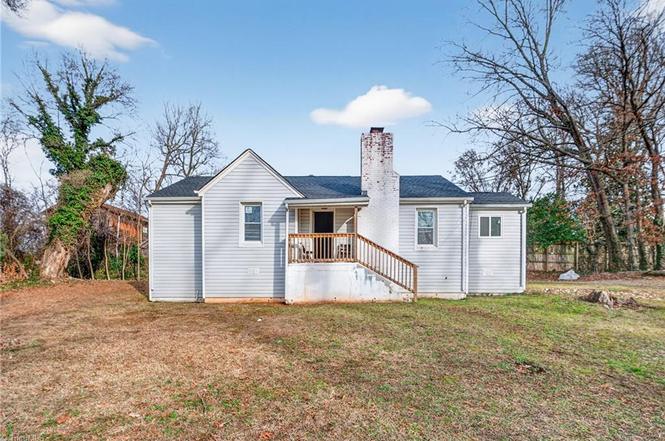
1310 Madison St · High Point, NC
Flood risk 1/10 · Minimal
- FEMA flood zone
- X (unshaded)
- Chance of flooding over 30 yrs
- 0.0%
- Est. flood insurance / yr
- $507 – $1,088
Fire risk 1/10 · Minimal
- Est. fire insurance / yr
- $906 – $1,684
Heat risk 5/10 · Moderate
- Hot days now (above 104°F)
- 7 days/yr
- Hot days in 30 yrs
- 17 days/yr
Wind risk 4/10 · Minor
- Chance of severe wind over 30 yrs
- 15.0%
Air-quality risk 2/10 · Minimal
- Unhealthy air days now
- 1 days/yr
- Unhealthy air days in 30 yrs
- 1 days/yr
Risk factors via First Street. Map © Google.
Why this score? — see what drove the D grade
The composite is a weighted blend of 9 inputs, each scored 0–100. Each bar is that input's sub-score; the figure is the points it added to the 100-point composite (weight × sub-score).
- Cash flow +13.8/30.0
- ARV discount +8.9/15.0
- DSCR +4.2/10.0
- Livability +3.9/5.0
- Schools +3.6/10.0
- 1% rule +2.8/10.0
- Rent growth +2.7/5.0
- Condition / age +2.5/5.0
- Appreciation +0.0/10.0
$158,000
🖨 Deal sheet 📄 Offer letter ✓ Due diligence
Listing remarks
Charming 2-bedroom, 1-bath home is full of opportunity and perfectly situated just minutes from downtown High Point, local restaurants, shopping, and everyday conveniences. Offering approximately 970 square feet of comfortable living space, the home features updated flooring throughout, a functional layout, and plenty of natural light. Whether you're a first-time homebuyer looking for an affordable place to call home or an investor seeking your next addition, this property offers endless potential. The spacious lot provides room to enjoy the outdoors, entertain guests, or create the backyard retreat you've always wanted. Move-in ready with the opportunity to add your own personal touches, t
Key facts
- 0.32 acre lot
- Built 1947
- Listed 117 days
Property features AI
Finance
- HOA & community: No homeowners association
Exterior
- Parking: Gravel parking
- Utilities: Public water; Public sewer; Electric water heater
- Home design: Single-story house; Residential, stick/site built construction; Built in 1947; Living room fireplace
- Construction: Stucco exterior; One level; Existing structure
- Exterior features: Partially fenced yard; Public-maintained road access; Irregular lot shape
Interior
- Kitchen: Appliance center
- Bedrooms: Primary bedroom on main level
- Flooring: Vinyl
- Bathrooms: 1 full bathroom
- Heating & cooling: Heat pump; Electric heating; Central air conditioning
- Interior features: Primary bedroom located on the main level; Vinyl flooring; Crawl space foundation
- Laundry & utility: Washer hookup; Dryer connection; Electric water heater
Neighborhood map
What this means for you Summary
Snapshot
- This is a 2-bed/1.0-bath single-family listed at $158k.
Deal economics
- At list price, monthly cash flow is $15 ($175/yr) — positive.
- The deal already cash-flows at list — no discount required.
- To meet the 1% rule (rent ≥ 1% of price), the offer needs to be $123k (21.9% below list).
- Recommended offer: $123k (21.9% below list) — sets the bar for 1% rule.
- Cap rate 6.4% vs local median 4.0% in High Point — top-decile yield for the area; either an underpriced asset or a hidden risk that comps aren't pricing in. Stress-test before assuming the spread holds.
Location & tenants
- Location reads 77/100 on livability (#31 in NC, #3,084 nationally) — a middle-class / working-renter tenant base. Strengths: commute A+, cost of living A+, housing A+; Watch: schools D+, amenities D, employment D.
- Guilford County Schools (urban): math 39% / reading 45% proficiency, ranked #99 of 178 in NC (top 56%) — families likely to look elsewhere, expect single-tenant / working-renter base with shorter leases.
- Market conditions: Rents flat; 120 active listings in the ZIP; 12 comparable units currently listed for rent nearby; rentals at typical pace (median 24d on market — plan ~3-4 weeks tenant-placement turnaround); 3,843 units permitted in Guilford County in 2024 (2,397 in 5+ unit buildings).
Forward outlook
- Local home prices are declining (-3.0%/yr); year-one equity from $1k of loan paydown is wiped out by about $5k of value loss. Plan a longer hold.
- Guilford County population projected at +26% by 2050 — long-run rental-demand tailwind backs the buy-and-hold thesis.
Negotiation context
- It's been on market 118 days — a 9% lower offer ($144k) is reasonable based on typical stale-listing flexibility.
- 4 sale attempts; this cycle's ask has dropped $32k (17%) from the opening price — seller is motivated, your offer sets the floor, not the list.
- Current owner paid $45k; list at $158k implies a 251% gain — meaningful room to come down on a strong offer.
Risks & watch-outs
- Watch-outs: built in 1947 — expect roof / HVAC / electrical / plumbing capex.
- Climate carrying-cost: extreme-heat days projected 7→17/yr by 2055 (HVAC capex compounding) — expect insurance premiums to compound above CPI over the hold.
Questions for the listing agent
- It's been on market 118 days. Have you received any prior offers? Is the seller open to a 22% concession, seller financing, or rate buy-down credit?
- Built in 1947 — when were the roof, HVAC, electrical panel, plumbing, and water heater last replaced?
- Why hasn't it sold? Are there any deal-killer items the seller is aware of (foundation, flood, title, zoning, code violations)?
- Is there a deadline driving the sale (1031 exchange, divorce, estate, relocation)? That informs how much negotiation room exists.
- Schools are D-rated, which usually means shorter tenancies and higher turnover. Who's the typical renter profile here, and what's been the actual vacancy rate?
- Crime grade is F in this area — have there been break-ins, vandalism, or insurance claims at this property in the last 3 years? What carrier currently insures it and at what premium?
- The area grade is low — what's the realistic commute time and amenity access for the typical tenant pool here? Any planned neighborhood developments (good or bad) we should know about?
- What's the average days-on-market for RENTAL listings here right now (not sales)? A rising rental-DOM trend means longer vacancies and softer asking-rent achievability than the comps imply.
- What's the recent tenant-quality profile in this submarket — average credit score on applications, eviction rate, late-payment / NSF rate, and stable-employment percentage? A property-management company in the area should have these aggregated.
- How much new for-sale + rental construction is in the pipeline within 1–3 miles? Heavy new supply typically softens prices + rents 12–24 months out; constrained supply supports both.
Investment metrics
- 1% rule
- 0.78% ✗
- Cap rate
- 6.40%
- Cash-on-cash
- 0.40%
- DSCR
- 1.02
- GRM
- 10.7
CMA / ARV
- ARV (on-the-fly)
- $163,100
- Comps found
- 12
Show comp detail 12 sales within ~0.75 mi
| Address | Dist | Beds/Ba | Sqft | Sold | Price | $/sf | Match |
|---|---|---|---|---|---|---|---|
| 504 Avalon Pl | 0.11mi | 2/1.0 | 875 (-6%) | 7mo | $126,000 | $144 | 79 |
| 500 Avalon Pl | 0.09mi | 3/1.0 (+1) | 875 (-6%) | 10mo | $130,000 | $149 | 73 |
| 1004 Tabor St | 0.52mi | 2/1.0 | 952 (+2%) | 9mo | $170,000 | $179 | 65 |
| 916 Forrest St | 0.50mi | 3/1.0 (+1) | 980 (+5%) | 1mo | $145,000 | $148 | 62 |
| 626 State Ave | 0.28mi | 3/1.0 (+1) | 1,008 (+8%) | 9mo | $160,000 | $159 | 61 |
| 702 E Farriss Ave | 0.60mi | 2/1.0 | 853 (-8%) | 1mo | $185,000 | $217 | 57 |
| 910 E Dayton Ave | 0.60mi | 2/1.0 | 846 (-9%) | 3mo | $160,000 | $189 | 54 |
| 613 Woodridge Ln | 0.50mi | 3/1.0 (+1) | 1,031 (+11%) | 2mo | $152,000 | $147 | 52 |
| 1311 Cook St | 0.36mi | 2/1.0 | 798 (-14%) | 9mo | $140,000 | $175 | 52 |
| 910 Charlotte Ave | 0.63mi | 2/1.0 | 834 (-10%) | 5mo | $162,500 | $195 | 49 |
| 1406 Bridges Dr | 0.74mi | 2/1.0 | 830 (-11%) | 6mo | $130,000 | $157 | 43 |
| 1106 Tabor St | 0.61mi | 3/1.5 (+1) | 1,057 (+13%) | 9mo | $195,100 | $185 | 34 |
Match score weights: distance 35% · size 25% · config 20% · recency 20%. Top-matched comps best support the ARV.
Projected returns pro-forma
-3.0% appreciation · 0.9% rent growth · sell at horizon
- IRR
- -17.8%
- Equity multiple
- 0.38×
- Total profit
- $-27,288
- Equity at exit
- $23,558
- IRR
- -14.1%
- Equity multiple
- 0.26×
- Total profit
- $-32,863
- Equity at exit
- $13,661
Cash invested: $44,240 (down + closing). Projections, not guarantees.
Landlord ↔ Tenant lean methodology
- Overall (STATE)
- 85 Strongly Landlord-Friendly
- State North Carolina
- 85 Strongly Landlord-Friendly · R+3
- County
- — inherits STATE
- City
- — inherits STATE
ZIP-level market 27262
- Rents YoY
- 0.9%
- Active inventory
- 120
- Price-to-rent
- 10.7×
Monthly cashflow live
- Estimated rent
- $1,234 high interval (Pro) →
- Mortgage (P&I)
- −$829
- Tax from tax record
- −$66 /mo · $789/yr
- Insurance
- −$66
- HOA
- −$0
- Vacancy / Maint / Mgmt
- −$259
- Net cashflow
- $15
Break-even live
UW: 25.0% down · 7.5% · 30yr · 1.5% tax · 5.0% vac · 8.0% maint · 8.0% mgmt
Financing live
Cash to close
- Down payment
- $39,500
- Closing costs
- $4,740
- Reserves months
- —
- Total cash needed
- —
Loan-product check · same deal, 3 products live
Conventional
25% down · 7.5% · 30yr
- Down + closing
- —
- Monthly P&I
- —
- Monthly cashflow
- —
- DSCR
- —
- Eligible?
- —
Personal DTI + credit; lowest rate.
DSCR
20% down · 8.5% · 30yr
- Down + closing
- —
- Monthly P&I
- —
- Monthly cashflow
- —
- DSCR
- —
- Eligible?
- —
No personal income docs; deal must DSCR.
Hard money
10% down · 12.0% · 12mo
- Down + closing
- —
- Monthly P&I
- —
- Monthly cashflow
- —
- DSCR
- —
- Eligible?
- —
Short-term bridge; refi at stabilization.
Rent comps 12 comps
| Address | Beds | Baths | Sqft | Rent | $/sqft | DOM | Units | Dist |
|---|---|---|---|---|---|---|---|---|
| 704 E Lexington Ave High Point, NC | 2.0 | 1.0 | 984 | $1,495 | $1.52 | 21d | 1 | 0.33mi |
| 208 W Parkway Ave Unit A High Point, NC | 1.0 | 1.0 | 750 | $1,500 | $2.00 | 23d | 1 | 0.55mi |
| 1300 Eaton Pl Unit B High Point, NC | 1.0 | 1.0 | 648 | $1,075 | $1.66 | 23d | 1 | 0.59mi |
| 2120 Chester Ridge Dr High Point, NC | 1.0–3.0 | 1.0–2.0 | 1001 | $1,202 | $1.20 | 14d | 7 | 0.71mi |
| 1910 Whitehall St High Point, NC | 3.0 | 1.0 | 925 | $1,095 | $1.18 | 23d | 1 | 0.96mi |
| 251 Northpoint Ave High Point, NC | 1.0–2.0 | 1.0 | 721 | $1,095 | $1.52 | 23d | 1 | 0.97mi |
| 419 Hobson St High Point, NC | 3.0 | 1.0 | 840 | $1,150 | $1.37 | 23d | 1 | 1.00mi |
| 313 4th St Unit B High Point, NC | 2.0 | 1.0 | 900 | $995 | $1.11 | 23d | 1 | 1.02mi |
| 706 Westchester Dr High Point, NC | 1.0–3.0 | 1.0–2.0 | 1012 | $1,018 | $1.00 | 14d | 10 | 1.18mi |
| 511 Saunders Pl Unit B High Point, NC | 2.0 | 1.0 | 913 | $1,050 | $1.15 | 23d | 1 | 1.21mi |
| 1533 Beaucrest Ave Unit B High Point, NC | 2.0 | 1.0 | 950 | $995 | $1.05 | 23d | 1 | 1.34mi |
| 509 Ashburn St High Point, NC | 3.0 | 1.0 | 1000 | $795 | $0.80 | 23d | 1 | 1.44mi |
Listing history 28 events
-
2026-06-18days on market $158,000 Active 118 DOM
-
2026-06-17price $158,000 Active 117 DOM
-
2026-06-17days on market $168,000 Active 117 DOM
-
2026-06-16days on market $168,000 Active 116 DOM
-
2026-06-15days on market $168,000 Active 115 DOM
-
2026-06-14remarks 699-char remark
-
2026-06-14pricedays on market $168,000 Active 113 DOM
-
2026-06-10days on market $179,999 Active 110 DOM
-
2026-06-09days on market $179,999 Active 109 DOM
-
2026-06-08days on market $179,999 Active 108 DOM
-
2026-06-07days on market $179,999 Active 107 DOM
-
2026-06-03days on market $179,999 Active 103 DOM
-
2026-06-02days on market $179,999 Active 102 DOM
-
2026-06-01days on market $179,999 Active 101 DOM
-
2026-05-31days on market $179,999 Active 100 DOM
-
2026-05-31days on market $179,999 Active 99 DOM
-
2026-05-01price $179,999
-
2026-02-21$190,000 Active
-
2026-02-20historical $190,000
-
2025-03-25status Active
-
2025-03-21historical Active Under Contract
-
2025-03-17status Active
-
2025-03-12historical Active Under Contract
-
2025-02-21$215,000 Active
-
2025-02-20historical
-
2016-07-28soldstatus $45,000
-
2015-09-16price $44,000
-
1988-07-01soldstatus $20,000
ⓘ Source: listings_history table (triggers on properties + properties_extension) + one-shot
backfill from property_details.listing_events for pre-trigger history.
Tax reassessment forecast NC · Resets to sale price
- Current annual tax
- $789 · $66/mo
- Projected year-2 tax
- $1,296 · $108/mo
- Expected delta
- +$507/yr (+$42/mo · 64.2%)
ⓘ Screening estimate from a state-policy table — verify with the county assessor before closing.
Climate risk First Street
- Flood 1/10 Low FEMA zone X (unshaded) · 0% chance over 30 yrs
- Wildfire 1/10 Low
- Heat 5/10 Major 7 d/yr ≥104°F today · 17 d/yr by 30 yrs out
- Wind 4/10 Moderate 15% chance of damaging wind over 30 yrs
- Air quality 2/10 Low 1 unhealthy d/yr today · 1 by 30 yrs out
Nearby sold comps map
Loading sold comps map…
Walkable amenities ~0.75 mi
Loading nearby amenities…
Taxation est. · year 1
- Rental income
- $14,807
- − Mortgage interest
- −$8,850
- − Property taxes
- −$789
- − Insurance
- −$790
- − Repairs & maintenance
- −$1,185
- − Management
- −$1,185
- − Depreciation
- −$4,596
- Taxable loss
- −$2,588
- Est. tax savings @ 24.0%
- +$621
- After-tax cash flow
- $797/yr
For passive investors: Depreciation is non-cash, so a rental often shows a tax loss while cash-flowing — sheltering income. Rental losses are passive: they offset passive income freely, and up to $25,000/yr can offset ordinary (W-2) income if you actively participate and your MAGI is under $100k (phasing out to $0 by $150k); unused losses carry forward. On sale, claimed depreciation is recaptured at up to 25%, and gains may owe capital-gains tax (a 1031 exchange can defer both). Figures are a year-1 estimate at your 24.0% rate — not tax advice; consult a CPA.
Schools (NCES district)
- District
- Guilford County Schools
- NCES district ID
- 3701920
- Math proficiency
- 39% ▲ 1.00%
- Reading proficiency
- 45% ▲ 1.00%
- Median HH income
- $46,315
- Composite
- 35.78/100
- National rank
- #4842
- State rank
- #99 of 178 in NC
Livability — High Point
- Score
- 77/100
- State rank
- #31
- US rank
- #3084
Category grades
Schools grade is shown separately in the Schools card above.
Census & demographics
- Census place
- High Point, NC
- County
- Guilford County · 487,190 people
- City population
- 102,450
- Metro
- Greensboro-High Point, NC
- Population (ZIP)
- 28,353
- Household income
- $65,006
- Rent vs Own
- Severe rent burden
- 1046.0
Population outlook (Guilford County) Hauer SSP2
- Today (2025)
- 584,596 people
- By 2030
- 616,851 · +5.5%
- By 2040
- 678,451 · +16.1%
- By 2050
- 734,788 · +25.7%
- By 2075
- 862,985 · +47.6%
- By 2100
- 948,704 · +62.3%
Race, ethnicity, and origin ACS 2023
- Neighborhood character
- Diverse neighborhood (Simpson 0.65)
- Race & ethnicity
- White 50% Black 30% Hispanic / Latino 12% Two or more races 7% Asian 4%
- Hispanic origin (detail)
- Mexican 8% Puerto Rican 1%
- Common ancestry
- Slovak 4% Italian 2% Lithuanian 1%
- Foreign-born
- 14% · Canada
- Languages at home
- 80% English-only · Spanish 10% Other Indo-European 5% Other Asian/Pacific 1%
Political lean MEDSL · Guilford
- 2024 margin
- Strong D (+21.8) · D 60.2% · R 38.4% · Other 1.4%
- 2008→2024 swing
- +3.5pp toward D · 2008: 18.4pp · 2024: 21.8pp
- All cycles
- 2024: D+21.8 2020: D+23.1 2016: D+20.0 2012: D+16.5 2008: D+18.4
Not yet ingested
- Civics
- —
Market trends
- HPI YoY
- ▼ -279.14%
- Current HPI
- 205.6152
- Rent YoY
- ▲ 0.90%
- Metro
- Greensboro-High Point, NC
- State GDP YoY
- ▲ 3.28%
- F500 in state
- 26
Industry mix (Fortune 500 HQ in NC)
| Industry | F500 HQs | Revenue |
|---|---|---|
| Financial Services | 2 | $213B |
|
||
| Retail | 2 | $95B |
|
||
| Industrial Conglomerate | 1 | $38B |
|
||
| Metals / Steel | 1 | $35B |
|
||
| Utilities | 1 | $30B |
|
||
| Industrial Machinery | 1 | $19B |
|
||
Price history
+800.0% since first listed12 events — show timeline
- 2026-05-01 Price Changed $179,999 Triad MLS
- 2026-02-21 Listed $190,000 Triad MLS
- 2026-02-20 Coming Soon $190,000 Triad MLS
- 2025-03-25 Relisted — CANOPYMLS as Distributed by MLS Grid
- 2025-03-21 Contingent — CANOPYMLS as Distributed by MLS Grid
- 2025-03-17 Relisted — CANOPYMLS as Distributed by MLS Grid
- 2025-03-12 Contingent — CANOPYMLS as Distributed by MLS Grid
- 2025-02-21 Listed $215,000 CANOPYMLS as Distributed by MLS Grid
- 2025-02-20 Coming Soon — CANOPYMLS as Distributed by MLS Grid
- 2016-07-28 Sold (Public Records) $45,000 Public Records
- 2015-09-16 Price Changed $44,000 Triad MLS
- 1988-07-01 Sold (Public Records) $20,000 Public Records
Property tax history
+2.8%/yrLatest (2025): $789 · -0.8% YoY. Source: county tax records.
Cash-flow waterfall
monthlySold comps — $/sqft
last 12 mo · ≤1 miLoading sold comps…