210-15 23rd Ave Unit 3C · New York, NY
Flood risk 1/10 · Minimal
- FEMA flood zone
- X (unshaded)
- Chance of flooding over 30 yrs
- 0.0%
- Est. flood insurance / yr
- $507 – $1,088
Fire risk 1/10 · Minimal
- Est. fire insurance / yr
- $691 – $1,283
Heat risk 6/10 · Moderate
- Hot days now (above 98°F)
- 7 days/yr
- Hot days in 30 yrs
- 15 days/yr
Wind risk 6/10 · Moderate
- Chance of severe wind over 30 yrs
- 27.0%
Air-quality risk 4/10 · Minor
- Unhealthy air days now
- 6 days/yr
- Unhealthy air days in 30 yrs
- 6 days/yr
Risk factors via First Street. Map © Google.
Why this score? — see what drove the C- grade
The composite is a weighted blend of 9 inputs, each scored 0–100. Each bar is that input's sub-score; the figure is the points it added to the 100-point composite (weight × sub-score).
- Cash flow +15.3/30.0
- ARV discount +7.5/15.0
- Appreciation +6.6/10.0
- Schools +5.0/10.0
- DSCR +4.7/10.0
- 1% rule +4.2/10.0
- Livability +3.8/5.0
- Rent growth +2.5/5.0
- Condition / age +2.5/5.0
$330,000
🖨 Deal sheet 📄 Offer letter ✓ Due diligence
Listing remarks MLS
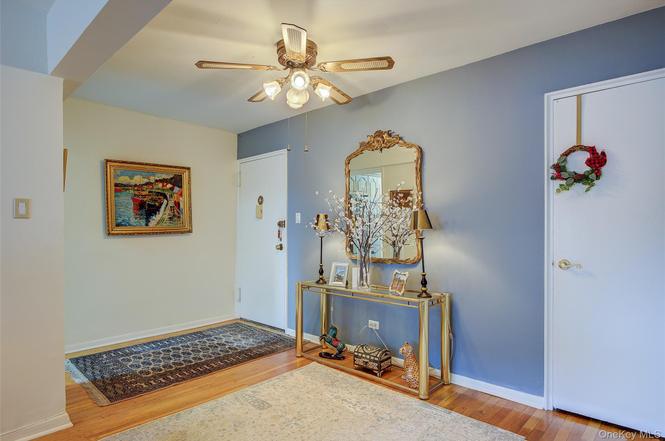
Fabulous 2 bedroom corner apartment, bright, spacious, and filled with natural light. This apartment has been lovingly updated with a modern kitchen, updated bathroom, and polished hardwood floors, The bedrooms are located off a hallway and not directly visible from the living space. There is also a large storage/pantry closet. The lobby was recently updated and shows beautifully. Located in close proximity to the Bay Terrace Shopping Mall, and across from The Bay Club, and a short distance to the public bus into Manhattan., Additional information: Appearance:Excellent
Key facts
- Parking available
- Prime location
- Excellent condition
Tags
Property features AI
Finance
- HOA & community: Additional annual fee of $400 for A/C
Exterior
- Parking: Garage (1 space); Parking fee: $60
- Utilities: Public sewer; Cable available; Electricity connected; Natural gas connected; Phone available; Sewer connected; Trash collection (public); Water connected
- Home design: Stock cooperative; One level unit; Entry level: 3; Building has 6 stories
- Construction: Brick construction
- Exterior features: Brick construction; Not waterfront
Interior
- Kitchen: Dishwasher; Microwave; Oven; Refrigerator
- Flooring: Wood flooring
- Bathrooms: One full bathroom
- Heating & cooling: Steam heating; Wall/window air conditioning units
- Interior features: Formal dining area; No pets allowed
Neighborhood map
What this means for you Summary
Snapshot
- This is a 2-bed/1.0-bath condo listed at $330k.
Deal economics
- At list price, monthly cash flow is $121 ($1k/yr) — positive.
- The deal already cash-flows at list — no discount required.
- To meet the 1% rule (rent ≥ 1% of price), the offer needs to be $304k (7.9% below list).
- Recommended offer: $304k (7.9% below list) — sets the bar for 1% rule.
- Cap rate 6.7% vs local median 2.6% in New York — top-decile yield for the area; either an underpriced asset or a hidden risk that comps aren't pricing in. Stress-test before assuming the spread holds.
Location & tenants
- Location reads 75/100 on livability (#268 in NY, #4,188 nationally) — a middle-class / working-renter tenant base. Strengths: amenities A+, commute A+, health & safety A; Watch: crime F, cost of living F.
- Market conditions: 219 active listings in the ZIP; 25 comparable units currently listed for rent nearby; rentals at typical pace (median 25d on market — plan ~3-4 weeks tenant-placement turnaround); solid renter incomes; 5,302 units permitted in Queens County in 2024 (4,918 in 5+ unit buildings).
- This rent runs 37% of the median local income ($99k/yr) — at the standard rent-burdened threshold; future hikes will face affordability resistance.
Forward outlook
- In year one you build about $13k of equity ($2k loan paydown + $11k appreciation (3.3% local appreciation)).
- Queens County population projected at +16% by 2050 — long-run rental-demand tailwind backs the buy-and-hold thesis.
- At projected returns (3.3% appreciation + 3.0% rent growth), your $92k cash investment doubles in ~6 years — after that, you're playing with house money.
- By year 3, paydown + projected appreciation supports a ~$32k cash-out refi (75% LTV) — recoverable capital for the next deal without selling this one.
Negotiation context
- It's been on market 71 days — a 6% lower offer ($310k) is reasonable based on typical stale-listing flexibility.
- 6 sale attempts since 5y ago with the ask held roughly flat each time — persistent listings suggest the price (not the market) is what's stuck; bring a comps-based counter.
- Current owner paid $280k; 18% above their basis — modest negotiation headroom, anchor on the comps not their cost.
Risks & watch-outs
- Watch-outs: built in 1954 — expect roof / HVAC / electrical / plumbing capex.
- Climate carrying-cost: major wind risk, 27% chance of damaging wind over 30y; extreme-heat days projected 7→15/yr by 2055 (HVAC capex compounding) — expect insurance premiums to compound above CPI over the hold.
Questions for the listing agent
- It's been on market 71 days. Have you received any prior offers? Is the seller open to a 8% concession, seller financing, or rate buy-down credit?
- Built in 1954 — when were the roof, HVAC, electrical panel, plumbing, and water heater last replaced?
- Any open or pending special assessments — roof, HVAC, plumbing, elevator, façade? What's the per-unit balance and payoff schedule, and is the seller paying it off at close or rolling it to the buyer?
- Why hasn't it sold? Are there any deal-killer items the seller is aware of (foundation, flood, title, zoning, code violations)?
- Is there a deadline driving the sale (1031 exchange, divorce, estate, relocation)? That informs how much negotiation room exists.
- Schools are B-rated — typically a magnet for longer-tenancy family renters. What's the average tenant stay here, and is there a school-zone premium baked into asking?
- Crime grade is F in this area — have there been break-ins, vandalism, or insurance claims at this property in the last 3 years? What carrier currently insures it and at what premium?
- What's the average days-on-market for RENTAL listings here right now (not sales)? A rising rental-DOM trend means longer vacancies and softer asking-rent achievability than the comps imply.
- What's the recent tenant-quality profile in this submarket — average credit score on applications, eviction rate, late-payment / NSF rate, and stable-employment percentage? A property-management company in the area should have these aggregated.
- How much new apartment / multifamily construction is in the pipeline within 1–3 miles? Heavy new supply (>2% of stock underway) typically softens rents 12–24 months out; light construction supports rent growth.
Investment metrics
- 1% rule
- 0.92% ✗
- Cap rate
- 6.73%
- Cash-on-cash
- 1.58%
- DSCR
- 1.07
- GRM
- 9.0
CMA / ARV
No comps found within radius.
Projected returns pro-forma
3.26% appreciation · 3.0% rent growth · sell at horizon
- IRR
- 9.7%
- Equity multiple
- 1.56×
- Total profit
- $52,085
- Equity at exit
- $153,228
- IRR
- 11.9%
- Equity multiple
- 2.83×
- Total profit
- $169,111
- Equity at exit
- $239,980
Cash invested: $92,400 (down + closing). Projections, not guarantees.
Landlord ↔ Tenant lean methodology
- Overall (CITY)
- 0 Strongly Tenant-Friendly
- State New York
- 15 Strongly Tenant-Friendly · D+10
- County
- — inherits STATE
- City New York
- 0 Strongly Tenant-Friendly · D+34
ZIP-level market 11360
- Home prices YoY
- 1.6%
- Active inventory
- 219
- Price-to-rent
- 9.0×
Monthly cashflow live
- Estimated rent
- $3,040 high interval (Pro) →
- Mortgage (P&I)
- −$1,731
- Tax est. 1.5%
- −$412 /mo · $4,950/yr
- Insurance
- −$138
- HOA
- −$0
- Vacancy / Maint / Mgmt
- −$638
- Net cashflow
- $121
Break-even live
UW: 25.0% down · 7.5% · 30yr · 1.5% tax · 5.0% vac · 8.0% maint · 8.0% mgmt
Financing live
Cash to close
- Down payment
- $82,500
- Closing costs
- $9,900
- Reserves months
- —
- Total cash needed
- —
Loan-product check · same deal, 3 products live
Conventional
25% down · 7.5% · 30yr
- Down + closing
- —
- Monthly P&I
- —
- Monthly cashflow
- —
- DSCR
- —
- Eligible?
- —
Personal DTI + credit; lowest rate.
DSCR
20% down · 8.5% · 30yr
- Down + closing
- —
- Monthly P&I
- —
- Monthly cashflow
- —
- DSCR
- —
- Eligible?
- —
No personal income docs; deal must DSCR.
Hard money
10% down · 12.0% · 12mo
- Down + closing
- —
- Monthly P&I
- —
- Monthly cashflow
- —
- DSCR
- —
- Eligible?
- —
Short-term bridge; refi at stabilization.
Rent comps 25 comps
| Address | Beds | Baths | Sqft | Rent | $/sqft | DOM | Units | Dist |
|---|---|---|---|---|---|---|---|---|
| 1 Bay Club Dr Unit 21W Bayside, NY | 1.0 | 1.0 | 762 | $3,100 | $4.07 | 12d | 1 | 0.11mi |
| 2 Bay Club Dr Bayside, NY | 1.0 | 1.0 | 780 | $4,000 | $5.13 | 24d | 1 | 0.11mi |
| 20933 26th Ave Unit 1C Bayside, NY | 1.0 | 1.5 | 800 | $3,000 | $3.75 | 24d | 1 | 0.18mi |
| 23-45 Corporal Kennedy St Unit 1 Flushing, NY | 1.0 | 1.0 | 1000 | $2,800 | $2.80 | 24d | 1 | 0.21mi |
| 209-21 26th Ave Unit TB Bayside, NY | 1.0 | 1.0 | 955 | $2,850 | $2.98 | 19d | 1 | 0.21mi |
| 1816 Bell Blvd Bayside, NY | 1.0 | 1.0 | 1000 | $2,500 | $2.50 | 24d | 1 | 0.29mi |
| 15-47 209th St #2 Flushing, NY | 3.0 | 2.0 | 1250 | $3,800 | $3.04 | 24d | 1 | 0.34mi |
| 16-05 Bell Blvd Unit 1st Floor Flushing, NY | 1.0 | 1.0 | 700 | $2,400 | $3.43 | 24d | 1 | 0.40mi |
| 14-21 Bell Blvd Unit 2 Flushing, NY | 3.0 | 2.0 | 1250 | $3,600 | $2.88 | 15d | 1 | 0.52mi |
| 29-04 204th St Unit 1Floor Flushing, NY | 1.0 | 1.0 | 700 | $2,600 | $3.71 | 19d | 1 | 0.64mi |
| 206-14 Emily Rd Unit 42L Bayside, NY | 1.0 | 1.0 | 700 | $2,700 | $3.86 | 24d | 1 | 0.66mi |
| 3321 Jordan St Flushing, NY | 3.0 | 2.0 | 1080 | $3,900 | $3.61 | 24d | 1 | 0.97mi |
| 33-08 Francis Lewis Blvd Unit 2FL Queens, NY | 3.0 | 1.0 | 1050 | $3,050 | $2.90 | 24d | 1 | 1.04mi |
| 208-12 39th Ave Bayside, NY | 3.0 | 1.0 | 950 | $3,150 | $3.32 | 8d | 1 | 1.16mi |
| 214-16 40th Ave Unit 3rd Floor Flushing, NY | 2.0 | 1.0 | 900 | $2,800 | $3.11 | 24d | 1 | 1.23mi |
| 40-21 Bell Blvd Ste 2 Bayside, NY | 3.0 | 2.0 | 1250 | $3,600 | $2.88 | 3d | 1 | 1.24mi |
| 41-20 210th St Unit 1 Flushing, NY | 1.0 | 1.0 | 1030 | $2,350 | $2.28 | 24d | 1 | 1.24mi |
| 36-26 192nd St #2 Flushing, NY | 2.0 | 1.0 | 875 | $3,000 | $3.43 | 8d | 1 | 1.28mi |
| 194-20 39th Ave Unit A Flushing, NY | 1.0 | 1.0 | 900 | $2,250 | $2.50 | 24d | 1 | 1.29mi |
| 207-07 42nd Ave Unit 2 Flushing, NY | 2.0 | 2.0 | 1395 | $3,900 | $2.80 | 3d | 1 | 1.29mi |
| 1011 162nd St Whitestone, NY | 1.0 | 1.0 | 880 | $1,800 | $2.05 | 19d | 1 | 1.30mi |
| 15719 26th Ave Flushing, NY | 2.0 | 1.0 | 850 | $2,850 | $3.35 | 22d | 1 | 1.38mi |
| 42-04 216th St Unit 2 Bayside, NY | 3.0 | 2.0 | 1250 | $3,200 | $2.56 | 18d | 1 | 1.40mi |
| 4032 191st St Flushing, NY | 3.0 | 1.0 | 1500 | $2,700 | $1.80 | 24d | 1 | 1.47mi |
| 168-10 Crocheron Ave Unit 1A Flushing, NY | 1.0 | 1.0 | 750 | $2,250 | $3.00 | 19d | 1 | 1.48mi |
HOA detail condo
- Monthly dues
- $0 · $0/yr
- Assessments
- None detected in remarks — confirm with the listing agent.
Listing history 5 events
-
2026-06-18days on market $330,000 Active 71 DOM
-
2026-06-17days on market $330,000 Active 70 DOM
-
2026-06-15days on market $330,000 Active 68 DOM
-
2026-06-13remarks 244-char remark
-
2026-06-13$330,000 Active 66 DOM
ⓘ Source: listings_history table (triggers on properties + properties_extension) + one-shot
backfill from property_details.listing_events for pre-trigger history.
Climate risk First Street
- Flood 1/10 Low FEMA zone X (unshaded) · 0% chance over 30 yrs
- Wildfire 1/10 Low
- Heat 6/10 Major 7 d/yr ≥98°F today · 15 d/yr by 30 yrs out
- Wind 6/10 Major 27% chance of damaging wind over 30 yrs
- Air quality 4/10 Moderate 6 unhealthy d/yr today · 6 by 30 yrs out
Nearby sold comps map
Loading sold comps map…
Walkable amenities ~0.75 mi
Loading nearby amenities…
Taxation est. · year 1
- Rental income
- $36,485
- − Mortgage interest
- −$18,485
- − Property taxes
- −$4,950
- − Insurance
- −$1,650
- − Repairs & maintenance
- −$2,919
- − Management
- −$2,919
- − Depreciation
- −$9,600
- Taxable loss
- −$4,037
- Est. tax savings @ 24.0%
- +$969
- After-tax cash flow
- $2,426/yr
For passive investors: Depreciation is non-cash, so a rental often shows a tax loss while cash-flowing — sheltering income. Rental losses are passive: they offset passive income freely, and up to $25,000/yr can offset ordinary (W-2) income if you actively participate and your MAGI is under $100k (phasing out to $0 by $150k); unused losses carry forward. On sale, claimed depreciation is recaptured at up to 25%, and gains may owe capital-gains tax (a 1031 exchange can defer both). Figures are a year-1 estimate at your 24.0% rate — not tax advice; consult a CPA.
Schools (NCES district)
No district data.
Livability — New York
- Score
- 75/100
- State rank
- #268
- US rank
- #4188
Category grades
Schools grade is shown separately in the Schools card above.
Census & demographics
- Census place
- New York, NY
- County
- Queens County · 1,914,869 people
- City population
- 7,731,280
- Metro
- New York-Newark-Jersey City, NY-NJ-PA
- Population (ZIP)
- 19,469
- Household income
- $98,875
- Rent vs Own
- Severe rent burden
- 496.0
Population outlook (Queens County) Hauer SSP2
- Today (2025)
- 2,546,320 people
- By 2030
- 2,643,059 · +3.8%
- By 2040
- 2,815,563 · +10.6%
- By 2050
- 2,944,423 · +15.6%
- By 2075
- 3,123,338 · +22.7%
- By 2100
- 3,098,688 · +21.7%
Race, ethnicity, and origin ACS 2023
- Neighborhood character
- Diverse neighborhood (Simpson 0.60)
- Race & ethnicity
- White 54% Asian 29% Hispanic / Latino 12% Two or more races 6% Black 1%
- Hispanic origin (detail)
- Puerto Rican 3% Cuban 2% Dominican 2%
- Common ancestry
- Romanian 4% Scotch-Irish 3% Estonian 1%
- Foreign-born
- 33% · China, South Korea, Canada
- Languages at home
- 58% English-only · Chinese 14% Other Indo-European 11% Korean 8%
Political lean MEDSL · Queens
- 2024 margin
- Strong D (+24.6) · D 62.3% · R 37.7%
- 2008→2024 swing
- -26.2pp toward R · 2008: 50.8pp · 2024: 24.6pp
- All cycles
- 2024: D+24.6 2020: D+45.2 2016: D+53.4 2012: D+58.5 2008: D+50.8
Not yet ingested
- Civics
- —
Market trends
- HPI YoY
- ▲ 3.26%
- Current HPI
- 204.1422
- Rent YoY
- —
- Metro
- New York-Newark-Jersey City, NY-NJ-PA
- State GDP YoY
- ▲ 2.60%
- F500 in state
- 92
Industry mix (Fortune 500 HQ in NY)
| Industry | F500 HQs | Revenue |
|---|---|---|
| Financial Services | 10 | $950B |
|
||
| Consumer Goods | 9 | $162B |
|
||
| Insurance | 4 | $225B |
|
||
| Telecommunications | 2 | $144B |
|
||
| Pharmaceuticals | 2 | $112B |
|
||
| Media / Entertainment | 2 | $69B |
|
||
Price history
+10.0% since first listed20 events — show timeline
- 2026-06-11 Relisted — OneKey® MLS as Distributed by MLS Grid
- 2026-02-27 Listed $330,000 OneKey® MLS as Distributed by MLS Grid
- 2026-02-01 Listing Removed — OneKey® MLS as Distributed by MLS Grid
- 2025-11-10 Price Changed $340,000 OneKey® MLS as Distributed by MLS Grid
- 2025-07-05 Listed $355,000 OneKey® MLS as Distributed by MLS Grid
- 2022-11-21 Sold (MLS) $280,000 OneKey® MLS as Distributed by MLS Grid
- 2022-07-08 Pending — OneKey® MLS as Distributed by MLS Grid
- 2022-05-23 Relisted — OneKey® MLS as Distributed by MLS Grid
- 2022-05-14 Listing Removed — OneKey® MLS as Distributed by MLS Grid
- 2022-05-12 Price Changed $269,900 OneKey® MLS as Distributed by MLS Grid
- 2022-01-27 Price Changed $259,900 OneKey® MLS as Distributed by MLS Grid
- 2021-11-11 Relisted — OneKey® MLS as Distributed by MLS Grid
- 2021-11-09 Listing Removed — OneKey® MLS as Distributed by MLS Grid
- 2021-11-03 Price Changed $239,900 OneKey® MLS as Distributed by MLS Grid
- 2021-10-08 Price Changed $249,999 OneKey® MLS as Distributed by MLS Grid
- 2021-09-10 Price Changed $254,000 OneKey® MLS as Distributed by MLS Grid
- 2021-08-05 Price Changed $259,000 OneKey® MLS as Distributed by MLS Grid
- 2021-05-12 Price Changed $269,000 OneKey® MLS as Distributed by MLS Grid
- 2021-04-27 Price Changed $279,000 OneKey® MLS as Distributed by MLS Grid
- 2021-03-09 Listed $299,888 OneKey® MLS as Distributed by MLS Grid
Cash-flow waterfall
monthlySold comps — $/sqft
last 12 mo · ≤1 miLoading sold comps…