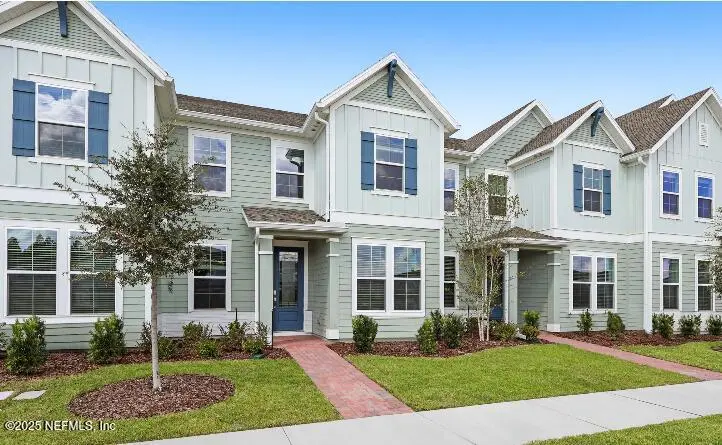
80 Belfort Ct · Fruit Cove, FL
Flood risk No data
- FEMA flood zone
- —
- Chance of flooding over 30 yrs
- —
- Est. flood insurance / yr
- —
Fire risk No data
- Est. fire insurance / yr
- —
Heat risk No data
- Hot days now (above threshold)
- —
- Hot days in 30 yrs
- —
Wind risk No data
- Chance of severe wind over 30 yrs
- —
Air-quality risk No data
- Unhealthy air days now
- —
- Unhealthy air days in 30 yrs
- —
Risk factors via First Street. Map © Google.
Why this score? — see what drove the D- grade
The composite is a weighted blend of 9 inputs, each scored 0–100. Each bar is that input's sub-score; the figure is the points it added to the 100-point composite (weight × sub-score).
- Cash flow +10.6/30.0
- ARV discount +7.5/15.0
- Schools +6.4/10.0
- Livability +3.5/5.0
- DSCR +3.1/10.0
- 1% rule +2.6/10.0
- Rent growth +2.5/5.0
- Condition / age +2.5/5.0
- Appreciation +0.0/10.0
$342,500
🖨 Deal sheet 📄 Offer letter ✓ Due diligence
Listing remarks
MOVE IN READY!! Introducing the Wigeon floor plan by Lennar Townhomes - a spacious unit featuring 3 bedrooms, 2.5 bathrooms, and a two-car garage. This home includes Lennar's signature Everything's Included package: elegant white quartz countertops, 42-inch cabinetry, and a complete Frigidaire stainless steel appliance, range, dishwasher, microwave, and refrigerator. Stylish ceramic wood-look tile is featured in all wet areas and extends into the living, dining, and hallway spaces. Additional highlights include quartz vanities, a pre-screened lanai, water heater, window blinds throughout, a full sprinkler system, and a pavered driveway. Enjoy added peace of mind with a one-year builder w
Key facts
- $20 HOA
- 2 garage spots
- Community pool
Property features AI
Finance
- HOA & community: Homeowners association with annual fee; Association amenities: clubhouse, fitness center, jogging path, playground, tennis courts, trash service; CDD fee applies
Exterior
- Parking: Attached 2-car garage with garage door opener
- Utilities: Public sewer; Electricity connected; Water connected; Windows identified as energy efficient
- Home design: Townhouse; One story; Attached property
- Construction: Fiber cement and frame construction; Shingle roof
- Exterior features: Patio with screened porch; Pond on the property; Front and rear sprinkler systems; Asphalt road access
Interior
- Kitchen: Dishwasher; Disposal; Electric cooktop; Electric oven; Electric range; Ice maker; Microwave; Refrigerator
- Bedrooms: 3 bedrooms (two on second level, primary on first level)
- Flooring: Carpet; Tile
- Bathrooms: 2 full bathrooms; 1 half bathroom
- Heating & cooling: Central heating (electric, heat pump); Central air conditioning (electric)
- Interior features: Breakfast bar; Eat-in kitchen; Pantry; Primary bathroom with shower (no tub); Split bedroom floor plan; Walk-in closet(s)
- Laundry & utility: Washer hookup; Electric dryer hookup; Electric water heater
Neighborhood map
What this means for you Summary
Snapshot
- This is a 3-bed/2.5-bath land listed at $342k.
Deal economics
- At list price, monthly cash flow is $-167 ($-2k/yr) — negative.
- To cash-flow at today's rent, offer at most $313k (8.6% below list).
- To meet the 1% rule (rent ≥ 1% of price), the offer needs to be $262k (23.6% below list).
- Recommended offer: $262k (23.6% below list) — sets the bar for 1% rule.
- Cap rate 5.7% vs local median 2.9% in Fruit Cove — top-decile yield for the area; either an underpriced asset or a hidden risk that comps aren't pricing in. Stress-test before assuming the spread holds.
Location & tenants
- Location reads 69/100 on livability (#469 in FL) — a middle-class / working-renter tenant base. Strengths: crime A+, employment A+, housing A+; Watch: amenities F, commute F, cost of living F.
- St. Johns (rural): math 75% / reading 73% proficiency, ranked #2 of 73 in FL (top 3%) — strong family-tenant draw, lease renewals of 3-5y typical; only 20% free/reduced lunch — higher-income household profile.
- Zoned schools: Timberlin Creek Elementary School (math 81% / reading 85%, grade A+, #65 of 2,144 statewide, top 3%, 1,311 students, 9% FRL); Switzerland Point Middle School (math 80% / reading 72%, grade A, #34 of 571 statewide, top 6%, 1,430 students, 5% FRL); Bartram Trail High School (math 68% / reading 75%, grade B+, #49 of 667 statewide, top 8%, 2,493 students, 4% FRL).
- Market conditions: Rents flat; 1323 active listings in the ZIP; 7 comparable units currently listed for rent nearby; rentals at typical pace (median 24d on market — plan ~3-4 weeks tenant-placement turnaround); high-income renter base; 5,575 units permitted in St. Johns County in 2024 (584 in 5+ unit buildings).
Forward outlook
- Local home prices are declining (-3.0%/yr); year-one equity from $2k of loan paydown is wiped out by about $10k of value loss. Plan a longer hold.
- St. Johns County population projected at +60% by 2050 — long-run rental-demand tailwind backs the buy-and-hold thesis.
Negotiation context
- It's been on market 27 days — a 2% lower offer ($337k) is reasonable based on typical stale-listing flexibility.
Questions for the listing agent
- What do current leases actually rent for vs. the listed asking? Can we see a recent rent roll and the last 12 months of T-12 income?
- What does the HOA fee cover, when was the last increase, and are there any pending special assessments or reserve-fund shortfalls?
- Is there a deadline driving the sale (1031 exchange, divorce, estate, relocation)? That informs how much negotiation room exists.
- Schools are A-rated — typically a magnet for longer-tenancy family renters. What's the average tenant stay here, and is there a school-zone premium baked into asking?
- The area grade is low — what's the realistic commute time and amenity access for the typical tenant pool here? Any planned neighborhood developments (good or bad) we should know about?
- What's the average days-on-market for RENTAL listings here right now (not sales)? A rising rental-DOM trend means longer vacancies and softer asking-rent achievability than the comps imply.
- What's the recent tenant-quality profile in this submarket — average credit score on applications, eviction rate, late-payment / NSF rate, and stable-employment percentage? A property-management company in the area should have these aggregated.
- How much new for-sale + rental construction is in the pipeline within 1–3 miles? Heavy new supply typically softens prices + rents 12–24 months out; constrained supply supports both.
Investment metrics
- 1% rule
- 0.76% ✗
- Cap rate
- 5.71%
- Cash-on-cash
- -2.09%
- DSCR
- 0.91
- GRM
- 10.9
CMA / ARV
No comps found within radius.
Projected returns pro-forma
-3.0% appreciation · 0.08% rent growth · sell at horizon
- IRR
- -22.9%
- Equity multiple
- 0.23×
- Total profit
- $-73,660
- Equity at exit
- $51,068
- IRR
- -26.7%
- Equity multiple
- -0.12×
- Total profit
- $-106,939
- Equity at exit
- $29,613
Cash invested: $95,900 (down + closing). Projections, not guarantees.
Landlord ↔ Tenant lean methodology
- Overall (STATE)
- 87 Strongly Landlord-Friendly
- State Florida
- 87 Strongly Landlord-Friendly · R+3
- County
- — inherits STATE
- City
- — inherits STATE
ZIP-level market 32092
- Home prices YoY
- -32.2%
- Rents YoY
- 0.1%
- Active inventory
- 1323
- Price-to-rent
- 10.9×
Monthly cashflow live
- Estimated rent
- $2,617 high interval (Pro) →
- Mortgage (P&I)
- −$1,796
- Tax from tax record
- −$276 /mo · $3,309/yr
- Insurance
- −$143
- HOA
- −$20
- Vacancy / Maint / Mgmt
- −$550
- Net cashflow
- $-167
Break-even live
UW: 25.0% down · 7.5% · 30yr · 1.5% tax · 5.0% vac · 8.0% maint · 8.0% mgmt
Financing live
Cash to close
- Down payment
- $85,625
- Closing costs
- $10,275
- Reserves months
- —
- Total cash needed
- —
Loan-product check · same deal, 3 products live
Conventional
25% down · 7.5% · 30yr
- Down + closing
- —
- Monthly P&I
- —
- Monthly cashflow
- —
- DSCR
- —
- Eligible?
- —
Personal DTI + credit; lowest rate.
DSCR
20% down · 8.5% · 30yr
- Down + closing
- —
- Monthly P&I
- —
- Monthly cashflow
- —
- DSCR
- —
- Eligible?
- —
No personal income docs; deal must DSCR.
Hard money
10% down · 12.0% · 12mo
- Down + closing
- —
- Monthly P&I
- —
- Monthly cashflow
- —
- DSCR
- —
- Eligible?
- —
Short-term bridge; refi at stabilization.
Rent comps 7 comps
| Address | Beds | Baths | Sqft | Rent | $/sqft | DOM | Units | Dist |
|---|---|---|---|---|---|---|---|---|
| 380 Belfort Ct Saint Augustine, FL | 3.0 | 2.5 | 1782 | $2,500 | $1.40 | 23d | 1 | 0.19mi |
| 413 Rosemont Dr Saint Augustine, FL | 3.0 | 2.5 | 1782 | $2,125 | $1.19 | 23d | 1 | 0.26mi |
| 78 Gaston Ct Saint Augustine, FL | 3.0 | 2.5 | 1635 | $2,250 | $1.38 | 23d | 1 | 0.32mi |
| 72 Ben Ct Saint Augustine, FL | 4.0 | 3.0 | 2289 | $2,875 | $1.26 | 20d | 1 | 0.33mi |
| 98 Neighbor CIR St Augustine, FL | 4.0 | 2.5 | 2299 | $2,400 | $1.04 | 23d | 1 | 0.65mi |
| 36 Viceroy Ct Saint Augustine, FL | 3.0 | 2.5 | 1631 | $2,850 | $1.75 | 17d | 1 | 0.74mi |
| 18 Longtail Dr Saint Augustine, FL | 2.0–3.0 | 2.0–2.5 | 1714 | $3,142 | $1.83 | 1d | 9 | 0.84mi |
HOA detail
- Monthly dues
- $20 · $240/yr
- Likely covers
- water
Listing history 3 events
-
2026-05-04status Pending
-
2026-04-07$342,500 Active
-
2025-09-22soldstatus $708,100
ⓘ Source: listings_history table (triggers on properties + properties_extension) + one-shot
backfill from property_details.listing_events for pre-trigger history.
Tax reassessment forecast FL · Resets to sale price
- Current annual tax
- $3,309 · $276/mo
- Projected year-2 tax
- $3,309 · $276/mo
- Expected delta
- $0/yr ($0/mo · 0.0%)
ⓘ Screening estimate from a state-policy table — verify with the county assessor before closing.
Nearby sold comps map
Loading sold comps map…
Walkable amenities ~0.75 mi
Loading nearby amenities…
Taxation est. · year 1
- Rental income
- $31,403
- − Mortgage interest
- −$19,185
- − Property taxes
- −$3,309
- − Insurance
- −$1,712
- − Repairs & maintenance
- −$2,512
- − Management
- −$2,512
- − HOA
- −$240
- − Depreciation
- −$9,964
- Taxable loss
- −$8,032
- Est. tax savings @ 24.0%
- +$1,928
- After-tax cash flow
- $-79/yr
For passive investors: Depreciation is non-cash, so a rental often shows a tax loss while cash-flowing — sheltering income. Rental losses are passive: they offset passive income freely, and up to $25,000/yr can offset ordinary (W-2) income if you actively participate and your MAGI is under $100k (phasing out to $0 by $150k); unused losses carry forward. On sale, claimed depreciation is recaptured at up to 25%, and gains may owe capital-gains tax (a 1031 exchange can defer both). Figures are a year-1 estimate at your 24.0% rate — not tax advice; consult a CPA.
Schools (NCES district)
- District
- St. Johns
- NCES district ID
- 1201740
- Math proficiency
- 75% ▼ -5.00%
- Reading proficiency
- 73% ▼ -2.00%
- Median HH income
- $66,842
- Composite
- 64.31/100
- National rank
- #556
- State rank
- #2 of 73 in FL
Livability — Fruit Cove
- Score
- 69/100
- State rank
- #469
- US rank
- #8490
Category grades
Schools grade is shown separately in the Schools card above.
Census & demographics
- County
- Saint Johns County · 301,599 people
- Metro
- Jacksonville, FL
- Population (ZIP)
- 53,071
- Household income
- $131,020
- Rent vs Own
- Severe rent burden
- 706.0
Population outlook (St. Johns County) Hauer SSP2
- Today (2025)
- 303,941 people
- By 2030
- 342,590 · +12.7%
- By 2040
- 417,328 · +37.3%
- By 2050
- 487,011 · +60.2%
- By 2075
- 635,395 · +109.1%
- By 2100
- 717,469 · +136.1%
Race, ethnicity, and origin ACS 2023
- Neighborhood character
- Predominantly White (75%)
- Race & ethnicity
- White 75% Two or more races 11% Hispanic / Latino 9% Black 6% Asian 3%
- Hispanic origin (detail)
- Mexican 1% Puerto Rican 2% Cuban 2%
- Common ancestry
- Lithuanian 3% Scotch-Irish 3% Slovak 3%
- Foreign-born
- 10% · Canada, Vietnam
- Languages at home
- 87% English-only · Spanish 6% Russian/Polish/Slavic 2% Other Indo-European 2%
Political lean MEDSL · St. Johns
- 2024 margin
- Solid R (+31.4) · D 33.9% · R 65.2%
- 2008→2024 swing
- +0.2pp no change · 2008: -31.6pp · 2024: -31.4pp
- All cycles
- 2024: R+31.4 2020: R+26.7 2016: R+33.4 2012: R+37.8 2008: R+31.6
Not yet ingested
- Civics
- —
Market trends
- HPI YoY
- ▼ -123.26%
- Current HPI
- 259.732
- Rent YoY
- ▲ 0.08%
- Metro
- Jacksonville, FL
- State GDP YoY
- ▲ 3.28%
- F500 in state
- 36
Industry mix (Fortune 500 HQ in FL)
| Industry | F500 HQs | Revenue |
|---|---|---|
| Industrial Technology | 2 | $29B |
|
||
| Insurance | 2 | $17B |
|
||
| Retail | 1 | $60B |
|
||
| Technology Distribution | 1 | $58B |
|
||
| Homebuilding | 1 | $35B |
|
||
| Technology Manufacturing | 1 | $35B |
|
||
Price history
-51.6% since first listed3 events — show timeline
- 2026-05-04 Pending — realMLS
- 2026-04-07 Listed $342,500 realMLS
- 2025-09-22 Sold (Public Records) $708,100 Public Records
Property tax history
+3.2%/yrLatest (2025): $3,309 · +3.2% YoY. Source: county tax records.
Cash-flow waterfall
monthlySold comps — $/sqft
last 12 mo · ≤1 miLoading sold comps…