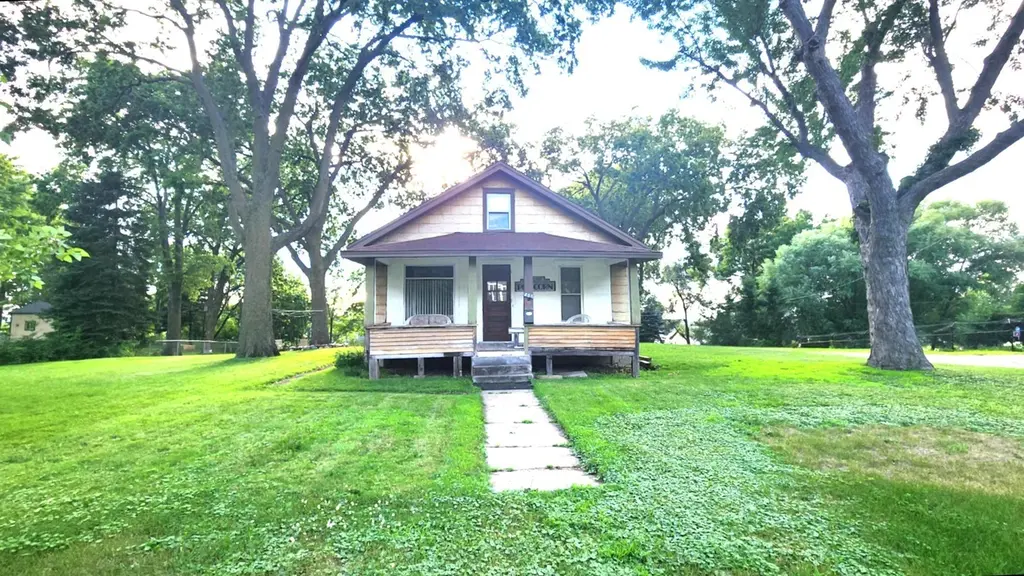
801 Summit Ave · St. Paul Park, MN
Flood risk 1/10 · Minimal
- FEMA flood zone
- X (unshaded)
- Chance of flooding over 30 yrs
- 0.0%
- Est. flood insurance / yr
- $473 – $860
Fire risk 1/10 · Minimal
- Est. fire insurance / yr
- $888 – $1,650
Heat risk 2/10 · Minimal
- Hot days now (above 99°F)
- 7 days/yr
- Hot days in 30 yrs
- 14 days/yr
Wind risk 2/10 · Minimal
- Chance of severe wind over 30 yrs
- —
Air-quality risk 1/10 · Minimal
- Unhealthy air days now
- 0 days/yr
- Unhealthy air days in 30 yrs
- 0 days/yr
Risk factors via First Street. Map © Google.
Why this score? — see what drove the C- grade
The composite is a weighted blend of 9 inputs, each scored 0–100. Each bar is that input's sub-score; the figure is the points it added to the 100-point composite (weight × sub-score).
- Cash flow +15.1/30.0
- ARV discount +15.0/15.0
- Schools +5.2/10.0
- DSCR +4.6/10.0
- 1% rule +4.3/10.0
- Rent growth +2.5/5.0
- Livability +2.5/5.0
- Condition / age +2.5/5.0
- Appreciation +0.0/10.0
$160,000
🖨 Deal sheet 📄 Offer letter ✓ Due diligence
Listing remarks MLS
This spacious .34-acre lot offers a rare chance to renovate or rebuild in a quiet, established neighborhood just minutes from the Mississippi River and downtown St Paul. The existing home is in need of a rehab-or start fresh and build your custom dream home! Bring your ideas and make it yours!
Key facts
- .34-acre lot
- Downtown st paul
- 0.34 acre lot
Tags
Neighborhood map
What this means for you Summary
Snapshot
- This is a 3-bed/1.0-bath single-family listed at $160k.
Deal economics
- At list price, monthly cash flow is $53 ($631/yr) — positive.
- The deal already cash-flows at list — no discount required.
- To meet the 1% rule (rent ≥ 1% of price), the offer needs to be $149k (6.7% below list).
- Recommended offer: $146k (9.0% below list) — sets the bar for market timing.
Location & tenants
- Location reads: area grade C — affects rentability + tenant quality, not the cash-flow math above.
- South Washington County School District (suburban): math 52% / reading 61% proficiency, ranked #40 of 301 in MN (top 13%) — acceptable for families but not a draw, mixed tenant base, ~2y average lease; only 14% free/reduced lunch — higher-income household profile.
- Market conditions: 21 active listings in the ZIP; 3 comparable units currently listed for rent nearby; rentals lingering (median 44d on market — plan ~5-8 weeks vacancy on turnover, expect pricing pressure); 67% of comp listings sitting > 30 days — soft ceiling on asking rent; 1,405 units permitted in Washington County in 2024 (121 in 5+ unit buildings).
Forward outlook
- Local home prices are declining (-3.0%/yr); year-one equity from $1k of loan paydown is wiped out by about $5k of value loss. Plan a longer hold.
- Washington County population projected at +16% by 2050 — long-run rental-demand tailwind backs the buy-and-hold thesis.
Negotiation context
- It's been on market 107 days — a 9% lower offer ($146k) is reasonable based on typical stale-listing flexibility.
- 9 sale attempts since 16y ago; this cycle's ask has dropped $20k (11%) from the opening price — seller is motivated, your offer sets the floor, not the list.
- Current owner paid $60k; list at $160k implies a 167% gain — meaningful room to come down on a strong offer.
Risks & watch-outs
- Watch-outs: built in 1880 — expect roof / HVAC / electrical / plumbing capex.
Questions for the listing agent
- It's been on market 107 days. Have you received any prior offers? Is the seller open to a 9% concession, seller financing, or rate buy-down credit?
- Built in 1880 — when were the roof, HVAC, electrical panel, plumbing, and water heater last replaced?
- Why hasn't it sold? Are there any deal-killer items the seller is aware of (foundation, flood, title, zoning, code violations)?
- Is there a deadline driving the sale (1031 exchange, divorce, estate, relocation)? That informs how much negotiation room exists.
- What's the average days-on-market for RENTAL listings here right now (not sales)? A rising rental-DOM trend means longer vacancies and softer asking-rent achievability than the comps imply.
- What's the recent tenant-quality profile in this submarket — average credit score on applications, eviction rate, late-payment / NSF rate, and stable-employment percentage? A property-management company in the area should have these aggregated.
- How much new for-sale + rental construction is in the pipeline within 1–3 miles? Heavy new supply typically softens prices + rents 12–24 months out; constrained supply supports both.
Investment metrics
- 1% rule
- 0.93% ✗
- Cap rate
- 6.69%
- Cash-on-cash
- 1.41%
- DSCR
- 1.06
- GRM
- 8.9
CMA / ARV
- ARV (median comp)
- $233,771
- List price
- $160,000
- Delta
- -31.56%
- Verdict
- UNDERPRICED
- Comps
- 1 within 2.0 mi
Projected returns pro-forma
-3.0% appreciation · 3.0% rent growth · sell at horizon
- IRR
- -14.0%
- Equity multiple
- 0.50×
- Total profit
- $-22,542
- Equity at exit
- $23,857
- IRR
- -5.2%
- Equity multiple
- 0.66×
- Total profit
- $-15,173
- Equity at exit
- $13,834
Cash invested: $44,800 (down + closing). Projections, not guarantees.
Landlord ↔ Tenant lean methodology
- Overall (STATE)
- 46 Balanced
- State Minnesota
- 46 Balanced · D+2
- County
- — inherits STATE
- City
- — inherits STATE
ZIP-level market 55071
- Home prices YoY
- -22.7%
- Active inventory
- 21
- Price-to-rent
- 8.9×
Monthly cashflow live
- Estimated rent
- $1,492 medium interval (Pro) →
- Mortgage (P&I)
- −$839
- Tax from tax record
- −$220 /mo · $2,646/yr
- Insurance
- −$67
- HOA
- −$0
- Vacancy / Maint / Mgmt
- −$313
- Net cashflow
- $53
Break-even live
UW: 25.0% down · 7.5% · 30yr · 1.5% tax · 5.0% vac · 8.0% maint · 8.0% mgmt
Financing live
Cash to close
- Down payment
- $40,000
- Closing costs
- $4,800
- Reserves months
- —
- Total cash needed
- —
Loan-product check · same deal, 3 products live
Conventional
25% down · 7.5% · 30yr
- Down + closing
- —
- Monthly P&I
- —
- Monthly cashflow
- —
- DSCR
- —
- Eligible?
- —
Personal DTI + credit; lowest rate.
DSCR
20% down · 8.5% · 30yr
- Down + closing
- —
- Monthly P&I
- —
- Monthly cashflow
- —
- DSCR
- —
- Eligible?
- —
No personal income docs; deal must DSCR.
Hard money
10% down · 12.0% · 12mo
- Down + closing
- —
- Monthly P&I
- —
- Monthly cashflow
- —
- DSCR
- —
- Eligible?
- —
Short-term bridge; refi at stabilization.
Rent comps 3 comps
| Address | Beds | Baths | Sqft | Rent | $/sqft | DOM | Units | Dist |
|---|---|---|---|---|---|---|---|---|
| 464 Pullman Ave Unit 6 St Paul Park, MN | 2.0 | 1.0 | 900 | $1,375 | $1.53 | 43d | 1 | 0.55mi |
| 1305 6th St Saint Paul Park, MN | 2.0 | 1.0 | 950 | $1,500 | $1.58 | 43d | 1 | 0.66mi |
| 630 7th Ave Newport, MN | 3.0 | 1.0 | 1100 | $1,700 | $1.55 | 24d | 1 | 1.28mi |
Listing history 29 events
-
2026-06-13statusdays on market $160,000 Pending 107 DOM
-
2026-06-09days on market $160,000 Active 105 DOM
-
2026-06-08days on market $160,000 Active 104 DOM
-
2026-06-07days on market $160,000 Active 103 DOM
-
2026-06-04days on market $160,000 Active 100 DOM
-
2026-06-03days on market $160,000 Active 99 DOM
-
2026-06-02days on market $160,000 Active 98 DOM
-
2026-06-01days on market $160,000 Active 97 DOM
-
2026-05-31days on market $160,000 Active 96 DOM
-
2026-05-01status Active 294-char remark
Show marketing remark (294 chars)
This spacious .34-acre lot offers a rare chance to renovate or rebuild in a quiet, established neighborhood just minutes from the Mississippi River and downtown St Paul. The existing home is in need of a rehab-or start fresh and build your custom dream home! Bring your ideas and make it yours!
-
2026-04-27historical 294-char remark
Show marketing remark (294 chars)
This spacious .34-acre lot offers a rare chance to renovate or rebuild in a quiet, established neighborhood just minutes from the Mississippi River and downtown St Paul. The existing home is in need of a rehab-or start fresh and build your custom dream home! Bring your ideas and make it yours!
-
2026-04-12price $160,000 294-char remark
Show marketing remark (294 chars)
This spacious .34-acre lot offers a rare chance to renovate or rebuild in a quiet, established neighborhood just minutes from the Mississippi River and downtown St Paul. The existing home is in need of a rehab-or start fresh and build your custom dream home! Bring your ideas and make it yours!
-
2026-02-25status Active 294-char remark
Show marketing remark (294 chars)
This spacious .34-acre lot offers a rare chance to renovate or rebuild in a quiet, established neighborhood just minutes from the Mississippi River and downtown St Paul. The existing home is in need of a rehab-or start fresh and build your custom dream home! Bring your ideas and make it yours!
-
2026-02-24historical Contingent - Inspection 294-char remark
Show marketing remark (294 chars)
This spacious .34-acre lot offers a rare chance to renovate or rebuild in a quiet, established neighborhood just minutes from the Mississippi River and downtown St Paul. The existing home is in need of a rehab-or start fresh and build your custom dream home! Bring your ideas and make it yours!
-
2026-02-20$180,000 Active 294-char remark
Show marketing remark (294 chars)
This spacious .34-acre lot offers a rare chance to renovate or rebuild in a quiet, established neighborhood just minutes from the Mississippi River and downtown St Paul. The existing home is in need of a rehab-or start fresh and build your custom dream home! Bring your ideas and make it yours!
-
2026-02-19historical
-
2025-08-18$200,000 Active
-
2013-06-11soldstatus $60,000
-
2013-05-30soldstatus $60,000
-
2013-05-07historical
-
2012-10-22$79,900
-
2012-08-31historical
-
2011-11-23$69,900
-
2011-09-30historical
-
2011-08-30$89,500
-
2011-08-25historical
-
2010-08-25$94,550
-
2010-08-24historical
-
2010-06-02$109,900
ⓘ Source: listings_history table (triggers on properties + properties_extension) + one-shot
backfill from property_details.listing_events for pre-trigger history.
Tax reassessment forecast MN · Partial reset (capped growth)
- Current annual tax
- $2,646 · $220/mo
- Projected year-2 tax
- $2,646 · $220/mo
- Expected delta
- $0/yr ($0/mo · 0.0%)
ⓘ Screening estimate from a state-policy table — verify with the county assessor before closing.
Climate risk First Street
- Flood 1/10 Low FEMA zone X (unshaded) · 0% chance over 30 yrs
- Wildfire 1/10 Low
- Heat 2/10 Low 7 d/yr ≥99°F today · 14 d/yr by 30 yrs out
- Wind 2/10 Low
- Air quality 1/10 Low 0 unhealthy d/yr today · 0 by 30 yrs out
Nearby sold comps map
Loading sold comps map…
Walkable amenities ~0.75 mi
Loading nearby amenities…
Taxation est. · year 1
- Rental income
- $17,906
- − Mortgage interest
- −$8,962
- − Property taxes
- −$2,646
- − Insurance
- −$800
- − Repairs & maintenance
- −$1,432
- − Management
- −$1,432
- − Depreciation
- −$4,655
- Taxable loss
- −$2,022
- Est. tax savings @ 24.0%
- +$485
- After-tax cash flow
- $1,116/yr
For passive investors: Depreciation is non-cash, so a rental often shows a tax loss while cash-flowing — sheltering income. Rental losses are passive: they offset passive income freely, and up to $25,000/yr can offset ordinary (W-2) income if you actively participate and your MAGI is under $100k (phasing out to $0 by $150k); unused losses carry forward. On sale, claimed depreciation is recaptured at up to 25%, and gains may owe capital-gains tax (a 1031 exchange can defer both). Figures are a year-1 estimate at your 24.0% rate — not tax advice; consult a CPA.
Schools (NCES district)
- District
- South Washington County School District
- NCES district ID
- 2733810
- Math proficiency
- 52% ▼ -13.00%
- Reading proficiency
- 61% ▼ -7.00%
- Median HH income
- $88,285
- Composite
- 51.8/100
- National rank
- #1670
- State rank
- #40 of 301 in MN
Livability — St. Paul Park
No livability data for this city. (Only ~50 U.S. cities are tracked.)
Census & demographics
- Census place
- St. Paul Park, MN
- Population (ZIP)
- 5,807
Population outlook (Washington County) Hauer SSP2
- Today (2025)
- 278,554 people
- By 2030
- 290,465 · +4.3%
- By 2040
- 310,014 · +11.3%
- By 2050
- 324,118 · +16.4%
- By 2075
- 362,697 · +30.2%
- By 2100
- 381,491 · +37.0%
Race, ethnicity, and origin ACS 2023
- Neighborhood character
- Predominantly White (78%)
- Race & ethnicity
- White 78% Hispanic / Latino 12% Two or more races 9% Asian 6% Black 3%
- Hispanic origin (detail)
- Mexican 11%
- Common ancestry
- Portuguese 13% Romanian 7% Lithuanian 2%
- Foreign-born
- 4% · Canada, Jamaica
- Languages at home
- 91% English-only · Spanish 6% Other Asian/Pacific 2% French/Haitian/Cajun 1%
Political lean MEDSL · Washington
- 2024 margin
- Lean D (+8.9) · D 53.5% · R 44.6% · Other 1.9%
- 2008→2024 swing
- +4.6pp toward D · 2008: 4.3pp · 2024: 8.9pp
- All cycles
- 2024: D+8.9 2020: D+9.2 2016: D+1.9 2012: D+0.8 2008: D+4.3
Not yet ingested
- Civics
- —
Market trends
- HPI YoY
- ▼ -71.53%
- Current HPI
- 243.5518
- Rent YoY
- —
- Metro
- —
- State GDP YoY
- ▲ 2.41%
- F500 in state
- 34
Industry mix (Fortune 500 HQ in MN)
| Industry | F500 HQs | Revenue |
|---|---|---|
| Healthcare | 2 | $407B |
|
||
| Retail | 2 | $150B |
|
||
| Consumer Goods | 2 | $32B |
|
||
| Industrial Machinery | 2 | $6B |
|
||
| Agriculture | 1 | $40B |
|
||
| Healthcare / Medical Devices | 1 | $32B |
|
||
Price history
+45.6% since first listed20 events — show timeline
- 2026-05-01 Relisted — NORTHSTARMLS as Distributed by MLS Grid
- 2026-04-27 Listing Removed — NORTHSTARMLS as Distributed by MLS Grid
- 2026-04-12 Price Changed $160,000 NORTHSTARMLS as Distributed by MLS Grid
- 2026-02-25 Relisted — NORTHSTARMLS as Distributed by MLS Grid
- 2026-02-24 Contingent — NORTHSTARMLS as Distributed by MLS Grid
- 2026-02-20 Listed $180,000 NORTHSTARMLS as Distributed by MLS Grid
- 2026-02-19 Listing Removed — NORTHSTARMLS as Distributed by MLS Grid
- 2025-08-18 Listed $200,000 NORTHSTARMLS as Distributed by MLS Grid
- 2013-06-11 Sold (Public Records) $60,000 Public Records
- 2013-05-30 Sold (MLS) $60,000 NORTHSTARMLS as Distributed by MLS Grid
- 2013-05-07 Listing Removed — NORTHSTARMLS as Distributed by MLS Grid
- 2012-10-22 Listed $79,900 NORTHSTARMLS as Distributed by MLS Grid
- 2012-08-31 Listing Removed — NORTHSTARMLS as Distributed by MLS Grid
- 2011-11-23 Listed $69,900 NORTHSTARMLS as Distributed by MLS Grid
- 2011-09-30 Listing Removed — NORTHSTARMLS as Distributed by MLS Grid
- 2011-08-30 Listed $89,500 NORTHSTARMLS as Distributed by MLS Grid
- 2011-08-25 Listing Removed — NORTHSTARMLS as Distributed by MLS Grid
- 2010-08-25 Listed $94,550 NORTHSTARMLS as Distributed by MLS Grid
- 2010-08-24 Listing Removed — NORTHSTARMLS as Distributed by MLS Grid
- 2010-06-02 Listed $109,900 NORTHSTARMLS as Distributed by MLS Grid
Property tax history
+1.9%/yrLatest (2025): $2,646 · +6.5% YoY. Source: county tax records.
Cash-flow waterfall
monthlySold comps — $/sqft
last 12 mo · ≤1 miLoading sold comps…