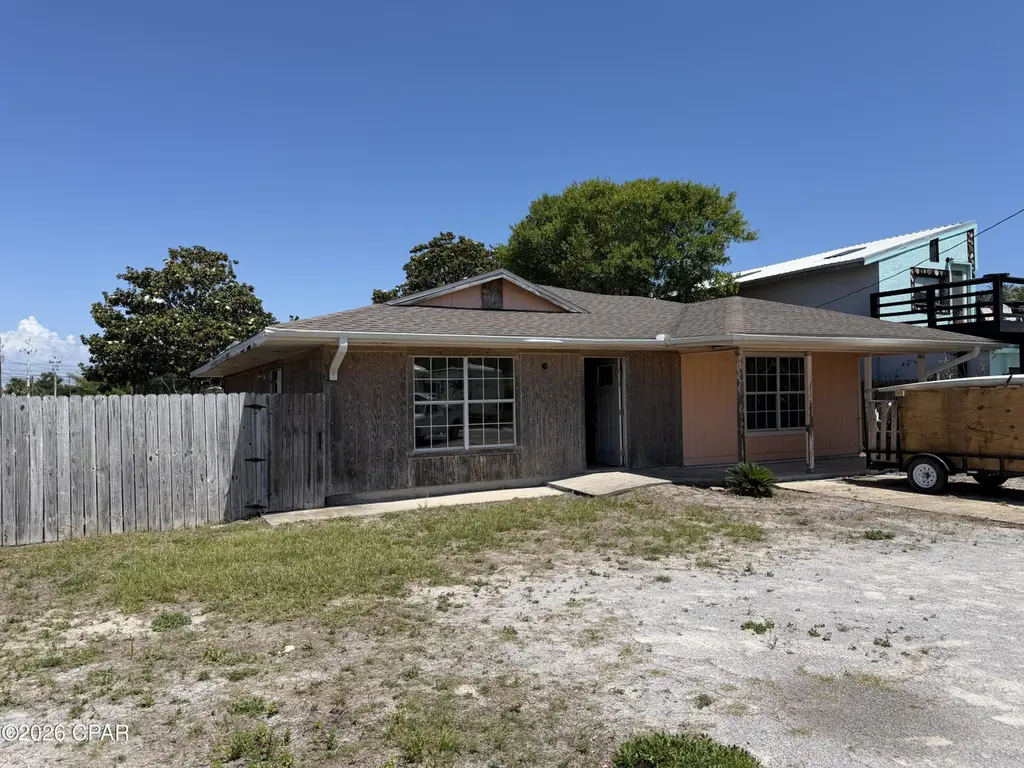
501 Dogwood St · Panama City Beach, FL
Flood risk 1/10 · Minimal
- FEMA flood zone
- X (unshaded)
- Chance of flooding over 30 yrs
- 0.0%
- Est. flood insurance / yr
- $507 – $1,088
Fire risk 5/10 · Moderate
- Est. fire insurance / yr
- $947 – $1,759
Heat risk 10/10 · Severe
- Hot days now (above 105°F)
- 7 days/yr
- Hot days in 30 yrs
- 21 days/yr
Wind risk 9/10 · Severe
- Chance of severe wind over 30 yrs
- 99.0%
Air-quality risk 1/10 · Minimal
- Unhealthy air days now
- 0 days/yr
- Unhealthy air days in 30 yrs
- 0 days/yr
Risk factors via First Street. Map © Google.
Why this score? — see what drove the C grade
The composite is a weighted blend of 9 inputs, each scored 0–100. Each bar is that input's sub-score; the figure is the points it added to the 100-point composite (weight × sub-score).
- Cash flow +18.3/30.0
- ARV discount +15.0/15.0
- DSCR +5.7/10.0
- Schools +4.3/10.0
- 1% rule +4.1/10.0
- Livability +3.9/5.0
- Condition / age +2.5/5.0
- Rent growth +2.4/5.0
- Appreciation +0.0/10.0
$250,000
🖨 Deal sheet (PDF) 📄 Offer letter ✓ Due diligence
Listing remarks MLS
LISTING OFFICE IS A BNON. LISTING AGENT IS A BNONA.
Key facts
- Driveway
- Tile flooring
- Fenced yard area
Tags
Property features AI
Exterior
- Utilities: Electricity available; Public sewer
- Exterior features: Lot dimensions approximately 60 x 120
Interior
- Bedrooms: Primary bedroom
- Bathrooms: 2 full bathrooms
- Interior features: Living room (22 x 17); Bonus room (17 x 18)
Neighborhood map
What this means for you Summary
Snapshot
- This is a 3-bed/2.0-bath single-family listed at $250k.
Deal economics
- At list price, monthly cash flow is $227 ($3k/yr) — positive.
- The deal already cash-flows at list — no discount required.
- To meet the 1% rule (rent ≥ 1% of price), the offer needs to be $227k (9.3% below list).
- Recommended offer: $227k (9.3% below list) — sets the bar for 1% rule.
- Cap rate 7.4% vs local median 2.6% in Panama City Beach — top-decile yield for the area; either an underpriced asset or a hidden risk that comps aren't pricing in. Stress-test before assuming the spread holds.
Location & tenants
- Location reads 78/100 on livability (#172 in FL, #2,624 nationally) — a middle-class / working-renter tenant base. Strengths: crime A+, housing A+, health & safety A+; Watch: amenities D-, commute F.
- Bay (suburban): math 51% / reading 51% proficiency, ranked #29 of 73 in FL (top 40%) — acceptable for families but not a draw, mixed tenant base, ~2y average lease.
- Market conditions: Rents soft (-0.2%/yr); 702 active listings in the ZIP; 12 comparable units currently listed for rent nearby; rentals at typical pace (median 14d on market — plan ~3-4 weeks tenant-placement turnaround); solid renter incomes; 2,473 units permitted in Bay County in 2024 (559 in 5+ unit buildings).
- This rent runs 34% of the median local income ($81k/yr) — at the standard rent-burdened threshold; future hikes will face affordability resistance.
Forward outlook
- Local home prices are declining (-3.0%/yr); year-one equity from $2k of loan paydown is wiped out by about $8k of value loss. Plan a longer hold.
- Bay County population projected at +24% by 2050 — long-run rental-demand tailwind backs the buy-and-hold thesis.
Negotiation context
- Only 7 days on market — expect competitive offers; lowballing is unlikely to land.
- 3 sale attempts since 29y ago with the ask held roughly flat each time — persistent listings suggest the price (not the market) is what's stuck; bring a comps-based counter.
- Current owner paid $50k; list at $250k implies a 401% gain — meaningful room to come down on a strong offer.
Risks & watch-outs
- Climate carrying-cost: severe wind risk, 99% chance of damaging wind over 30y; moderate wildfire risk; extreme-heat days projected 7→21/yr by 2055 (HVAC capex compounding) — expect insurance premiums to compound above CPI over the hold.
Questions for the listing agent
- Is there a deadline driving the sale (1031 exchange, divorce, estate, relocation)? That informs how much negotiation room exists.
- Schools are B-rated — typically a magnet for longer-tenancy family renters. What's the average tenant stay here, and is there a school-zone premium baked into asking?
- What's the average days-on-market for RENTAL listings here right now (not sales)? A rising rental-DOM trend means longer vacancies and softer asking-rent achievability than the comps imply.
- What's the recent tenant-quality profile in this submarket — average credit score on applications, eviction rate, late-payment / NSF rate, and stable-employment percentage? A property-management company in the area should have these aggregated.
- How much new for-sale + rental construction is in the pipeline within 1–3 miles? Heavy new supply typically softens prices + rents 12–24 months out; constrained supply supports both.
Investment metrics
- 1% rule
- 0.91% ✗
- Cap rate
- 7.38%
- Cash-on-cash
- 3.90%
- DSCR
- 1.17
- GRM
- 9.2
CMA / ARV
- ARV (on-the-fly)
- $437,184
- Comps found
- 12
Show comp detail 12 sales within ~0.75 mi
| Address | Dist | Beds/Ba | Sqft | Sold | Price | $/sf | Match |
|---|---|---|---|---|---|---|---|
| 501 Dogwood St | 0.00mi | 3/2.0 | 1,584 (0%) | 0mo | $210,000 | $133 | 100 |
| 224 Wiregrass Ln | 0.32mi | 3/2.0 | 1,503 (-5%) | 2mo | $465,000 | $309 | 75 |
| 621 Albatross St | 0.45mi | 4/2.0 (+1) | 1,582 (-0%) | 4mo | $685,000 | $433 | 71 |
| 222 Wiregrass Ln | 0.33mi | 3/2.5 | 1,665 (+5%) | 5mo | $432,500 | $260 | 70 |
| 613 Gardenia St | 0.25mi | 3/2.0 | 1,404 (-11%) | 1mo | $330,000 | $235 | 68 |
| 200 Wiregrass Ln | 0.46mi | 3/2.5 | 1,662 (+5%) | 4mo | $600,000 | $361 | 65 |
| 511 Beth St | 0.19mi | 4/3.0 (+1) | 1,790 (+13%) | 3mo | $415,000 | $232 | 58 |
| 307 Argonaut St | 0.51mi | 3/2.0 | 1,400 (-12%) | 4mo | $410,000 | $293 | 54 |
| 103 Johns Island Way | 0.65mi | 3/2.0 | 1,808 (+14%) | 3mo | $499,900 | $276 | 43 |
| 109 Johns Island Way | 0.70mi | 3/2.0 | 1,816 (+15%) | 2mo | $499,900 | $275 | 41 |
| 201 Birdie Ln | 0.65mi | 3/2.0 | 1,346 (-15%) | 4mo | $380,000 | $282 | 41 |
| 119 Johns Island Way | 0.66mi | 4/2.0 (+1) | 1,806 (+14%) | 5mo | $482,500 | $267 | 37 |
Match score weights: distance 35% · size 25% · config 20% · recency 20%. Top-matched comps best support the ARV.
Projected returns pro-forma
-3.0% appreciation · 0.0% rent growth · sell at horizon
- IRR
- -13.4%
- Equity multiple
- 0.53×
- Total profit
- $-32,747
- Equity at exit
- $37,276
- IRR
- -9.5%
- Equity multiple
- 0.49×
- Total profit
- $-35,820
- Equity at exit
- $21,615
Cash invested: $70,000 (down + closing). Projections, not guarantees.
Landlord ↔ Tenant lean methodology
- Overall (STATE)
- 87 Strongly Landlord-Friendly
- State Florida
- 87 Strongly Landlord-Friendly · R+3
- County
- — inherits STATE
- City
- — inherits STATE
ZIP-level market 32407
- Home prices YoY
- -29.5%
- Rents YoY
- -0.2%
- Active inventory
- 702
- Price-to-rent
- 9.2×
Monthly cashflow live
- Estimated rent
- $2,267 high interval (Pro) →
- Mortgage (P&I)
- −$1,311
- Tax from tax record
- −$148 /mo · $1,777/yr
- Insurance
- −$104
- HOA
- −$0
- Vacancy / Maint / Mgmt
- −$476
- Net cashflow
- $227
Break-even live
Sensitivity live
| Price | -10% $369 | -5% $298 | +0% $227 | +5% $156 | +10% $86 |
|---|---|---|---|---|---|
| Rent | -10% $48 | -5% $138 | +0% $227 | +5% $317 | +10% $406 |
| Rate | -1.0pp $353 | -0.5pp $291 | base $227 | +0.5pp $162 | +1.0pp $97 |
UW: 25.0% down · 7.5% · 30yr · 1.5% tax · 5.0% vac · 8.0% maint · 8.0% mgmt
Financing live
Cash to close
- Down payment
- $62,500
- Closing costs
- $7,500
- Reserves months
- —
- Total cash needed
- —
Loan-product check · same deal, 3 products live
Conventional
25% down · 7.5% · 30yr
- Down + closing
- —
- Monthly P&I
- —
- Monthly cashflow
- —
- DSCR
- —
- Eligible?
- —
Personal DTI + credit; lowest rate.
DSCR
20% down · 8.5% · 30yr
- Down + closing
- —
- Monthly P&I
- —
- Monthly cashflow
- —
- DSCR
- —
- Eligible?
- —
No personal income docs; deal must DSCR.
Hard money
10% down · 12.0% · 12mo
- Down + closing
- —
- Monthly P&I
- —
- Monthly cashflow
- —
- DSCR
- —
- Eligible?
- —
Short-term bridge; refi at stabilization.
Rent comps 12 comps
| Address | Beds | Baths | Sqft | Rent | $/sqft | DOM | Units | Dist |
|---|---|---|---|---|---|---|---|---|
| 900 Clara Ave Panama City Beach, FL | 1.0–3.0 | 1.0–2.0 | 1134 | $2,175 | $1.92 | 14d | 15 | 0.63mi |
| 14108 Pelican St Panama City Beach, FL | 4.0 | 3.0 | 1832 | $2,700 | $1.47 | 14d | 1 | 0.65mi |
| 303 Lighthouse Rd Panama City Beach, FL | 4.0 | 3.0 | 1400 | $1,900 | $1.36 | 22d | 1 | 0.72mi |
| 201 Cape Cod Dr Panama City Beach, FL | 3.0 | 2.0 | 1195 | $1,700 | $1.42 | 22d | 1 | 0.74mi |
| 1105 Clara Ave Panama City Beach, FL | 3.0 | 1.0–2.0 | 938 | $2,099 | $2.24 | 14d | 14 | 0.81mi |
| 901 Pelican Pl Panama City Beach, FL | 2.0 | 2.0 | 1746 | $1,650 | $0.95 | 22d | 1 | 0.92mi |
| 302 Cabana Blvd Panama City Beach, FL | 1.0–3.0 | 1.0–2.0 | 1184 | $1,806 | $1.53 | 14d | 15 | 0.95mi |
| 335 Madison Cir Panama City Beach, FL | 3.0 | 3.0 | 1682 | $2,599 | $1.55 | 22d | 1 | 1.03mi |
| 12011 Front Beach Rd Unit 1523327P Panama City Beach, FL | 2.0 | 2.0 | 1076 | $3,796 | $3.53 | 14d | 1 | 1.10mi |
| 14701 Front Beach Rd Unit 1523326P Panama City Beach, FL | 2.0 | 2.0 | 1302 | $3,263 | $2.51 | 22d | 1 | 1.16mi |
| 800 Grand Panama Blvd Panama City Beach, FL | 3.0 | 1.0–2.0 | 978 | $2,699 | $2.76 | 14d | 30 | 1.19mi |
| 11709 Seashore Ln Panama City Beach, FL | 3.0 | 2.0 | 1269 | $2,300 | $1.81 | 14d | 1 | 1.38mi |
Listing history 7 events
-
2026-05-19$250,000 Active
-
2021-12-14historical
-
2010-08-23$179,000
-
1997-08-15$49,900 51-char remark
Show marketing remark (51 chars)
LISTING OFFICE IS A BNON. LISTING AGENT IS A BNONA.
-
1997-07-30soldstatus $49,900 51-char remark
Show marketing remark (51 chars)
LISTING OFFICE IS A BNON. LISTING AGENT IS A BNONA.
-
1997-07-01soldstatus $49,900
-
1984-04-01soldstatus $11,000
ⓘ Source: listings_history table (triggers on properties + properties_extension) + one-shot
backfill from property_details.listing_events for pre-trigger history.
Tax reassessment forecast FL · Resets to sale price
- Current annual tax
- $1,777 · $148/mo
- Projected year-2 tax
- $2,075 · $173/mo
- Expected delta
- +$298/yr (+$25/mo · 16.7%)
ⓘ Screening estimate from a state-policy table — verify with the county assessor before closing.
Climate risk First Street
- Flood 1/10 Low FEMA zone X (unshaded) · 0% chance over 30 yrs
- Wildfire 5/10 Major
- Heat 10/10 Extreme 7 d/yr ≥105°F today · 21 d/yr by 30 yrs out
- Wind 9/10 Extreme 99% chance of damaging wind over 30 yrs
- Air quality 1/10 Low 0 unhealthy d/yr today · 0 by 30 yrs out
Nearby sold comps map
Loading sold comps map…
Walkable amenities ~0.75 mi
Loading nearby amenities…
Taxation est. · year 1
- Rental income
- $27,198
- − Mortgage interest
- −$14,004
- − Property taxes
- −$1,777
- − Insurance
- −$1,250
- − Repairs & maintenance
- −$2,176
- − Management
- −$2,176
- − Depreciation
- −$7,273
- Taxable loss
- −$1,457
- Est. tax savings @ 24.0%
- +$350
- After-tax cash flow
- $3,077/yr
For passive investors: Depreciation is non-cash, so a rental often shows a tax loss while cash-flowing — sheltering income. Rental losses are passive: they offset passive income freely, and up to $25,000/yr can offset ordinary (W-2) income if you actively participate and your MAGI is under $100k (phasing out to $0 by $150k); unused losses carry forward. On sale, claimed depreciation is recaptured at up to 25%, and gains may owe capital-gains tax (a 1031 exchange can defer both). Figures are a year-1 estimate at your 24.0% rate — not tax advice; consult a CPA.
Schools (NCES district)
- District
- Bay
- NCES district ID
- 1200090
- Math proficiency
- 51% ▼ -8.00%
- Reading proficiency
- 51% ▼ -7.00%
- Median HH income
- $47,740
- Composite
- 43.41/100
- National rank
- #3014
- State rank
- #29 of 73 in FL
Livability — Panama City Beach
- Score
- 78/100
- State rank
- #172
- US rank
- #2624
Category grades
Schools grade is shown separately in the Schools card above.
Census & demographics
- Census place
- Panama City Beach, FL
- County
- Bay County · 163,593 people
- City population
- 50,689
- Metro
- Panama City, FL
- Population (ZIP)
- 16,404
- Household income
- $80,831
- Rent vs Own
- Severe rent burden
- 939.0
Population outlook (Bay County) Hauer SSP2
- Today (2025)
- 206,264 people
- By 2030
- 217,740 · +5.6%
- By 2040
- 238,738 · +15.7%
- By 2050
- 255,545 · +23.9%
- By 2075
- 288,295 · +39.8%
- By 2100
- 288,638 · +39.9%
Race, ethnicity, and origin ACS 2023
- Neighborhood character
- Predominantly White (73%)
- Race & ethnicity
- White 73% Black 10% Two or more races 9% Hispanic / Latino 8% Asian 2%
- Hispanic origin (detail)
- Mexican 2% Puerto Rican 2%
- Common ancestry
- Lithuanian 4% Italian 3% Portuguese 2%
- Foreign-born
- 12% · Canada, Jamaica, South Korea
- Languages at home
- 89% English-only · Spanish 6% Other Indo-European 1% Russian/Polish/Slavic 1%
Political lean MEDSL · Bay
- 2024 margin
- Solid R (+47.4) · D 25.8% · R 73.1% · Other 1.1%
- 2008→2024 swing
- -6.6pp toward R · 2008: -40.7pp · 2024: -47.4pp
- All cycles
- 2024: R+47.4 2020: R+43.5 2016: R+46.3 2012: R+43.6 2008: R+40.7
Not yet ingested
- Civics
- —
Market trends
- HPI YoY
- ▼ -116.39%
- Current HPI
- 277.8875
- Rent YoY
- ▼ -0.25%
- Metro
- Panama City, FL
- State GDP YoY
- ▲ 3.28%
- F500 in state
- 36
Industry mix (Fortune 500 HQ in FL)
| Industry | F500 HQs | Revenue |
|---|---|---|
| Industrial Technology | 2 | $29B |
|
||
| Insurance | 2 | $17B |
|
||
| Retail | 1 | $60B |
|
||
| Technology Distribution | 1 | $58B |
|
||
| Homebuilding | 1 | $35B |
|
||
| Technology Manufacturing | 1 | $35B |
|
||
Price history
+2172.7% since first listed7 events — show timeline
- 2026-05-19 Listed $250,000 CPARMLS
- 2021-12-14 Listing Removed — CPARMLS
- 2010-08-23 Listed $179,000 CPARMLS
- 1997-08-15 Listed $49,900 CPARMLS
- 1997-07-30 Sold (MLS) $49,900 CPARMLS
- 1997-07-01 Sold (Public Records) $49,900 Public Records
- 1984-04-01 Sold (Public Records) $11,000 Public Records
Property tax history
+3.4%/yrLatest (2025): $1,777 · -32.7% YoY. Source: county tax records.
Cash-flow waterfall
monthlySold comps — $/sqft
last 12 mo · ≤1 miLoading sold comps…