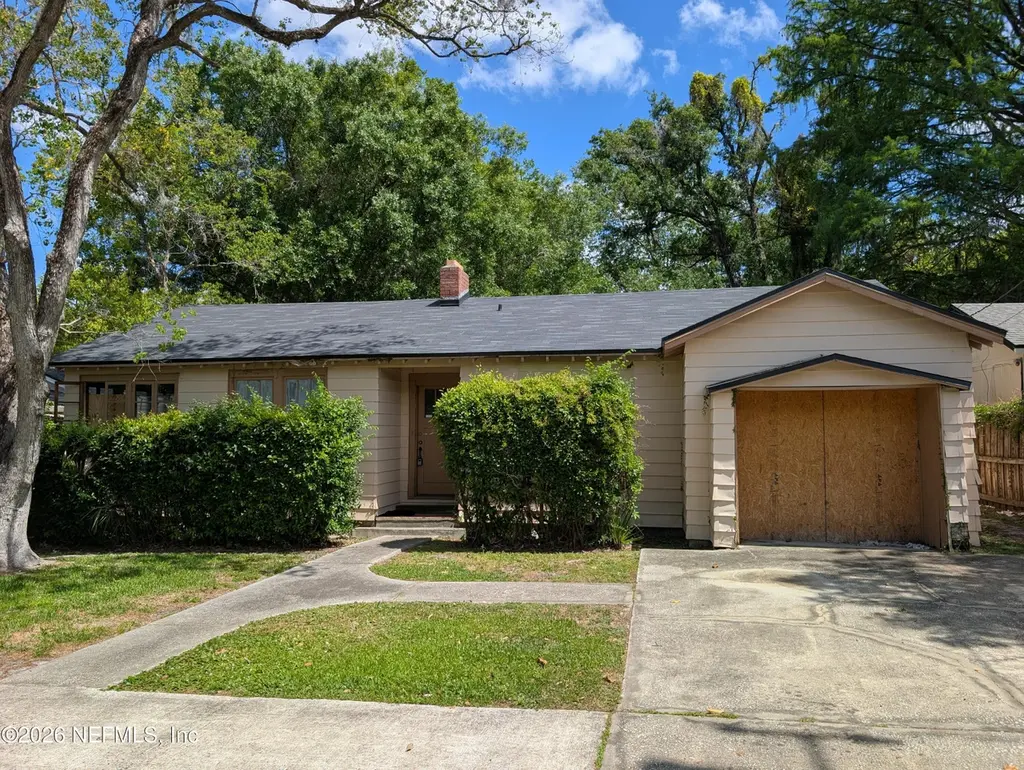
2211 Bayview Rd · Jacksonville, FL
Flood risk 7/10 · Major
- FEMA flood zone
- X (unshaded)
- Chance of flooding over 30 yrs
- 0.75%
- Est. flood insurance / yr
- $507 – $1,088
Fire risk 1/10 · Minimal
- Est. fire insurance / yr
- $947 – $1,759
Heat risk 8/10 · Major
- Hot days now (above 107°F)
- 7 days/yr
- Hot days in 30 yrs
- 20 days/yr
Wind risk 9/10 · Severe
- Chance of severe wind over 30 yrs
- 99.0%
Air-quality risk 5/10 · Moderate
- Unhealthy air days now
- 7 days/yr
- Unhealthy air days in 30 yrs
- 7 days/yr
Risk factors via First Street. Map © Google.
Why this score? — see what drove the B+ grade
The composite is a weighted blend of 9 inputs, each scored 0–100. Each bar is that input's sub-score; the figure is the points it added to the 100-point composite (weight × sub-score).
- Cash flow +28.5/30.0
- ARV discount +15.0/15.0
- DSCR +10.0/10.0
- 1% rule +8.4/10.0
- Livability +4.2/5.0
- Schools +3.9/10.0
- Rent growth +3.0/5.0
- Condition / age +2.5/5.0
- Appreciation +0.0/10.0
$139,980
🖨 Deal sheet 📄 Offer letter ✓ Due diligence
Listing remarks
Attention investors and house hackers, this is a great blank canvas to pick up and finish. Demo'd and renovation started inside. There are no interior pics. You are required to do all your own due diligence. Property is only available to direct buyers and/or their agents. No contract assignments. No wholesaling. No advertising the contract. Price will not be reduced after inspection. Cash or Hard Money only. All offers will be considered
Key facts
- 8,276 sq ft lot
- Garage
- Built 1939
Neighborhood map
What this means for you Summary
Snapshot
- This is a 3-bed/1.0-bath single-family listed at $140k.
Deal economics
- At list price, monthly cash flow is $390 ($5k/yr) — positive.
- The deal already cash-flows at list — no discount required.
- Meets the 1% rule at list price ($2k rent vs $140k).
- Cap rate 10.2% vs local median 4.0% in Jacksonville — top-decile yield for the area; either an underpriced asset or a hidden risk that comps aren't pricing in. Stress-test before assuming the spread holds.
Location & tenants
- Location reads 83/100 on livability (#50 in FL, #911 nationally) — a professional / high-income tenant draw. Strengths: amenities A+, commute A+, housing A+.
- Duval (urban): math 46% / reading 45% proficiency, ranked #48 of 73 in FL (top 66%) — families likely to look elsewhere, expect single-tenant / working-renter base with shorter leases.
- Market conditions: Rents rising (+2.1%/yr); 441 active listings in the ZIP; 40 comparable units currently listed for rent nearby; rentals at typical pace (median 15d on market — plan ~3-4 weeks tenant-placement turnaround); 6,503 units permitted in Duval County in 2024 (1,131 in 5+ unit buildings).
- This rent runs 37% of the median local income ($61k/yr) — at the standard rent-burdened threshold; future hikes will face affordability resistance.
Forward outlook
- Local home prices are declining (-3.0%/yr); year-one equity from $968 of loan paydown is wiped out by about $4k of value loss. Plan a longer hold.
- Duval County population projected at +19% by 2050 — long-run rental-demand tailwind backs the buy-and-hold thesis.
Negotiation context
- Only 7 days on market — expect competitive offers; lowballing is unlikely to land.
Risks & watch-outs
- Watch-outs: flood insurance adds $66/mo; built in 1939 — expect roof / HVAC / electrical / plumbing capex.
- Climate carrying-cost: major flood risk; severe wind risk, 99% chance of damaging wind over 30y; extreme-heat days projected 7→20/yr by 2055 (HVAC capex compounding) — expect insurance premiums to compound above CPI over the hold.
Questions for the listing agent
- Built in 1939 — when were the roof, HVAC, electrical panel, plumbing, and water heater last replaced?
- What's the actual annual flood-insurance premium (NFIP or private), and is the property in a SFHA with mandatory coverage?
- Is there a deadline driving the sale (1031 exchange, divorce, estate, relocation)? That informs how much negotiation room exists.
- Schools are B-rated — typically a magnet for longer-tenancy family renters. What's the average tenant stay here, and is there a school-zone premium baked into asking?
- What's the average days-on-market for RENTAL listings here right now (not sales)? A rising rental-DOM trend means longer vacancies and softer asking-rent achievability than the comps imply.
- What's the recent tenant-quality profile in this submarket — average credit score on applications, eviction rate, late-payment / NSF rate, and stable-employment percentage? A property-management company in the area should have these aggregated.
- How much new for-sale + rental construction is in the pipeline within 1–3 miles? Heavy new supply typically softens prices + rents 12–24 months out; constrained supply supports both.
Investment metrics
- 1% rule
- 1.34% ✓
- Cap rate
- 10.21%
- Cash-on-cash
- 13.98%
- DSCR
- 1.62
- GRM
- 6.2
CMA / ARV
- ARV (on-the-fly)
- $227,151
- Comps found
- 12
Show comp detail 12 sales within ~0.75 mi
| Address | Dist | Beds/Ba | Sqft | Sold | Price | $/sf | Match |
|---|---|---|---|---|---|---|---|
| 2211 Bayview Rd | 0.00mi | 3/2.0 | 1,269 (0%) | 1mo | $125,000 | $99 | 95 |
| 4615 Sunderland Rd | 0.07mi | 3/1.0 | 1,222 (-4%) | 1mo | $219,000 | $179 | 90 |
| 4609 Cambridge Rd | 0.26mi | 4/2.0 (+1) | 1,270 (+0%) | 1mo | $130,000 | $102 | 78 |
| 4567 Palmer Ave | 0.27mi | 3/1.0 | 1,114 (-12%) | 1mo | $159,000 | $143 | 66 |
| 5044 Colonial Ave | 0.38mi | 3/2.0 | 1,366 (+8%) | 2mo | $250,000 | $183 | 64 |
| 4649 Cambridge Rd | 0.25mi | 2/1.0 (-1) | 1,118 (-12%) | 0mo | $235,000 | $210 | 63 |
| 4819 Irvington Ave | 0.51mi | 3/2.0 | 1,144 (-10%) | 1mo | $197,500 | $173 | 55 |
| 5321 Fremont St | 0.70mi | 3/1.0 | 1,166 (-8%) | 1mo | $231,000 | $198 | 53 |
| 2107 Euclid St | 0.63mi | 3/2.0 | 1,376 (+8%) | 1mo | $430,000 | $313 | 52 |
| 5103 Camille Ave | 0.69mi | 3/1.0 | 1,092 (-14%) | 2mo | $114,000 | $104 | 43 |
| 5757 Cedar Park Ln | 0.72mi | 3/2.0 | 1,449 (+14%) | 1mo | $230,000 | $159 | 38 |
| 4436 Melrose Ave | 0.72mi | 2/2.0 (-1) | 1,080 (-15%) | 0mo | $260,000 | $241 | 32 |
Match score weights: distance 35% · size 25% · config 20% · recency 20%. Top-matched comps best support the ARV.
Projected returns pro-forma
-3.0% appreciation · 2.11% rent growth · sell at horizon
- IRR
- 0.4%
- Equity multiple
- 1.02×
- Total profit
- $607
- Equity at exit
- $20,871
- IRR
- 9.1%
- Equity multiple
- 1.67×
- Total profit
- $26,248
- Equity at exit
- $12,103
Cash invested: $39,194 (down + closing). Projections, not guarantees.
Landlord ↔ Tenant lean methodology
- Overall (STATE)
- 87 Strongly Landlord-Friendly
- State Florida
- 87 Strongly Landlord-Friendly · R+3
- County
- — inherits STATE
- City
- — inherits STATE
ZIP-level market 32210
- Rents YoY
- 2.1%
- Active inventory
- 441
- Price-to-rent
- 6.2×
Monthly cashflow live
- Estimated rent
- $1,870 high interval (Pro) →
- Mortgage (P&I)
- −$734
- Tax from tax record
- −$228 /mo · $2,738/yr
- Insurance
- −$58
- Flood insurance flood zone
- −$66 /mo · $798/yr
- HOA
- −$0
- Vacancy / Maint / Mgmt
- −$393
- Net cashflow
- $390
Break-even live
UW: 25.0% down · 7.5% · 30yr · 1.5% tax · 5.0% vac · 8.0% maint · 8.0% mgmt
Financing live
Cash to close
- Down payment
- $34,995
- Closing costs
- $4,199
- Reserves months
- —
- Total cash needed
- —
Loan-product check · same deal, 3 products live
Conventional
25% down · 7.5% · 30yr
- Down + closing
- —
- Monthly P&I
- —
- Monthly cashflow
- —
- DSCR
- —
- Eligible?
- —
Personal DTI + credit; lowest rate.
DSCR
20% down · 8.5% · 30yr
- Down + closing
- —
- Monthly P&I
- —
- Monthly cashflow
- —
- DSCR
- —
- Eligible?
- —
No personal income docs; deal must DSCR.
Hard money
10% down · 12.0% · 12mo
- Down + closing
- —
- Monthly P&I
- —
- Monthly cashflow
- —
- DSCR
- —
- Eligible?
- —
Short-term bridge; refi at stabilization.
Rent comps 40 comps
| Address | Beds | Baths | Sqft | Rent | $/sqft | DOM | Units | Dist |
|---|---|---|---|---|---|---|---|---|
| 2235 Bayview Rd Jacksonville, FL | 4.0 | 2.0 | 1619 | $2,595 | $1.60 | 7d | 1 | 0.08mi |
| 4614 Birkenhead Rd Jacksonville, FL | 3.0 | 2.0 | 1248 | $1,700 | $1.36 | 14d | 1 | 0.16mi |
| 5032 San Juan Ave Jacksonville, FL | 4.0 | 2.0 | 1760 | $1,789 | $1.02 | 23d | 1 | 0.38mi |
| 4776 Cardinal Blvd Jacksonville, FL | 3.0 | 1.0 | 959 | $1,550 | $1.62 | 23d | 1 | 0.55mi |
| 5140 Janice Cir S Jacksonville, FL | 3.0 | 1.0 | 1215 | $1,335 | $1.10 | 21d | 1 | 0.61mi |
| 3434 Blanding Blvd Jacksonville, FL | 2.0–3.0 | 2.0 | 1101 | $1,800 | $1.63 | 3d | 2 | 0.66mi |
| 3434 Blanding Blvd #201 Jacksonville, FL | 3.0 | 2.0 | 1253 | $1,800 | $1.44 | 17d | 1 | 0.67mi |
| 5324 Fremont St Jacksonville, FL | 3.0 | 2.0 | 1550 | $1,495 | $0.96 | 3d | 1 | 0.69mi |
| 5139 Camille Ave Jacksonville, FL | 3.0 | 2.0 | 1100 | $1,625 | $1.48 | 1d | 1 | 0.69mi |
| 4610 Cedarwood Rd Jacksonville, FL | 3.0 | 1.0 | 1381 | $1,950 | $1.41 | 17d | 1 | 0.72mi |
| 1626 Stimson St Jacksonville, FL | 3.0 | 2.5 | 1368 | $1,641 | $1.20 | 21d | 1 | 0.75mi |
| 5253 Janice Cir S Jacksonville, FL | 4.0 | 1.0 | 1614 | $1,471 | $0.91 | 21d | 1 | 0.77mi |
| 4608 Wheeler Ave Jacksonville, FL | 3.0 | 1.0 | 1025 | $2,000 | $1.95 | 23d | 1 | 0.82mi |
| 4523 Merrimac Ave Jacksonville, FL | 4.0 | 2.0 | 1425 | $1,544 | $1.08 | 3d | 1 | 0.83mi |
| 1760 Mayview Rd Jacksonville, FL | 3.0 | 2.0 | 1721 | $2,500 | $1.45 | 17d | 1 | 0.91mi |
| 1648 Euclid St Jacksonville, FL | 3.0 | 2.0 | 1628 | $2,395 | $1.47 | 14d | 1 | 0.92mi |
| 1480 Stimson St Jacksonville, FL | 3.0 | 1.0 | 1252 | $1,445 | $1.15 | 14d | 1 | 1.00mi |
| 5615 San Juan Ave #208 Jacksonville, FL | 2.0 | 2.0 | 1115 | $1,200 | $1.08 | 23d | 1 | 1.00mi |
| 6026 Wilson Blvd Jacksonville, FL | 4.0 | 3.0 | 1380 | $700 | $0.51 | 23d | 1 | 1.03mi |
| 2039 Niblick Dr Jacksonville, FL | 1.0–2.0 | 1.0–2.0 | 847 | $1,275 | $1.51 | 3d | 10 | 1.03mi |
| 4301 Confederate Point Rd Jacksonville, FL | 3.0 | 1.0–2.0 | 1042 | $1,606 | $1.54 | 3d | 39 | 1.04mi |
| 1554 Geraldine Dr Jacksonville, FL | 3.0 | 2.0 | 1362 | $2,850 | $2.09 | 7d | 1 | 1.05mi |
| 1650 Parrish Pl Jacksonville, FL | 3.0 | 1.0 | 1387 | $2,100 | $1.51 | 23d | 1 | 1.07mi |
| 6066 Wilson Blvd Jacksonville, FL | 3.0 | 3.0 | 1097 | $1,800 | $1.64 | 23d | 1 | 1.09mi |
| 6119 Wilson Blvd Jacksonville, FL | 4.0 | 2.0 | 1302 | $1,395 | $1.07 | 23d | 1 | 1.10mi |
| 4375 Confederate Point Rd Jacksonville, FL | 1.0–3.0 | 1.0–2.5 | 1125 | $1,536 | $1.37 | 2d | 22 | 1.10mi |
| 5821 San Juan Ave Jacksonville, FL | 1.0–3.0 | 1.0–2.0 | 1056 | $1,330 | $1.26 | 3d | 7 | 1.11mi |
| 3946 Saint Johns Ave Jacksonville, FL | 1.0–2.0 | 1.0–2.0 | 900 | $2,486 | $2.76 | 1d | 18 | 1.19mi |
| 1540 Lake Shore Blvd Jacksonville, FL | 3.0 | 2.0 | 1180 | $1,495 | $1.27 | 7d | 1 | 1.20mi |
| 4455 Confederate Point Rd Jacksonville, FL | 1.0–3.0 | 1.0–2.5 | 1045 | $1,599 | $1.53 | 1d | 19 | 1.20mi |
| 5120 Quan Dr Jacksonville, FL | 3.0 | 1.0 | 1454 | $1,250 | $0.86 | 1d | 1 | 1.23mi |
| 1374 Murray Dr Jacksonville, FL | 3.0 | 2.0 | 1338 | $1,950 | $1.46 | 12d | 1 | 1.25mi |
| 1354 Stimson St Jacksonville, FL | 4.0 | 2.0 | 1601 | $2,100 | $1.31 | 23d | 1 | 1.25mi |
| 5256 Clarendon Rd Jacksonville, FL | 3.0 | 2.0 | 1278 | $2,100 | $1.64 | 23d | 1 | 1.25mi |
| 2730 Harvard Ave Jacksonville, FL | 3.0 | 2.0 | 1800 | $3,300 | $1.83 | 17d | 1 | 1.30mi |
| 2836 Ionic Ave Jacksonville, FL | 3.0 | 2.0 | 1675 | $2,600 | $1.55 | 23d | 1 | 1.30mi |
| 6171 Cedar Hills Blvd Jacksonville, FL | 3.0 | 1.0 | 1560 | $1,550 | $0.99 | 7d | 1 | 1.30mi |
| 3607 Colebrooke Dr Jacksonville, FL | 3.0 | 2.0 | 1360 | $1,590 | $1.17 | 3d | 1 | 1.31mi |
| 4020 Angol Pl Jacksonville, FL | 3.0 | 1.0 | 1266 | $1,845 | $1.46 | 17d | 1 | 1.33mi |
| 4102 Angol Pl Jacksonville, FL | 3.0 | 2.0 | 1470 | $1,650 | $1.12 | 4d | 1 | 1.36mi |
Listing history 2 events
-
2026-04-09status Pending
-
2026-04-02$139,980 Active
ⓘ Source: listings_history table (triggers on properties + properties_extension) + one-shot
backfill from property_details.listing_events for pre-trigger history.
Tax reassessment forecast FL · Resets to sale price
- Current annual tax
- $2,738 · $228/mo
- Projected year-2 tax
- $2,738 · $228/mo
- Expected delta
- $0/yr ($0/mo · 0.0%)
ⓘ Screening estimate from a state-policy table — verify with the county assessor before closing.
Climate risk First Street
- Flood 7/10 Severe FEMA zone X (unshaded) · 75% chance over 30 yrs
- Wildfire 1/10 Low
- Heat 8/10 Severe 7 d/yr ≥107°F today · 20 d/yr by 30 yrs out
- Wind 9/10 Extreme 99% chance of damaging wind over 30 yrs
- Air quality 5/10 Major 7 unhealthy d/yr today · 7 by 30 yrs out
Nearby sold comps map
Loading sold comps map…
Walkable amenities ~0.75 mi
Loading nearby amenities…
Taxation est. · year 1
- Rental income
- $22,437
- − Mortgage interest
- −$7,841
- − Property taxes
- −$2,738
- − Insurance
- −$1,497
- − Repairs & maintenance
- −$1,795
- − Management
- −$1,795
- − Depreciation
- −$4,072
- Taxable income
- $2,699
- Est. tax owed @ 24.0%
- −$648
- After-tax cash flow
- $4,034/yr
For passive investors: Depreciation is non-cash, so a rental often shows a tax loss while cash-flowing — sheltering income. Rental losses are passive: they offset passive income freely, and up to $25,000/yr can offset ordinary (W-2) income if you actively participate and your MAGI is under $100k (phasing out to $0 by $150k); unused losses carry forward. On sale, claimed depreciation is recaptured at up to 25%, and gains may owe capital-gains tax (a 1031 exchange can defer both). Figures are a year-1 estimate at your 24.0% rate — not tax advice; consult a CPA.
Schools (NCES district)
- District
- Duval
- NCES district ID
- 1200480
- Math proficiency
- 46% ▼ -11.00%
- Reading proficiency
- 45% ▼ -4.00%
- Median HH income
- $48,987
- Composite
- 38.97/100
- National rank
- #4076
- State rank
- #48 of 73 in FL
Livability — Jacksonville
- Score
- 83/100
- State rank
- #50
- US rank
- #911
Category grades
Schools grade is shown separately in the Schools card above.
Census & demographics
- Census place
- Jacksonville, FL
- County
- Duval County · 1,015,274 people
- City population
- 979,034
- Metro
- Jacksonville, FL
- Population (ZIP)
- 65,729
- Household income
- $61,050
- Rent vs Own
- Severe rent burden
- 3605.0
Population outlook (Duval County) Hauer SSP2
- Today (2025)
- 1,013,010 people
- By 2030
- 1,059,228 · +4.6%
- By 2040
- 1,141,439 · +12.7%
- By 2050
- 1,205,258 · +19.0%
- By 2075
- 1,324,282 · +30.7%
- By 2100
- 1,319,620 · +30.3%
Race, ethnicity, and origin ACS 2023
- Neighborhood character
- Diverse neighborhood (Simpson 0.65)
- Race & ethnicity
- White 43% Black 38% Hispanic / Latino 10% Two or more races 7% Asian 3%
- Hispanic origin (detail)
- Mexican 3% Puerto Rican 3%
- Common ancestry
- Slovak 2% Hispanic 2% Italian 1%
- Foreign-born
- 10% · Canada, Vietnam, China
- Languages at home
- 86% English-only · Spanish 7% French/Haitian/Cajun 2% Tagalog/Filipino 1%
Political lean MEDSL · Duval
- 2024 margin
- Toss-up / Even · D 48.7% · R 50.1% · Other 1.2%
- 2008→2024 swing
- +0.4pp no change · 2008: -1.9pp · 2024: -1.5pp
- All cycles
- 2024: R+1.5 2020: D+3.8 2016: R+1.5 2012: R+3.6 2008: R+1.9
Not yet ingested
- Civics
- —
Market trends
- HPI YoY
- ▼ -314.81%
- Current HPI
- 281.2688
- Rent YoY
- ▲ 2.11%
- Metro
- Jacksonville, FL
- State GDP YoY
- ▲ 3.28%
- F500 in state
- 36
Industry mix (Fortune 500 HQ in FL)
| Industry | F500 HQs | Revenue |
|---|---|---|
| Industrial Technology | 2 | $29B |
|
||
| Insurance | 2 | $17B |
|
||
| Retail | 1 | $60B |
|
||
| Technology Distribution | 1 | $58B |
|
||
| Homebuilding | 1 | $35B |
|
||
| Technology Manufacturing | 1 | $35B |
|
||
Price history
2 events — show timeline
- 2026-04-09 Pending — realMLS
- 2026-04-02 Listed $139,980 realMLS
Property tax history
+6.8%/yrLatest (2025): $2,738 · +12.9% YoY. Source: county tax records.
Cash-flow waterfall
monthlySold comps — $/sqft
last 12 mo · ≤1 miLoading sold comps…