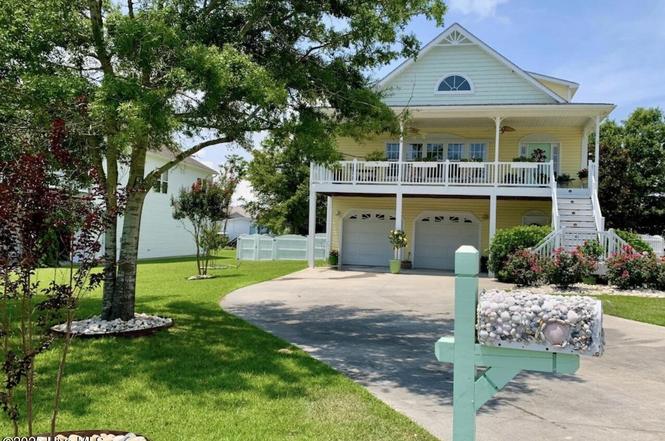
105 Everette Ct · Bogue, NC
Flood risk 1/10 · Minimal
- FEMA flood zone
- X (unshaded)
- Chance of flooding over 30 yrs
- 0.0%
- Est. flood insurance / yr
- $507 – $1,088
Fire risk 3/10 · Minor
- Est. fire insurance / yr
- $906 – $1,684
Heat risk 10/10 · Severe
- Hot days now (above 103°F)
- 8 days/yr
- Hot days in 30 yrs
- 22 days/yr
Wind risk 8/10 · Major
- Chance of severe wind over 30 yrs
- 99.0%
Air-quality risk 2/10 · Minimal
- Unhealthy air days now
- 2 days/yr
- Unhealthy air days in 30 yrs
- 2 days/yr
Risk factors via First Street. Map © Google.
Why this score? — see what drove the B grade
The composite is a weighted blend of 9 inputs, each scored 0–100. Each bar is that input's sub-score; the figure is the points it added to the 100-point composite (weight × sub-score).
- Cash flow +30.0/30.0
- 1% rule +10.0/10.0
- DSCR +10.0/10.0
- ARV discount +7.5/15.0
- Schools +5.1/10.0
- Livability +3.2/5.0
- Rent growth +2.5/5.0
- Condition / age +2.5/5.0
- Appreciation +0.0/10.0
$624,900
🖨 Deal sheet 📄 Offer letter ✓ Due diligence
Listing remarks MLS
**$10,000 BONUS FOR BUYERS TO USE AS YOU CHOOSE! New cons. w/3000+ sf on cul-de-sac. Ground level with laundry, mud room, kitchenette, full bath, bonus area. Main level w/large kitchen, LR w/corner FP, master suite. Top level has additional BRs. Landscaped yard, attached double garage, storage, and great deck with a gorgeous view of the water. A definite must see!
Key facts
- Screened in porch
- Office flex room
- Full in-law suite
Tags
Property features AI
Exterior
- Parking: Attached 2-car garage; 2 total parking spaces; Concrete parking surface
- Utilities: Public water; Septic tank sewer; Water available
- Home design: Single family residence; Three or more levels; 3 stories total; Entry level 2; Vinyl siding and frame construction; Facing: See remarks
- Construction: Built with vinyl siding and frame; Slab foundation; Composition roof
- Exterior features: Covered patio/porch; Deck; Patio; Porch; Screened porch; Vinyl fencing; Paved road access; Located on a cul-de-sac
Interior
- Kitchen: Electric oven; Dishwasher; Microwave; Refrigerator
- Bedrooms: Entry level 2
- Flooring: Carpet; Tile; Vinyl; Wood
- Bathrooms: 4 full bathrooms
- Heating & cooling: Heat pump heating; Electric heating; Heat pump cooling
- Interior features: Vaulted ceilings; Ceiling fans; Pantry; Window coverings
- Laundry & utility: Washer; Dryer; Washer hookup
Neighborhood map
What this means for you Summary
Snapshot
- This is a 3-bed/4.0-bath other listed at $625k.
Deal economics
- At list price, monthly cash flow is $6k ($74k/yr) — positive.
- The deal already cash-flows at list — no discount required.
- Meets the 1% rule at list price ($12k rent vs $625k).
- Recommended offer: $550k (12.0% below list) — sets the bar for market timing.
Location & tenants
- Location reads 65/100 on livability (#311 in NC) — a middle-class / working-renter tenant base. Strengths: employment A+, housing A+, cost of living A; Watch: amenities F, commute F, health & safety D-.
- Carteret County Public Schools (rural): math 59% / reading 61% proficiency, ranked #31 of 178 in NC (top 17%) — acceptable for families but not a draw, mixed tenant base, ~2y average lease.
- Zoned schools: White Oak Elementary (math 76% / reading 65%, grade A-, #88 of 1,410 statewide, top 6%, 772 students, 100% FRL); Broad Creek Middle (math 63% / reading 68%, grade A-, #28 of 475 statewide, top 6%, 710 students, 100% FRL); Croatan High (math 82% / reading 78%, grade A, #73 of 535 statewide, top 13%, 974 students, 26% FRL) — zoned schools average 75% FRL vs 39% district-wide (36 pts higher); higher-poverty schools than district average — tighter screening recommended.
- Zoned-school proficiency averages 72% at this address vs 60% district-wide (+12 pts) — the actual schools serving this property are materially stronger than the Carteret County Public Schools average implies; a family-tenant draw the district grade alone would hide.
- Market conditions: 216 active listings in the ZIP; 935 units permitted in Carteret County in 2024 (360 in 5+ unit buildings).
- At $12,483/mo this rent would consume 213% of the median local household income ($70k/yr) (locally 461% of renters already pay >50% of income on rent) — very limited rent-growth headroom before tenants either downsize or default.
Forward outlook
- Local home prices are declining (-3.0%/yr); year-one equity from $4k of loan paydown is wiped out by about $19k of value loss. Plan a longer hold.
- Carteret County population projected at +9% by 2050 — modest demand growth; plan on rents tracking national, not racing it.
- At projected returns (-3.0% appreciation + 3.0% rent growth), your $175k cash investment doubles in ~3 years — after that, you're playing with house money.
Negotiation context
- It's been on market 235 days — a 12% lower offer ($550k) is reasonable based on typical stale-listing flexibility.
- 6 sale attempts since 21y ago; this cycle's ask has dropped $53k (8%) from the opening price — seller is motivated, your offer sets the floor, not the list.
- Current owner paid $310k; list at $625k implies a 102% gain — meaningful room to come down on a strong offer.
Risks & watch-outs
- Climate carrying-cost: severe wind risk, 99% chance of damaging wind over 30y; extreme-heat days projected 8→22/yr by 2055 (HVAC capex compounding) — expect insurance premiums to compound above CPI over the hold.
Questions for the listing agent
- It's been on market 235 days. Have you received any prior offers? Is the seller open to a 12% concession, seller financing, or rate buy-down credit?
- Why hasn't it sold? Are there any deal-killer items the seller is aware of (foundation, flood, title, zoning, code violations)?
- Is there a deadline driving the sale (1031 exchange, divorce, estate, relocation)? That informs how much negotiation room exists.
- Schools are F-rated, which usually means shorter tenancies and higher turnover. Who's the typical renter profile here, and what's been the actual vacancy rate?
- What's the average days-on-market for RENTAL listings here right now (not sales)? A rising rental-DOM trend means longer vacancies and softer asking-rent achievability than the comps imply.
- What's the recent tenant-quality profile in this submarket — average credit score on applications, eviction rate, late-payment / NSF rate, and stable-employment percentage? A property-management company in the area should have these aggregated.
- How much new for-sale + rental construction is in the pipeline within 1–3 miles? Heavy new supply typically softens prices + rents 12–24 months out; constrained supply supports both.
Investment metrics
- 1% rule
- 2.00% ✓
- Cap rate
- 18.21%
- Cash-on-cash
- 42.55%
- DSCR
- 2.89
- GRM
- 4.2
CMA / ARV
No comps found within radius.
Projected returns pro-forma
-3.0% appreciation · 3.0% rent growth · sell at horizon
- IRR
- 39.3%
- Equity multiple
- 2.68×
- Total profit
- $293,633
- Equity at exit
- $93,175
- IRR
- 45.7%
- Equity multiple
- 5.36×
- Total profit
- $763,576
- Equity at exit
- $54,030
Cash invested: $174,972 (down + closing). Projections, not guarantees.
Landlord ↔ Tenant lean methodology
- Overall (STATE)
- 85 Strongly Landlord-Friendly
- State North Carolina
- 85 Strongly Landlord-Friendly · R+3
- County
- — inherits STATE
- City
- — inherits STATE
ZIP-level market 28570
- Home prices YoY
- -16.2%
- Active inventory
- 216
- Price-to-rent
- 4.2×
Monthly cashflow live
- Estimated rent
- $12,483 medium interval (Pro) →
- Mortgage (P&I)
- −$3,277
- Tax from tax record
- −$120 /mo · $1,446/yr
- Insurance
- −$260
- HOA
- −$0
- Vacancy / Maint / Mgmt
- −$2,621
- Net cashflow
- $6,204
Break-even live
UW: 25.0% down · 7.5% · 30yr · 1.5% tax · 5.0% vac · 8.0% maint · 8.0% mgmt
Financing live
Cash to close
- Down payment
- $156,225
- Closing costs
- $18,747
- Reserves months
- —
- Total cash needed
- —
Loan-product check · same deal, 3 products live
Conventional
25% down · 7.5% · 30yr
- Down + closing
- —
- Monthly P&I
- —
- Monthly cashflow
- —
- DSCR
- —
- Eligible?
- —
Personal DTI + credit; lowest rate.
DSCR
20% down · 8.5% · 30yr
- Down + closing
- —
- Monthly P&I
- —
- Monthly cashflow
- —
- DSCR
- —
- Eligible?
- —
No personal income docs; deal must DSCR.
Hard money
10% down · 12.0% · 12mo
- Down + closing
- —
- Monthly P&I
- —
- Monthly cashflow
- —
- DSCR
- —
- Eligible?
- —
Short-term bridge; refi at stabilization.
Listing history 30 events
-
2026-06-19days on market $624,900 Active 235 DOM
-
2026-06-18days on market $624,900 Active 234 DOM
-
2026-06-17days on market $624,900 Active 233 DOM
-
2026-06-16days on market $624,900 Active 232 DOM
-
2026-06-15days on market $624,900 Active 231 DOM
-
2026-06-14days on market $624,900 Active 229 DOM
-
2026-06-12days on market $624,900 Active 228 DOM
-
2026-06-09days on market $624,900 Active 225 DOM
-
2026-06-08days on market $624,900 Active 224 DOM
-
2026-06-07days on market $624,900 Active 223 DOM
-
2026-06-05days on market $624,900 Active 220 DOM
-
2026-06-03days on market $624,900 Active 219 DOM
-
2026-06-02days on market $624,900 Active 218 DOM
-
2026-06-01days on market $624,900 Active 217 DOM
-
2026-05-31days on market $624,900 Active 216 DOM
-
2026-05-30days on market $624,900 Active 215 DOM
-
2026-04-03price $624,900
-
2026-02-21price $649,999
-
2025-10-27price $679,900
-
2025-10-27$678,000 Active
-
2025-09-30historical
-
2025-03-14$699,900 Active
-
2009-05-15soldstatus $310,000 366-char remark
Show marketing remark (366 chars)
**$10,000 BONUS FOR BUYERS TO USE AS YOU CHOOSE! New cons. w/3000+ sf on cul-de-sac. Ground level with laundry, mud room, kitchenette, full bath, bonus area. Main level w/large kitchen, LR w/corner FP, master suite. Top level has additional BRs. Landscaped yard, attached double garage, storage, and great deck with a gorgeous view of the water. A definite must see!
-
2008-04-22$349,000 366-char remark
Show marketing remark (366 chars)
**$10,000 BONUS FOR BUYERS TO USE AS YOU CHOOSE! New cons. w/3000+ sf on cul-de-sac. Ground level with laundry, mud room, kitchenette, full bath, bonus area. Main level w/large kitchen, LR w/corner FP, master suite. Top level has additional BRs. Landscaped yard, attached double garage, storage, and great deck with a gorgeous view of the water. A definite must see!
-
2008-03-01historical
-
2007-02-19$390,000
-
2006-12-01historical
-
2006-05-27$425,000
-
2006-05-23historical
-
2005-05-23$450,000
ⓘ Source: listings_history table (triggers on properties + properties_extension) + one-shot
backfill from property_details.listing_events for pre-trigger history.
Tax reassessment forecast NC · Resets to sale price
- Current annual tax
- $1,446 · $120/mo
- Projected year-2 tax
- $5,124 · $427/mo
- Expected delta
- +$3,678/yr (+$307/mo · 254.4%)
ⓘ Screening estimate from a state-policy table — verify with the county assessor before closing.
Climate risk First Street
- Flood 1/10 Low FEMA zone X (unshaded) · 0% chance over 30 yrs
- Wildfire 3/10 Moderate
- Heat 10/10 Extreme 8 d/yr ≥103°F today · 22 d/yr by 30 yrs out
- Wind 8/10 Severe 99% chance of damaging wind over 30 yrs
- Air quality 2/10 Low 2 unhealthy d/yr today · 2 by 30 yrs out
Nearby sold comps map
Loading sold comps map…
Walkable amenities ~0.75 mi
Loading nearby amenities…
Taxation est. · year 1
- Rental income
- $149,795
- − Mortgage interest
- −$35,004
- − Property taxes
- −$1,446
- − Insurance
- −$3,124
- − Repairs & maintenance
- −$11,984
- − Management
- −$11,984
- − Depreciation
- −$18,179
- Taxable income
- $68,075
- Est. tax owed @ 24.0%
- −$16,338
- After-tax cash flow
- $58,106/yr
For passive investors: Depreciation is non-cash, so a rental often shows a tax loss while cash-flowing — sheltering income. Rental losses are passive: they offset passive income freely, and up to $25,000/yr can offset ordinary (W-2) income if you actively participate and your MAGI is under $100k (phasing out to $0 by $150k); unused losses carry forward. On sale, claimed depreciation is recaptured at up to 25%, and gains may owe capital-gains tax (a 1031 exchange can defer both). Figures are a year-1 estimate at your 24.0% rate — not tax advice; consult a CPA.
Schools (NCES district)
- District
- Carteret County Public Schools
- NCES district ID
- 3700630
- Math proficiency
- 59% ▲ 5.00%
- Reading proficiency
- 61% ▲ 2.00%
- Median HH income
- $48,330
- Composite
- 50.92/100
- National rank
- #1786
- State rank
- #31 of 178 in NC
Livability — Bogue
- Score
- 65/100
- State rank
- #311
- US rank
- #13024
Category grades
Schools grade is shown separately in the Schools card above.
Census & demographics
- County
- Carteret County · 52,389 people
- Metro
- Morehead City, NC
- Population (ZIP)
- 22,197
- Household income
- $70,229
- Rent vs Own
- Severe rent burden
- 461.0
Population outlook (Carteret County) Hauer SSP2
- Today (2025)
- 73,443 people
- By 2030
- 75,344 · +2.6%
- By 2040
- 78,142 · +6.4%
- By 2050
- 80,091 · +9.1%
- By 2075
- 86,120 · +17.3%
- By 2100
- 89,408 · +21.7%
Race, ethnicity, and origin ACS 2023
- Neighborhood character
- Predominantly White (82%)
- Race & ethnicity
- White 82% Hispanic / Latino 7% Two or more races 6% Black 3% Asian 1%
- Hispanic origin (detail)
- Mexican 4%
- Common ancestry
- Slovak 3% Romanian 3% Lithuanian 2%
- Foreign-born
- 5% · Canada, Dominican Republic
- Languages at home
- 92% English-only · Spanish 6% German/W. Germanic 1%
Political lean MEDSL · Carteret
- 2024 margin
- Solid R (+43.1) · D 28.0% · R 71.1%
- 2008→2024 swing
- -8.4pp toward R · 2008: -34.7pp · 2024: -43.1pp
- All cycles
- 2024: R+43.1 2020: R+42.0 2016: R+44.5 2012: R+41.0 2008: R+34.7
Not yet ingested
- Civics
- —
Market trends
- HPI YoY
- ▼ -53.54%
- Current HPI
- 276.6589
- Rent YoY
- —
- Metro
- Morehead City, NC
- State GDP YoY
- ▲ 3.28%
- F500 in state
- 26
Industry mix (Fortune 500 HQ in NC)
| Industry | F500 HQs | Revenue |
|---|---|---|
| Financial Services | 2 | $213B |
|
||
| Retail | 2 | $95B |
|
||
| Industrial Conglomerate | 1 | $38B |
|
||
| Metals / Steel | 1 | $35B |
|
||
| Utilities | 1 | $30B |
|
||
| Industrial Machinery | 1 | $19B |
|
||
Price history
+38.9% since first listed14 events — show timeline
- 2026-04-03 Price Changed $624,900 Hive MLS
- 2026-02-21 Price Changed $649,999 Hive MLS
- 2025-10-27 Price Changed $679,900 Hive MLS
- 2025-10-27 Listed $678,000 Hive MLS
- 2025-09-30 Listing Removed — Hive MLS
- 2025-03-14 Listed $699,900 Hive MLS
- 2009-05-15 Sold (MLS) $310,000 Hive MLS
- 2008-04-22 Listed $349,000 Hive MLS
- 2008-03-01 Listing Removed — Hive MLS
- 2007-02-19 Listed $390,000 Hive MLS
- 2006-12-01 Listing Removed — Hive MLS
- 2006-05-27 Listed $425,000 Hive MLS
- 2006-05-23 Listing Removed — Hive MLS
- 2005-05-23 Listed $450,000 Hive MLS
Property tax history
+2.2%/yrLatest (2025): $1,446 · +22.6% YoY. Source: county tax records.
Cash-flow waterfall
monthlySold comps — $/sqft
last 12 mo · ≤1 miLoading sold comps…