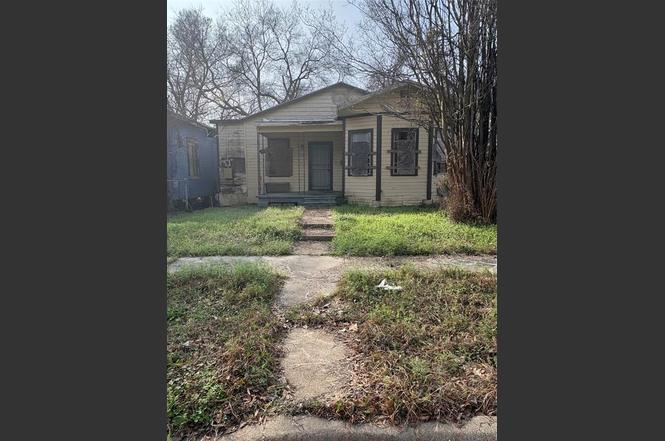
1717 Logan St · Shreveport, LA
Flood risk 1/10 · Minimal
- FEMA flood zone
- X (unshaded)
- Chance of flooding over 30 yrs
- 0.0%
- Est. flood insurance / yr
- $507 – $1,088
Fire risk 1/10 · Minimal
- Est. fire insurance / yr
- $1,269 – $2,357
Heat risk 6/10 · Moderate
- Hot days now (above 110°F)
- 7 days/yr
- Hot days in 30 yrs
- 20 days/yr
Wind risk 6/10 · Moderate
- Chance of severe wind over 30 yrs
- 66.0%
Air-quality risk 2/10 · Minimal
- Unhealthy air days now
- 1 days/yr
- Unhealthy air days in 30 yrs
- 1 days/yr
Risk factors via First Street. Map © Google.
Why this score? — see what drove the D+ grade
The composite is a weighted blend of 9 inputs, each scored 0–100. Each bar is that input's sub-score; the figure is the points it added to the 100-point composite (weight × sub-score).
- Cash flow +15.0/30.0
- ARV discount +7.5/15.0
- 1% rule +5.0/10.0
- DSCR +5.0/10.0
- Appreciation +4.8/10.0
- Livability +3.0/5.0
- Rent growth +2.5/5.0
- Condition / age +2.5/5.0
- Schools +2.2/10.0
$9,999
🖨 Deal sheet 📄 Offer letter ✓ Due diligence
Listing remarks
BACK ON THE MARKET AT NO FAULT TO THE SELLER Investor Special – Rental Opportunity Near Downtown Shreveport Attention investors and landlords! This 2-bedroom, 1-bath home offers an affordable entry point into the Shreveport rental market at just $10,000. Conveniently located approximately 1 mile from Downtown Shreveport, this property provides easy access to employment centers, restaurants, casinos, and major roadways. Situated outside of a flood zone, this home presents a lower-risk option for long-term hold investors seeking to build or expand their rental portfolio. While the surrounding area does not support typical fix-and-flip resale values, the property shows strong pote
Key facts
- 5,489 sq ft lot
- Built 1950
- Listed 119 days
Property features AI
Finance
- Financial info: Selling terms: cash
- HOA & community: No homeowner association
Exterior
- Parking: On-street parking; See remarks regarding parking
- Utilities: City water; City sewer; Electricity available; Municipal utility district; Other utilities (see remarks)
- Home design: Single family residence; Residential property; Built in 1950; Not attached to another property
- Construction: Year built: 1950
- Exterior features: Lot smaller than 0.5 acre (approximately 0.126 acres); Subdivision: Boisseau Annex
Interior
- Kitchen: Refrigerator included
- Bedrooms: 2 bedrooms (primary bedroom on main level)
- Bathrooms: 1 full bathroom
- Interior features: One-level layout; Living area of 1068; Living room; Other interior features
- Laundry & utility: No specific laundry features listed
Neighborhood map
What this means for you Summary
Snapshot
- This is a 3-bed/1.0-bath single-family listed at $10k.
Deal economics
- At list price, monthly cash flow is $612 ($7k/yr) — positive.
- The deal already cash-flows at list — no discount required.
- Meets the 1% rule at list price ($883 rent vs $10k).
- Recommended offer: $9k (9.0% below list) — sets the bar for market timing.
- Cap rate 79.7% vs local median 5.7% in Shreveport — top-decile yield for the area; either an underpriced asset or a hidden risk that comps aren't pricing in. Stress-test before assuming the spread holds.
Location & tenants
- Location reads 59/100 on livability (#270 in LA) — a working-class tenant base; expect higher turnover. Strengths: cost of living A+, housing A; Watch: schools D+, crime F, amenities F.
- Caddo Parish (urban): math 21% / reading 32% proficiency, ranked #53 of 98 in LA (top 54%) — low school quality limits family demand, transient renter base, plan for 1-2y turnover; 64% free/reduced lunch — lower-income household profile, screen leases tightly.
- Market conditions: 61 active listings in the ZIP; 11 comparable units currently listed for rent nearby; rentals lingering (median 44d on market — plan ~5-8 weeks vacancy on turnover, expect pricing pressure); 55% of comp listings sitting > 30 days — soft ceiling on asking rent; lower-income renter base — watch delinquency; 221 units permitted in Caddo Parish in 2024 (0 in 5+ unit buildings).
- At $883/mo this rent would consume 55% of the median local household income ($19k/yr) (locally 702% of renters already pay >50% of income on rent) — very limited rent-growth headroom before tenants either downsize or default.
Forward outlook
- In year one you build about $39 of equity ($69 loan paydown + $-30 appreciation (-0.3% local appreciation)).
- Caddo County population projected at -15% by 2050 — secular population decline; favor cash flow + early exit over multi-decade hold.
- At projected returns (-0.3% appreciation + 3.0% rent growth), your $3k cash investment doubles in ~1 year — after that, you're playing with house money.
Negotiation context
- It's been on market 119 days — a 9% lower offer ($9k) is reasonable based on typical stale-listing flexibility.
- 2 sale attempts with the ask held roughly flat each time — persistent listings suggest the price (not the market) is what's stuck; bring a comps-based counter.
Risks & watch-outs
- Watch-outs: property tax is 3.5% of price; built in 1950 — expect roof / HVAC / electrical / plumbing capex.
- Climate carrying-cost: major wind risk, 66% chance of damaging wind over 30y; extreme-heat days projected 7→20/yr by 2055 (HVAC capex compounding) — expect insurance premiums to compound above CPI over the hold.
Questions for the listing agent
- It's been on market 119 days. Have you received any prior offers? Is the seller open to a 9% concession, seller financing, or rate buy-down credit?
- Built in 1950 — when were the roof, HVAC, electrical panel, plumbing, and water heater last replaced?
- Property tax is high relative to price — has the assessment been appealed recently, and will the sale trigger a re-assessment?
- Why hasn't it sold? Are there any deal-killer items the seller is aware of (foundation, flood, title, zoning, code violations)?
- Is there a deadline driving the sale (1031 exchange, divorce, estate, relocation)? That informs how much negotiation room exists.
- Schools are D-rated, which usually means shorter tenancies and higher turnover. Who's the typical renter profile here, and what's been the actual vacancy rate?
- Crime grade is F in this area — have there been break-ins, vandalism, or insurance claims at this property in the last 3 years? What carrier currently insures it and at what premium?
- The area grade is low — what's the realistic commute time and amenity access for the typical tenant pool here? Any planned neighborhood developments (good or bad) we should know about?
- What's the average days-on-market for RENTAL listings here right now (not sales)? A rising rental-DOM trend means longer vacancies and softer asking-rent achievability than the comps imply.
- What's the recent tenant-quality profile in this submarket — average credit score on applications, eviction rate, late-payment / NSF rate, and stable-employment percentage? A property-management company in the area should have these aggregated.
- How much new for-sale + rental construction is in the pipeline within 1–3 miles? Heavy new supply typically softens prices + rents 12–24 months out; constrained supply supports both.
Investment metrics
- 1% rule
- 8.83% ✓
- Cap rate
- 79.69%
- Cash-on-cash
- 262.13%
- DSCR
- 12.66
- GRM
- 0.9
CMA / ARV
- ARV (on-the-fly)
- $25,632
- Comps found
- 7
Show comp detail 7 sales within ~0.75 mi
| Address | Dist | Beds/Ba | Sqft | Sold | Price | $/sf | Match |
|---|---|---|---|---|---|---|---|
| 1903 Abbie St | 0.23mi | 2/1.0 (-1) | 1,034 (-3%) | 14mo | $25,000 | $24 | 68 |
| 1646 Weinstock St | 0.43mi | 3/1.0 | 1,093 (+2%) | 13mo | $16,000 | $15 | 65 |
| 1856 W Jordan St | 0.61mi | 3/1.0 | 1,088 (+2%) | 19mo | $25,000 | $23 | 52 |
| 1815 Dove St | 0.67mi | 3/1.5 | 1,010 (-5%) | 10mo | $35,000 | $35 | 50 |
| 1658 Ashton St | 0.37mi | 2/1.0 (-1) | 1,200 (+12%) | 12mo | $12,000 | $10 | 47 |
| 2209 Murphy St | 0.69mi | 3/1.5 | 1,187 (+11%) | 3mo | $40,000 | $34 | 45 |
| 112 N Allen Ave | 0.45mi | 2/1.0 (-1) | 926 (-13%) | 15mo | $52,000 | $56 | 40 |
Match score weights: distance 35% · size 25% · config 20% · recency 20%. Top-matched comps best support the ARV.
Projected returns pro-forma
-0.3% appreciation · 3.0% rent growth · sell at horizon
- IRR
- —
- Equity multiple
- 14.77×
- Total profit
- $38,542
- Equity at exit
- $2,754
- IRR
- —
- Equity multiple
- 31.35×
- Total profit
- $84,970
- Equity at exit
- $3,193
Cash invested: $2,800 (down + closing). Projections, not guarantees.
Landlord ↔ Tenant lean methodology
- Overall (STATE)
- 90 Strongly Landlord-Friendly
- State Louisiana
- 90 Strongly Landlord-Friendly · R+12
- County
- — inherits STATE
- City
- — inherits STATE
ZIP-level market 71101
- Home prices YoY
- -0.4%
- Active inventory
- 61
- Price-to-rent
- 0.9×
Monthly cashflow live
- Estimated rent
- $883 high interval (Pro) →
- Mortgage (P&I)
- −$52
- Tax from tax record
- −$29 /mo · $353/yr
- Insurance
- −$4
- HOA
- −$0
- Vacancy / Maint / Mgmt
- −$185
- Net cashflow
- $612
Break-even live
UW: 25.0% down · 7.5% · 30yr · 1.5% tax · 5.0% vac · 8.0% maint · 8.0% mgmt
Financing live
Cash to close
- Down payment
- $2,500
- Closing costs
- $300
- Reserves months
- —
- Total cash needed
- —
Loan-product check · same deal, 3 products live
Conventional
25% down · 7.5% · 30yr
- Down + closing
- —
- Monthly P&I
- —
- Monthly cashflow
- —
- DSCR
- —
- Eligible?
- —
Personal DTI + credit; lowest rate.
DSCR
20% down · 8.5% · 30yr
- Down + closing
- —
- Monthly P&I
- —
- Monthly cashflow
- —
- DSCR
- —
- Eligible?
- —
No personal income docs; deal must DSCR.
Hard money
10% down · 12.0% · 12mo
- Down + closing
- —
- Monthly P&I
- —
- Monthly cashflow
- —
- DSCR
- —
- Eligible?
- —
Short-term bridge; refi at stabilization.
Rent comps 11 comps
| Address | Beds | Baths | Sqft | Rent | $/sqft | DOM | Units | Dist |
|---|---|---|---|---|---|---|---|---|
| 1818 Perrin St Shreveport, LA | 3.0 | 1.5 | 1129 | $895 | $0.79 | 43d | 1 | 0.23mi |
| 1928 Alston St Shreveport, LA | 3.0 | 2.0 | 1100 | $750 | $0.68 | 43d | 1 | 0.46mi |
| 2042 Laurel St Shreveport, LA | 3.0 | 1.0 | 1100 | $800 | $0.73 | 43d | 1 | 0.84mi |
| 2712 Ashton St Shreveport, LA | 2.0 | 1.0 | 875 | $700 | $0.80 | 13d | 1 | 0.89mi |
| 624 Texas St Shreveport, LA | 2.0 | 1.5 | 953 | $2,358 | $2.47 | 13d | 2 | 0.95mi |
| 726 Cotton St Shreveport, LA | 2.0 | 1.0–2.0 | 626 | $1,472 | $2.35 | 43d | 2 | 1.00mi |
| 1719 Lakeshore Dr Shreveport, LA | 3.0 | 1.5 | 1200 | $950 | $0.79 | 43d | 1 | 1.03mi |
| 509 Alabama Ave SE Shreveport, LA | 2.0 | 1.0 | 700 | $700 | $1.00 | 43d | 1 | 1.13mi |
| 719 Edwards St Shreveport, LA | 1.0–2.0 | 1.0 | 810 | $1,275 | $1.57 | 21d | 7 | 1.24mi |
| 3101 Harp St Shreveport, LA | 3.0 | 1.0 | 839 | $850 | $1.01 | 21d | 1 | 1.28mi |
| 1101 College St Shreveport, LA | 2.0 | 2.0 | 1100 | $850 | $0.77 | 13d | 1 | 1.37mi |
Listing history 21 events
-
2026-06-18days on market $9,999 Active 119 DOM
-
2026-06-17days on market $9,999 Active 118 DOM
-
2026-06-16days on market $9,999 Active 117 DOM
-
2026-06-15days on market $9,999 Active 116 DOM
-
2026-06-14days on market $9,999 Active 114 DOM
-
2026-06-13days on market $9,999 Active 113 DOM
-
2026-06-10days on market $9,999 Active 111 DOM
-
2026-06-09days on market $9,999 Active 110 DOM
-
2026-06-08days on market $9,999 Active 109 DOM
-
2026-06-07days on market $9,999 Active 108 DOM
-
2026-06-05days on market $9,999 Active 105 DOM
-
2026-06-03days on market $9,999 Active 104 DOM
-
2026-06-02days on market $9,999 Active 103 DOM
-
2026-06-01days on market $9,999 Active 102 DOM
-
2026-05-31days on market $9,999 Active 101 DOM
-
2026-05-30days on market $9,999 Active 100 DOM
-
2026-05-21status Active
-
2026-04-01historical Active Contingent
-
2026-03-17price $9,999
-
2026-02-19$10,000 Active
-
2006-09-07soldstatus
ⓘ Source: listings_history table (triggers on properties + properties_extension) + one-shot
backfill from property_details.listing_events for pre-trigger history.
Tax reassessment forecast LA · Resets to sale price
- Current annual tax
- $353 · $29/mo
- Projected year-2 tax
- $353 · $29/mo
- Expected delta
- $0/yr ($0/mo · 0.0%)
ⓘ Screening estimate from a state-policy table — verify with the county assessor before closing.
Climate risk First Street
- Flood 1/10 Low FEMA zone X (unshaded) · 0% chance over 30 yrs
- Wildfire 1/10 Low
- Heat 6/10 Major 7 d/yr ≥110°F today · 20 d/yr by 30 yrs out
- Wind 6/10 Major 66% chance of damaging wind over 30 yrs
- Air quality 2/10 Low 1 unhealthy d/yr today · 1 by 30 yrs out
Nearby sold comps map
Loading sold comps map…
Walkable amenities ~0.75 mi
Loading nearby amenities…
Taxation est. · year 1
- Rental income
- $10,596
- − Mortgage interest
- −$560
- − Property taxes
- −$353
- − Insurance
- −$50
- − Repairs & maintenance
- −$848
- − Management
- −$848
- − Depreciation
- −$291
- Taxable income
- $7,647
- Est. tax owed @ 24.0%
- −$1,835
- After-tax cash flow
- $5,504/yr
For passive investors: Depreciation is non-cash, so a rental often shows a tax loss while cash-flowing — sheltering income. Rental losses are passive: they offset passive income freely, and up to $25,000/yr can offset ordinary (W-2) income if you actively participate and your MAGI is under $100k (phasing out to $0 by $150k); unused losses carry forward. On sale, claimed depreciation is recaptured at up to 25%, and gains may owe capital-gains tax (a 1031 exchange can defer both). Figures are a year-1 estimate at your 24.0% rate — not tax advice; consult a CPA.
Schools (NCES district)
- District
- Caddo Parish
- NCES district ID
- 2200300
- Math proficiency
- 21% ▼ -33.00%
- Reading proficiency
- 32% ▼ -30.00%
- Median HH income
- $39,227
- Composite
- 22.23/100
- National rank
- #8148
- State rank
- #53 of 98 in LA
Livability — Shreveport
- Score
- 59/100
- State rank
- #270
- US rank
- #19730
Category grades
Schools grade is shown separately in the Schools card above.
Census & demographics
- Census place
- Shreveport, LA
- County
- Caddo Parish · 178,536 people
- City population
- 164,123
- Metro
- Shreveport-Bossier City, LA
- Population (ZIP)
- 6,415
- Household income
- $19,351
- Rent vs Own
- Severe rent burden
- 702.0
Population outlook (Caddo County) Hauer SSP2
- Today (2025)
- 243,190 people
- By 2030
- 237,231 · -2.5%
- By 2040
- 222,502 · -8.5%
- By 2050
- 206,516 · -15.1%
- By 2075
- 165,706 · -31.9%
- By 2100
- 122,262 · -49.7%
Race, ethnicity, and origin ACS 2023
- Neighborhood character
- Majority Black (63%)
- Race & ethnicity
- Black 63% White 29% Hispanic / Latino 5% Two or more races 2%
- Common ancestry
- Lithuanian 1% Slovak 1%
- Foreign-born
- 2% · China
- Languages at home
- 98% English-only · Tagalog/Filipino 0%
Political lean MEDSL · Caddo
- 2024 margin
- Toss-up / Even · D 51.6% · R 47.0% · Other 1.4%
- 2008→2024 swing
- +1.6pp toward D · 2008: 3.0pp · 2024: 4.6pp
- All cycles
- 2024: D+4.6 2020: D+6.8 2016: D+4.2 2012: D+4.9 2008: D+3.0
Not yet ingested
- Civics
- —
Market trends
- HPI YoY
- ▼ -0.30%
- Current HPI
- 74.2131
- Rent YoY
- —
- Metro
- Shreveport-Bossier City, LA
- State GDP YoY
- ▲ 3.29%
- F500 in state
- 10
Industry mix (Fortune 500 HQ in LA)
| Industry | F500 HQs | Revenue |
|---|---|---|
| Telecommunications | 2 | $23B |
|
||
| Utilities | 1 | $12B |
|
||
| Wholesale / Distribution | 1 | $5B |
|
||
| Advertising | 1 | $2B |
|
||
Price history
-0.0% since first listed5 events — show timeline
- 2026-05-21 Relisted — NTREIS
- 2026-04-01 Contingent — NTREIS
- 2026-03-17 Price Changed $9,999 NTREIS
- 2026-02-19 Listed $10,000 NTREIS
- 2006-09-07 Sold (Public Records) — Public Records
Property tax history
+11.8%/yrLatest (2025): $353 · +0.4% YoY. Source: county tax records.
Cash-flow waterfall
monthlySold comps — $/sqft
last 12 mo · ≤1 miLoading sold comps…