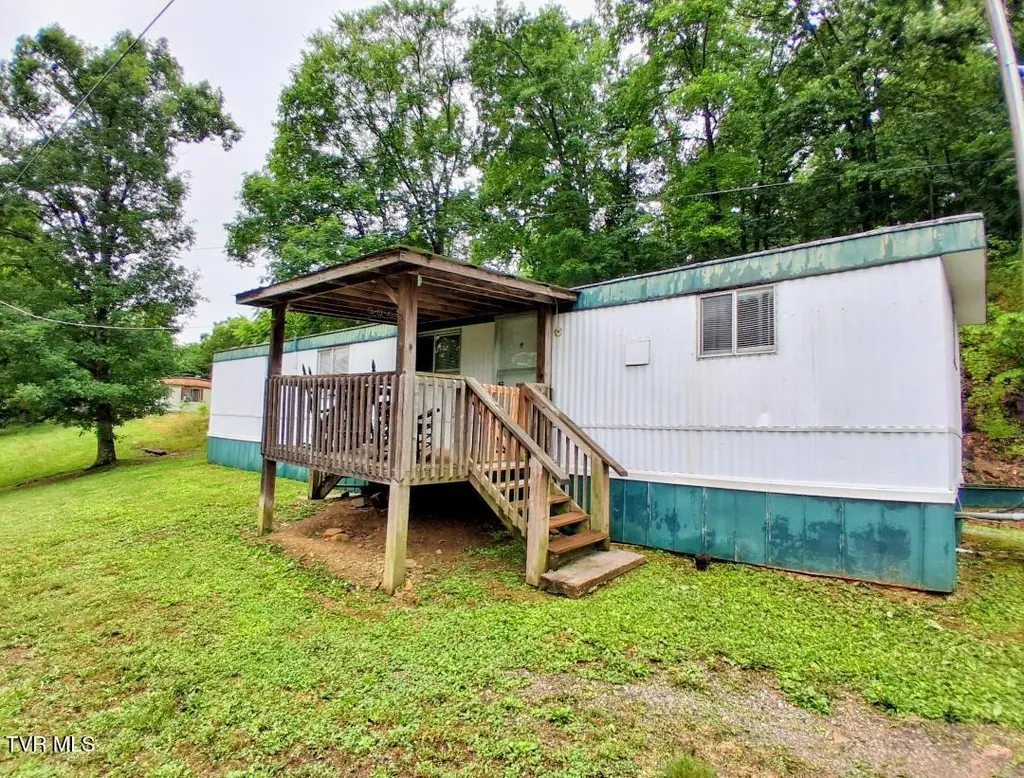
100 Scruggs Ln · Mosheim, TN
Flood risk 1/10 · Minimal
- FEMA flood zone
- X (unshaded)
- Chance of flooding over 30 yrs
- 0.0%
- Est. flood insurance / yr
- $507 – $1,088
Fire risk 5/10 · Moderate
- Est. fire insurance / yr
- $949 – $1,763
Heat risk 5/10 · Moderate
- Hot days now (above 102°F)
- 7 days/yr
- Hot days in 30 yrs
- 20 days/yr
Wind risk 2/10 · Minimal
- Chance of severe wind over 30 yrs
- —
Air-quality risk 3/10 · Minor
- Unhealthy air days now
- 2 days/yr
- Unhealthy air days in 30 yrs
- 3 days/yr
Risk factors via First Street. Map © Google.
Why this score? — see what drove the B- grade
The composite is a weighted blend of 9 inputs, each scored 0–100. Each bar is that input's sub-score; the figure is the points it added to the 100-point composite (weight × sub-score).
- Cash flow +26.6/30.0
- DSCR +9.1/10.0
- Appreciation +8.7/10.0
- ARV discount +7.5/15.0
- 1% rule +7.1/10.0
- Livability +2.9/5.0
- Rent growth +2.5/5.0
- Condition / age +2.5/5.0
- Schools +2.1/10.0
$69,000
🖨 Deal sheet (PDF) 📄 Offer letter ✓ Due diligence
Listing remarks MLS
Reduced to $30,000, Located in the West Greene School district, nice 2BR/1BA singlewide sitting on 1 acre, propane heater and window AC, located on a dead end road conventent to W Andrew Johnson Hwy, great starter home or rental investment
Key facts
- All appliances stay
- Washer dryer stay
- 1 acre
Tags
Property features AI
Exterior
- Utilities: Public water; Septic tank
- Home design: Manufactured house (single wide); One level
- Construction: Aluminum siding; Metal roof
- Exterior features: Covered patio/porch; Level to steep slope topography
Interior
- Kitchen: Microwave
- Flooring: Vinyl
- Bathrooms: 1 full bathroom
- Heating & cooling: Window unit cooling; Electric heating; Propane heating
- Interior features: Microwave; Vinyl flooring; Total of 4 rooms
Neighborhood map
What this means for you Summary
Snapshot
- This is a 2-bed/1.0-bath single-family listed at $69k.
Deal economics
- At list price, monthly cash flow is $184 ($2k/yr) — positive.
- The deal already cash-flows at list — no discount required.
- Meets the 1% rule at list price ($836 rent vs $69k).
- Cap rate 9.5% vs local median 2.3% in Mosheim — top-decile yield for the area; either an underpriced asset or a hidden risk that comps aren't pricing in. Stress-test before assuming the spread holds.
Location & tenants
- Location reads 58/100 on livability (#314 in TN) — a working-class tenant base; expect higher turnover. Strengths: cost of living A+, housing B; Watch: employment D, crime F, amenities F.
- Greene County (rural): math 27% / reading 24% proficiency, ranked #83 of 139 in TN (top 60%) — low school quality limits family demand, transient renter base, plan for 1-2y turnover.
- Zoned schools: Mosheim Elementary (math 20% / reading 19%, grade F, #654 of 952 statewide, top 72%, 721 students, 0% FRL); West Greene High School (math 8% / reading 32%, grade F, #183 of 332 statewide, top 59%, 516 students, 0% FRL) — zoned schools average 0% FRL vs 58% district-wide (58 pts lower); this property's tenant base skews higher-income than the district average.
- Market conditions: 17 active listings in the ZIP; 333 units permitted in Greene County in 2024 (72 in 5+ unit buildings).
Forward outlook
- In year one you build about $6k of equity ($477 loan paydown + $5k appreciation (7.3% local appreciation)).
- Greene County population projected to shrink 8% by 2050 — rents likely to lag national; underwrite the cash flow, not the appreciation.
- At projected returns (7.3% appreciation + 3.0% rent growth), your $19k cash investment doubles in ~3 years — after that, you're playing with house money.
- By year 6, paydown + projected appreciation supports a ~$31k cash-out refi (75% LTV) — recoverable capital for the next deal without selling this one.
Negotiation context
- Only 1 days on market — expect competitive offers; lowballing is unlikely to land.
- 3 sale attempts since 7y ago with the ask held roughly flat each time — persistent listings suggest the price (not the market) is what's stuck; bring a comps-based counter.
- Current owner paid $22k; list at $69k implies a 207% gain — meaningful room to come down on a strong offer.
Risks & watch-outs
- Climate carrying-cost: moderate wildfire risk; extreme-heat days projected 7→20/yr by 2055 (HVAC capex compounding) — expect insurance premiums to compound above CPI over the hold.
Questions for the listing agent
- Is there a deadline driving the sale (1031 exchange, divorce, estate, relocation)? That informs how much negotiation room exists.
- Schools are F-rated, which usually means shorter tenancies and higher turnover. Who's the typical renter profile here, and what's been the actual vacancy rate?
- Crime grade is F in this area — have there been break-ins, vandalism, or insurance claims at this property in the last 3 years? What carrier currently insures it and at what premium?
- What's the average days-on-market for RENTAL listings here right now (not sales)? A rising rental-DOM trend means longer vacancies and softer asking-rent achievability than the comps imply.
- What's the recent tenant-quality profile in this submarket — average credit score on applications, eviction rate, late-payment / NSF rate, and stable-employment percentage? A property-management company in the area should have these aggregated.
- How much new for-sale + rental construction is in the pipeline within 1–3 miles? Heavy new supply typically softens prices + rents 12–24 months out; constrained supply supports both.
Investment metrics
- 1% rule
- 1.21% ✓
- Cap rate
- 9.49%
- Cash-on-cash
- 11.42%
- DSCR
- 1.51
- GRM
- 6.9
CMA / ARV
No comps found within radius.
Projected returns pro-forma
7.34% appreciation · 3.0% rent growth · sell at horizon
- IRR
- 27.6%
- Equity multiple
- 2.93×
- Total profit
- $37,275
- Equity at exit
- $49,365
- IRR
- 25.0%
- Equity multiple
- 6.15×
- Total profit
- $99,492
- Equity at exit
- $95,211
Cash invested: $19,320 (down + closing). Projections, not guarantees.
Landlord ↔ Tenant lean methodology
- Overall (STATE)
- 87 Strongly Landlord-Friendly
- State Tennessee
- 87 Strongly Landlord-Friendly · R+13
- County
- — inherits STATE
- City
- — inherits STATE
ZIP-level market 37810
- Home prices YoY
- 2.8%
- Active inventory
- 17
- Price-to-rent
- 6.9×
Monthly cashflow live
- Estimated rent
- $836 medium interval (Pro) →
- Mortgage (P&I)
- −$362
- Tax est. 1.5%
- −$86 /mo · $1,035/yr
- Insurance
- −$29
- HOA
- −$0
- Vacancy / Maint / Mgmt
- −$176
- Net cashflow
- $184
Break-even live
Sensitivity live
| Price | -10% $232 | -5% $208 | +0% $184 | +5% $160 | +10% $136 |
|---|---|---|---|---|---|
| Rent | -10% $118 | -5% $151 | +0% $184 | +5% $217 | +10% $250 |
| Rate | -1.0pp $219 | -0.5pp $201 | base $184 | +0.5pp $166 | +1.0pp $148 |
UW: 25.0% down · 7.5% · 30yr · 1.5% tax · 5.0% vac · 8.0% maint · 8.0% mgmt
Financing live
Cash to close
- Down payment
- $17,250
- Closing costs
- $2,070
- Reserves months
- —
- Total cash needed
- —
Loan-product check · same deal, 3 products live
Conventional
25% down · 7.5% · 30yr
- Down + closing
- —
- Monthly P&I
- —
- Monthly cashflow
- —
- DSCR
- —
- Eligible?
- —
Personal DTI + credit; lowest rate.
DSCR
20% down · 8.5% · 30yr
- Down + closing
- —
- Monthly P&I
- —
- Monthly cashflow
- —
- DSCR
- —
- Eligible?
- —
No personal income docs; deal must DSCR.
Hard money
10% down · 12.0% · 12mo
- Down + closing
- —
- Monthly P&I
- —
- Monthly cashflow
- —
- DSCR
- —
- Eligible?
- —
Short-term bridge; refi at stabilization.
Listing history 2 events
-
2026-06-12remarks 270-char remark
-
2026-06-12$69,000 Pending 1 DOM
ⓘ Source: listings_history table (triggers on properties + properties_extension) + one-shot
backfill from property_details.listing_events for pre-trigger history.
Climate risk First Street
- Flood 1/10 Low FEMA zone X (unshaded) · 0% chance over 30 yrs
- Wildfire 5/10 Major
- Heat 5/10 Major 7 d/yr ≥102°F today · 20 d/yr by 30 yrs out
- Wind 2/10 Low
- Air quality 3/10 Moderate 2 unhealthy d/yr today · 3 by 30 yrs out
Nearby sold comps map
Loading sold comps map…
Walkable amenities ~0.75 mi
Loading nearby amenities…
Taxation est. · year 1
- Rental income
- $10,036
- − Mortgage interest
- −$3,865
- − Property taxes
- −$1,035
- − Insurance
- −$345
- − Repairs & maintenance
- −$803
- − Management
- −$803
- − Depreciation
- −$2,007
- Taxable income
- $1,178
- Est. tax owed @ 24.0%
- −$283
- After-tax cash flow
- $1,924/yr
For passive investors: Depreciation is non-cash, so a rental often shows a tax loss while cash-flowing — sheltering income. Rental losses are passive: they offset passive income freely, and up to $25,000/yr can offset ordinary (W-2) income if you actively participate and your MAGI is under $100k (phasing out to $0 by $150k); unused losses carry forward. On sale, claimed depreciation is recaptured at up to 25%, and gains may owe capital-gains tax (a 1031 exchange can defer both). Figures are a year-1 estimate at your 24.0% rate — not tax advice; consult a CPA.
Schools (NCES district)
- District
- Greene County
- NCES district ID
- 4701470
- Math proficiency
- 27% ▼ -14.00%
- Reading proficiency
- 24% ▼ -7.00%
- Median HH income
- $37,517
- Composite
- 21.3/100
- National rank
- #8388
- State rank
- #83 of 139 in TN
Livability — Mosheim
- Score
- 58/100
- State rank
- #314
- US rank
- #21396
Category grades
Schools grade is shown separately in the Schools card above.
Census & demographics
- City population
- 5,407
- Population (ZIP)
- 1,991
Population outlook (Greene County) Hauer SSP2
- Today (2025)
- 68,624 people
- By 2030
- 68,114 · -0.7%
- By 2040
- 66,167 · -3.6%
- By 2050
- 63,038 · -8.1%
- By 2075
- 55,274 · -19.5%
- By 2100
- 45,527 · -33.7%
Race, ethnicity, and origin ACS 2023
- Neighborhood character
- Predominantly White (99%)
- Race & ethnicity
- White 99%
- Common ancestry
- Italian 2% Slovak 1% Serbian 1%
Political lean MEDSL · Greene
- 2024 margin
- Solid R (+65.7) · D 16.6% · R 82.3% · Other 1.2%
- 2008→2024 swing
- -25.0pp toward R · 2008: -40.7pp · 2024: -65.7pp
- All cycles
- 2024: R+65.7 2020: R+60.7 2016: R+61.0 2012: R+46.0 2008: R+40.7
Not yet ingested
- Civics
- —
Market trends
- HPI YoY
- ▲ 7.34%
- Current HPI
- 274.4513
- Rent YoY
- —
- Metro
- —
- State GDP YoY
- ▲ 2.78%
- F500 in state
- 22
Industry mix (Fortune 500 HQ in TN)
| Industry | F500 HQs | Revenue |
|---|---|---|
| Healthcare | 3 | $91B |
|
||
| Retail | 3 | $72B |
|
||
| Transportation / Logistics | 1 | $88B |
|
||
| Paper / Packaging | 1 | $19B |
|
||
| Insurance | 1 | $13B |
|
||
| Energy | 1 | $12B |
|
||
Price history
+130.0% since first listed6 events — show timeline
- 2026-06-10 Pending — TVRMLS
- 2026-06-09 Listed $69,000 TVRMLS
- 2020-03-13 Sold (MLS) $22,500 LAAR
- 2020-03-13 Sold (MLS) $22,500 TVRMLS
- 2019-10-04 Listed $30,000 LAAR
- 2019-10-04 Listed $30,000 TVRMLS
Cash-flow waterfall
monthlySold comps — $/sqft
last 12 mo · ≤1 miLoading sold comps…