86-16 60th Ave Unit 1C · New York, NY
Flood risk No data
- FEMA flood zone
- —
- Chance of flooding over 30 yrs
- —
- Est. flood insurance / yr
- —
Fire risk No data
- Est. fire insurance / yr
- —
Heat risk No data
- Hot days now (above threshold)
- —
- Hot days in 30 yrs
- —
Wind risk No data
- Chance of severe wind over 30 yrs
- —
Air-quality risk No data
- Unhealthy air days now
- —
- Unhealthy air days in 30 yrs
- —
Risk factors via First Street. Map © Google.
Why this score? — see what drove the C grade
The composite is a weighted blend of 9 inputs, each scored 0–100. Each bar is that input's sub-score; the figure is the points it added to the 100-point composite (weight × sub-score).
- Cash flow +14.6/30.0
- 1% rule +10.0/10.0
- ARV discount +7.5/15.0
- Schools +5.0/10.0
- Appreciation +4.5/10.0
- DSCR +4.4/10.0
- Rent growth +4.3/5.0
- Livability +3.8/5.0
- Condition / age +3.8/5.0
$125,000
🖨 Deal sheet (PDF) 📄 Offer letter ✓ Due diligence
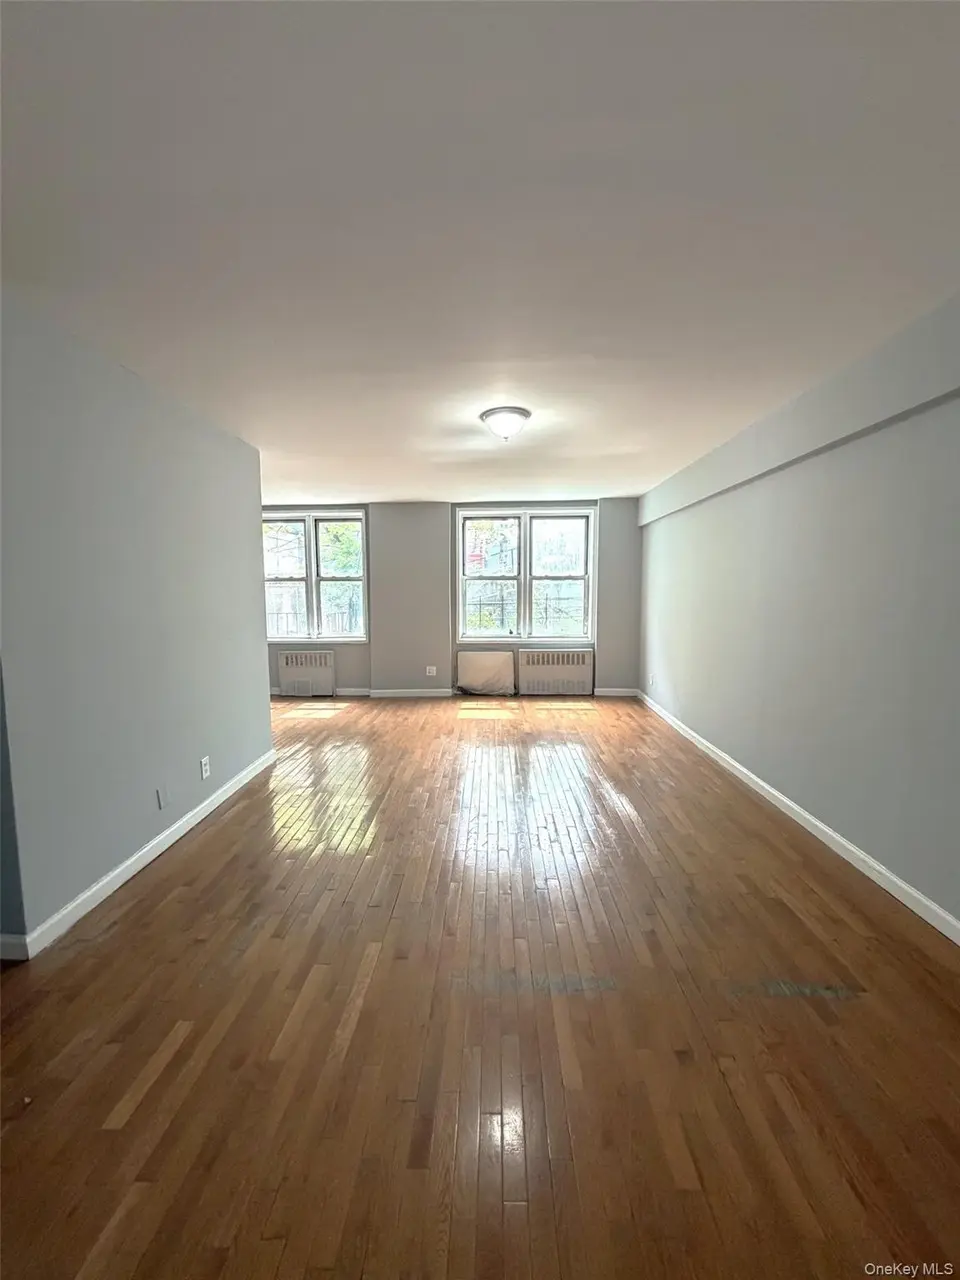
Listing remarks
Welcome to Caroline Gardens! A Bright Spacious Open Studio unit with Kitchen and Bathroom. Perfect closet space and pantry. Natural sunlight Enjoy the beautiful neighborhood where its conveniently located near shopping, schools, medical offices, parks and transportation. Great unit and great deal! Schedule your viewing today! Sale may be subject to terms & conditions of an offering plan.
Key facts
- Natural sunlight
- Perfect closet space
- $949 HOA
Tags
Property features AI
Finance
- HOA & community: Association: ONESOURCE; Monthly association fee of $949; Association fee includes heat, water, and sewer; Building amenities include elevator(s)
Exterior
- Parking: Garage; On-street parking; Other parking options
- Utilities: Public sewer; Public trash collection
- Home design: Stock cooperative; One level entry; 6-story building
- Construction: Brick construction
- Exterior features: Brick construction; Near public transit; Near shops; Not waterfront
Interior
- Kitchen: Gas oven
- Bedrooms: 3 rooms total (includes bedrooms and living areas)
- Flooring: Hardwood floors
- Bathrooms: 1 full bathroom
- Heating & cooling: Oil and electric heating; Wall/window air conditioning units
- Interior features: Elevator access; Common laundry area; Gas oven
- Laundry & utility: Common area laundry
Neighborhood map
What this means for you Summary
Snapshot
- This is a 1-bed/1.0-bath condo listed at $125k. Condition is rated good.
Deal economics
- At list price, monthly cash flow is $29 ($352/yr) — positive.
- The deal already cash-flows at list — no discount required.
- Meets the 1% rule at list price ($2k rent vs $125k).
- Recommended offer: $121k (3.0% below list) — sets the bar for market timing.
- Cap rate 6.6% vs local median 2.6% in New York — top-decile yield for the area; either an underpriced asset or a hidden risk that comps aren't pricing in. Stress-test before assuming the spread holds.
Location & tenants
- Location reads 75/100 on livability (#268 in NY, #4,188 nationally) — a middle-class / working-renter tenant base. Strengths: amenities A+, commute A+, health & safety A; Watch: crime F, cost of living F.
- Market conditions: Rents rising fast (+7.2%/yr); 270 active listings in the ZIP; 29 comparable units currently listed for rent nearby; rentals at typical pace (median 20d on market — plan ~3-4 weeks tenant-placement turnaround); 5,302 units permitted in Queens County in 2024 (4,918 in 5+ unit buildings).
- This rent runs 39% of the median local income ($71k/yr) — at the standard rent-burdened threshold; future hikes will face affordability resistance.
Forward outlook
- Local home prices are declining (-1.0%/yr); year-one equity from $864 of loan paydown is wiped out by about $1k of value loss. Plan a longer hold.
- Queens County population projected at +16% by 2050 — long-run rental-demand tailwind backs the buy-and-hold thesis.
- At projected returns (-1.0% appreciation + 7.2% rent growth), your $35k cash investment doubles in ~8 years — after that, you're playing with house money.
Negotiation context
- It's been on market 37 days — a 3% lower offer ($121k) is reasonable based on typical stale-listing flexibility.
- 3 sale attempts since 2y ago with the ask held roughly flat each time — persistent listings suggest the price (not the market) is what's stuck; bring a comps-based counter.
Risks & watch-outs
- Watch-outs: HOA is 41% of rent.
Questions for the listing agent
- It's been on market 37 days. Have you received any prior offers? Is the seller open to a 3% concession, seller financing, or rate buy-down credit?
- Built in 1963 — when were the roof, HVAC, electrical panel, plumbing, and water heater last replaced?
- What does the HOA fee cover, when was the last increase, and are there any pending special assessments or reserve-fund shortfalls?
- Any open or pending special assessments — roof, HVAC, plumbing, elevator, façade? What's the per-unit balance and payoff schedule, and is the seller paying it off at close or rolling it to the buyer?
- Is there a deadline driving the sale (1031 exchange, divorce, estate, relocation)? That informs how much negotiation room exists.
- Schools are B-rated — typically a magnet for longer-tenancy family renters. What's the average tenant stay here, and is there a school-zone premium baked into asking?
- Crime grade is F in this area — have there been break-ins, vandalism, or insurance claims at this property in the last 3 years? What carrier currently insures it and at what premium?
- What's the average days-on-market for RENTAL listings here right now (not sales)? A rising rental-DOM trend means longer vacancies and softer asking-rent achievability than the comps imply.
- What's the recent tenant-quality profile in this submarket — average credit score on applications, eviction rate, late-payment / NSF rate, and stable-employment percentage? A property-management company in the area should have these aggregated.
- How much new apartment / multifamily construction is in the pipeline within 1–3 miles? Heavy new supply (>2% of stock underway) typically softens rents 12–24 months out; light construction supports rent growth.
Investment metrics
- 1% rule
- 1.87% ✓
- Cap rate
- 6.57%
- Cash-on-cash
- 1.00%
- DSCR
- 1.04
- GRM
- 4.5
CMA / ARV
No comps found within radius.
Projected returns pro-forma
-0.98% appreciation · 7.15% rent growth · sell at horizon
- IRR
- 2.0%
- Equity multiple
- 1.09×
- Total profit
- $3,318
- Equity at exit
- $30,282
- IRR
- 14.3%
- Equity multiple
- 2.81×
- Total profit
- $63,437
- Equity at exit
- $31,890
Cash invested: $35,000 (down + closing). Projections, not guarantees.
Landlord ↔ Tenant lean methodology
- Overall (CITY)
- 0 Strongly Tenant-Friendly
- State New York
- 15 Strongly Tenant-Friendly · D+10
- County
- — inherits STATE
- City New York
- 0 Strongly Tenant-Friendly · D+34
ZIP-level market 11373
- Home prices YoY
- -0.4%
- Rents YoY
- 7.2%
- Active inventory
- 270
- Price-to-rent
- 4.5×
Monthly cashflow live
- Estimated rent
- $2,332 high interval (Pro) →
- Mortgage (P&I)
- −$656
- Tax est. 1.5%
- −$156 /mo · $1,875/yr
- Insurance
- −$52
- HOA
- −$949
- Vacancy / Maint / Mgmt
- −$490
- Net cashflow
- $29
Break-even live
Sensitivity live
| Price | -10% $116 | -5% $72 | +0% $29 | +5% $-14 | +10% $-57 |
|---|---|---|---|---|---|
| Rent | -10% $-155 | -5% $-63 | +0% $29 | +5% $121 | +10% $214 |
| Rate | -1.0pp $92 | -0.5pp $61 | base $29 | +0.5pp $-3 | +1.0pp $-36 |
UW: 25.0% down · 7.5% · 30yr · 1.5% tax · 5.0% vac · 8.0% maint · 8.0% mgmt
Financing live
Cash to close
- Down payment
- $31,250
- Closing costs
- $3,750
- Reserves months
- —
- Total cash needed
- —
Loan-product check · same deal, 3 products live
Conventional
25% down · 7.5% · 30yr
- Down + closing
- —
- Monthly P&I
- —
- Monthly cashflow
- —
- DSCR
- —
- Eligible?
- —
Personal DTI + credit; lowest rate.
DSCR
20% down · 8.5% · 30yr
- Down + closing
- —
- Monthly P&I
- —
- Monthly cashflow
- —
- DSCR
- —
- Eligible?
- —
No personal income docs; deal must DSCR.
Hard money
10% down · 12.0% · 12mo
- Down + closing
- —
- Monthly P&I
- —
- Monthly cashflow
- —
- DSCR
- —
- Eligible?
- —
Short-term bridge; refi at stabilization.
Rent comps 29 comps
| Address | Beds | Baths | Sqft | Rent | $/sqft | DOM | Units | Dist |
|---|---|---|---|---|---|---|---|---|
| 86-16 60th Ave Unit 1K Queens, NY | 1.0 | 1.0 | 750 | $2,300 | $3.07 | 26d | 1 | 0.05mi |
| 9430 58th Ave Unit 3A Elmhurst, NY | — | 1.0 | 530 | $1,800 | $3.40 | 12d | 1 | 0.54mi |
| 6347 Booth St Unit 3C Rego Park, NY | 1.0 | 1.0 | 700 | $3,400 | $4.86 | 26d | 1 | 0.56mi |
| 6125 97th St Unit 4D Rego Park, NY | — | 1.0 | 650 | $2,300 | $3.54 | 6d | 1 | 0.65mi |
| 9710 62nd Dr Unit 9F Rego Park, NY | 1.0 | 1.0 | 750 | $2,700 | $3.60 | 5d | 1 | 0.69mi |
| 9707 63rd Rd Unit 15B Rego Park, NY | 1.0 | 1.0 | 700 | $2,300 | $3.29 | 3d | 1 | 0.70mi |
| 6155 98th St Unit 8B Rego Park, NY | 1.0 | 1.0 | 700 | $2,500 | $3.57 | 6d | 1 | 0.76mi |
| 6145 98th St Rego Park, NY | 1.0–3.0 | 1.0 | 825 | $2,350 | $2.85 | 4d | 3 | 0.83mi |
| 6145 98th St Rego Park, NY | 1.0–3.0 | 1.0 | 825 | $2,500 | $3.03 | 26d | 3 | 0.83mi |
| 97-12 65th Rd Unit 18-E Rego Park, NY | 1.0 | 1.0 | 600 | $3,650 | $6.08 | 0d | 1 | 0.85mi |
| 97-12 65th Rd Unit 4-C Rego Park, NY | 1.0 | 1.0 | 650 | $3,350 | $5.15 | 6d | 1 | 0.85mi |
| 6620 Wetherole St Rego Park, NY | 1.0–2.0 | 1.0–2.0 | 700 | $2,400 | $3.43 | 26d | 2 | 0.99mi |
| 98-81 Queens Blvd Unit 15E Rego Park, NY | 1.0 | 1.0 | 700 | $3,335 | $4.76 | 6d | 1 | 1.01mi |
| 6615 Thornton Pl Rego Park, NY | 1.0 | 1.0 | 700 | $2,672 | $3.82 | 6d | 3 | 1.01mi |
| 66-55 Booth St Unit 6 Rego Park, NY | — | 1.0 | 500 | $2,295 | $4.59 | 26d | 1 | 1.06mi |
| 67-13 Austin St Unit 2A Flushing, NY | 1.0 | 1.0 | 600 | $2,595 | $4.33 | 18d | 1 | 1.11mi |
| 6750 Thornton Pl Unit 2U Forest Hills, NY | — | 1.0 | 550 | $1,900 | $3.45 | 9d | 1 | 1.16mi |
| 40-38 82nd St Apt 3C Elmhurst, NY | — | 1.0 | 350 | $1,600 | $4.57 | 25d | 1 | 1.19mi |
| 6405 Yellowstone Blvd Unit 403S Forest Hills, NY | 1.0 | 1.0 | 720 | $3,100 | $4.31 | 26d | 1 | 1.20mi |
| 6435 Yellowstone Blvd Unit 6G Forest Hills, NY | — | 1.0 | 575 | $1,900 | $3.30 | 20d | 1 | 1.24mi |
| 102-45 67th Rd Forest Hills, NY | 1.0 | 1.0 | 700 | $2,350 | $3.36 | 20d | 1 | 1.26mi |
| 6259 108th St Unit 3S Forest Hills, NY | — | 1.0 | 500 | $1,900 | $3.80 | 6d | 1 | 1.27mi |
| 102-30 Queens Blvd Unit 1A Forest Hills, NY | — | 1.0 | 350 | $2,395 | $6.84 | 26d | 1 | 1.27mi |
| 102-55 67th Rd Unit 2V Forest Hills, NY | 1.0 | 1.0 | 633 | $2,350 | $3.71 | 20d | 1 | 1.29mi |
| 37-27 86th St Unit 6N Flushing, NY | — | 1.0 | 650 | $1,900 | $2.92 | 26d | 1 | 1.29mi |
| 10849 63rd Ave Unit 2C Forest Hills, NY | — | 1.0 | 600 | $1,900 | $3.17 | 26d | 1 | 1.35mi |
| 3716 83rd St Jackson Heights, NY | 1.0 | 1.0 | 700 | $1,800 | $2.57 | 20d | 1 | 1.35mi |
| 105-25 67th Rd Forest Hills, NY | 1.0 | 1.0 | 750 | $1,800 | $2.40 | 20d | 1 | 1.36mi |
| 6771 Yellowstone Blvd Unit 2R Forest Hills, NY | 1.0 | 1.0 | 700 | $2,550 | $3.64 | 26d | 1 | 1.38mi |
HOA detail condo
- Monthly dues
- $949 · $11,388/yr
- Assessments
- None detected in remarks — confirm with the listing agent.
Listing history 19 events
-
2026-06-21days on market $125,000 Active 37 DOM
-
2026-06-18days on market $125,000 Active 34 DOM
-
2026-06-17days on market $125,000 Active 33 DOM
-
2026-06-16days on market $125,000 Active 32 DOM
-
2026-06-15days on market $125,000 Active 31 DOM
-
2026-06-13days on market $125,000 Active 29 DOM
-
2026-06-10days on market $125,000 Active 25 DOM
-
2026-06-08days on market $125,000 Active 24 DOM
-
2026-06-08days on market $125,000 Active 23 DOM
-
2026-06-04days on market $125,000 Active 20 DOM
-
2026-06-03days on market $125,000 Active 19 DOM
-
2026-06-02days on market $125,000 Active 18 DOM
-
2026-06-01days on market $125,000 Active 17 DOM
-
2026-05-31days on market $125,000 Active 16 DOM
-
2026-05-09$125,000 Active
-
2025-12-02historical
-
2025-07-07$125,000 Active
-
2024-08-31historical
-
2024-03-26$119,000 Active
ⓘ Source: listings_history table (triggers on properties + properties_extension) + one-shot
backfill from property_details.listing_events for pre-trigger history.
Nearby sold comps map
Loading sold comps map…
Walkable amenities ~0.75 mi
Loading nearby amenities…
Taxation est. · year 1
- Rental income
- $27,982
- − Mortgage interest
- −$7,002
- − Property taxes
- −$1,875
- − Insurance
- −$625
- − Repairs & maintenance
- −$2,239
- − Management
- −$2,239
- − HOA
- −$11,388
- − Depreciation
- −$3,636
- Taxable loss
- −$1,021
- Est. tax savings @ 24.0%
- +$245
- After-tax cash flow
- $597/yr
For passive investors: Depreciation is non-cash, so a rental often shows a tax loss while cash-flowing — sheltering income. Rental losses are passive: they offset passive income freely, and up to $25,000/yr can offset ordinary (W-2) income if you actively participate and your MAGI is under $100k (phasing out to $0 by $150k); unused losses carry forward. On sale, claimed depreciation is recaptured at up to 25%, and gains may owe capital-gains tax (a 1031 exchange can defer both). Figures are a year-1 estimate at your 24.0% rate — not tax advice; consult a CPA.
Condition & rehab AI · 5 photos
This well-maintained, move-in-ready condo offers a bright and spacious living space with hardwood floors and fresh paint. Minor updates could further enhance its curb appeal and value.
Value-add opportunities
- Both Paint fresh coat — Fresh paint enhances curb appeal and interior aesthetics.
- Both Replace window treatments — New curtains or blinds can improve natural light and privacy.
- Both Update light fixtures — Modern lighting fixtures can brighten the space and add value.
- Both Install smart thermostat — Energy-efficient heating and cooling can reduce utility costs and appeal to eco-conscious buyers/renters.
Renovation cost estimate screening
Value-add ROI direction
- Both Paint fresh coat — Fresh paint enhances curb appeal and interior aesthetics. ↑
- Both Replace window treatments — New curtains or blinds can improve natural light and privacy. ↑
- Both Update light fixtures — Modern lighting fixtures can brighten the space and add value. ↑
- Both Install smart thermostat — Energy-efficient heating and cooling can reduce utility costs and appeal to eco-conscious buyers/renters. ↑
ⓘ Cost ranges are severity-bucket heuristics (US national rule-of-thumb). Get contractor quotes + a written scope before underwriting a rehab budget.
Schools (NCES district)
No district data.
Livability — New York
- Score
- 75/100
- State rank
- #268
- US rank
- #4188
Category grades
Schools grade is shown separately in the Schools card above.
Census & demographics
- Census place
- New York, NY
- County
- Queens County · 1,914,869 people
- City population
- 7,731,280
- Metro
- New York-Newark-Jersey City, NY-NJ-PA
- Population (ZIP)
- 98,403
- Household income
- $71,480
- Rent vs Own
- Severe rent burden
- 7283.0
Population outlook (Queens County) Hauer SSP2
- Today (2025)
- 2,546,320 people
- By 2030
- 2,643,059 · +3.8%
- By 2040
- 2,815,563 · +10.6%
- By 2050
- 2,944,423 · +15.6%
- By 2075
- 3,123,338 · +22.7%
- By 2100
- 3,098,688 · +21.7%
Race, ethnicity, and origin ACS 2023
- Neighborhood character
- Diverse neighborhood (Simpson 0.58)
- Race & ethnicity
- Asian 48% Hispanic / Latino 43% Two or more races 8% White 5% Black 2%
- Hispanic origin (detail)
- Mexican 13% Puerto Rican 1% Dominican 4%
- Common ancestry
- Romanian 1%
- Foreign-born
- 66% · Canada, China, Jamaica
- Languages at home
- 14% English-only · Spanish 40% Chinese 16% Other Indo-European 13%
Political lean MEDSL · Queens
- 2024 margin
- Strong D (+24.6) · D 62.3% · R 37.7%
- 2008→2024 swing
- -26.2pp toward R · 2008: 50.8pp · 2024: 24.6pp
- All cycles
- 2024: D+24.6 2020: D+45.2 2016: D+53.4 2012: D+58.5 2008: D+50.8
Not yet ingested
- Civics
- —
Market trends
- HPI YoY
- ▼ -0.98%
- Current HPI
- 244.1055
- Rent YoY
- ▲ 7.15%
- Metro
- New York-Newark-Jersey City, NY-NJ-PA
- State GDP YoY
- ▲ 2.60%
- F500 in state
- 92
Industry mix (Fortune 500 HQ in NY)
| Industry | F500 HQs | Revenue |
|---|---|---|
| Financial Services | 10 | $950B |
|
||
| Consumer Goods | 9 | $162B |
|
||
| Insurance | 4 | $225B |
|
||
| Telecommunications | 2 | $144B |
|
||
| Pharmaceuticals | 2 | $112B |
|
||
| Media / Entertainment | 2 | $69B |
|
||
Price history
+5.0% since first listed5 events — show timeline
- 2026-05-09 Listed $125,000 OneKey® MLS as Distributed by MLS Grid
- 2025-12-02 Listing Removed — OneKey® MLS as Distributed by MLS Grid
- 2025-07-07 Listed $125,000 OneKey® MLS as Distributed by MLS Grid
- 2024-08-31 Listing Removed — OneKey® MLS as Distributed by MLS Grid
- 2024-03-26 Listed $119,000 OneKey® MLS as Distributed by MLS Grid
Cash-flow waterfall
monthlySold comps — $/sqft
last 12 mo · ≤1 miLoading sold comps…