14506 Broadbury Pond Rd · Fresno, TX
Flood risk 5/10 · Moderate
- FEMA flood zone
- X (unshaded)
- Chance of flooding over 30 yrs
- 0.65%
- Est. flood insurance / yr
- $507 – $1,088
Fire risk 5/10 · Moderate
- Est. fire insurance / yr
- $1,222 – $2,270
Heat risk 9/10 · Severe
- Hot days now (above 111°F)
- 7 days/yr
- Hot days in 30 yrs
- 23 days/yr
Wind risk 9/10 · Severe
- Chance of severe wind over 30 yrs
- 99.0%
Air-quality risk 2/10 · Minimal
- Unhealthy air days now
- 1 days/yr
- Unhealthy air days in 30 yrs
- 2 days/yr
Risk factors via First Street. Map © Google.
Why this score? — see what drove the C+ grade
The composite is a weighted blend of 9 inputs, each scored 0–100. Each bar is that input's sub-score; the figure is the points it added to the 100-point composite (weight × sub-score).
- Cash flow +21.9/30.0
- ARV discount +12.5/15.0
- 1% rule +7.1/10.0
- DSCR +7.0/10.0
- Schools +4.5/10.0
- Condition / age +4.0/5.0
- Livability +3.1/5.0
- Rent growth +2.6/5.0
- Appreciation +0.0/10.0
$234,900
🖨 Deal sheet 📄 Offer letter ✓ Due diligence
Listing remarks MLS
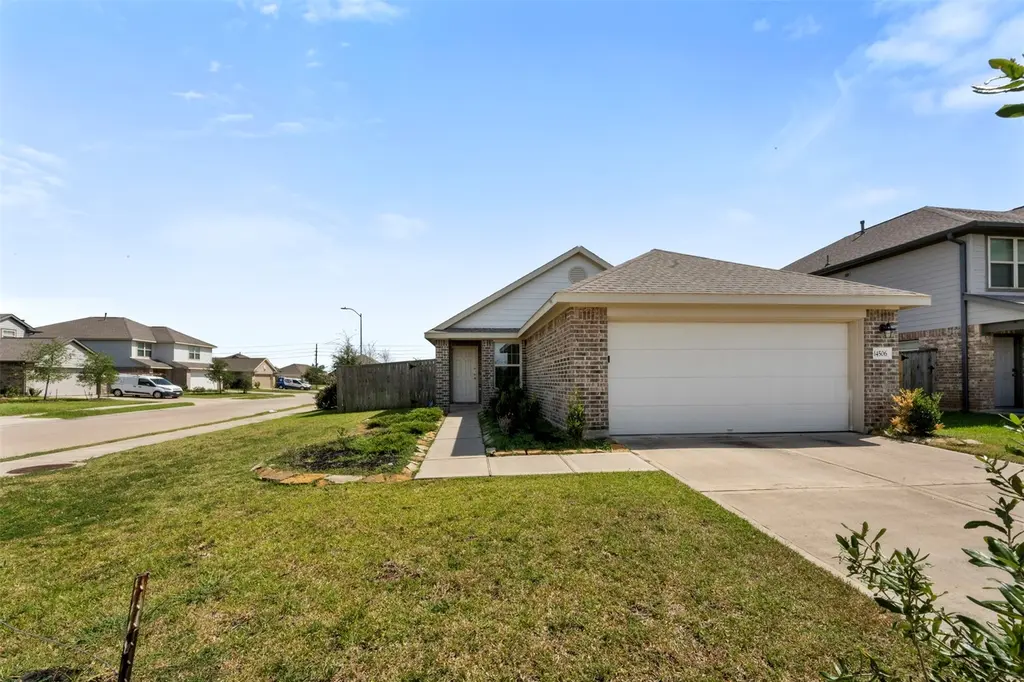
Welcome to 14506 Broadbury, a charming Single-Family property with 4 bedrooms and 2 bathrooms. This almost new home, built in 2021, has 1285 square feet of living space on a spacious corner lot size of 7126 square feet. Contact me for more information on this lovely property!
Key facts
- 7,126 sq ft lot
- 2 garage spots
- Built 2021
Neighborhood map
What this means for you Summary
Snapshot
- This is a 4-bed/2.0-bath single-family listed at $235k. Condition is rated good.
Deal economics
- At list price, monthly cash flow is $370 ($4k/yr) — positive.
- The deal already cash-flows at list — no discount required.
- Meets the 1% rule at list price ($3k rent vs $235k).
- Recommended offer: $214k (9.0% below list) — sets the bar for market timing.
- Cap rate 8.2% vs local median 5.4% in Fresno — top-decile yield for the area; either an underpriced asset or a hidden risk that comps aren't pricing in. Stress-test before assuming the spread holds.
Location & tenants
- Location reads 62/100 on livability (#943 in TX) — a middle-class / working-renter tenant base. Strengths: employment A+, housing A+, cost of living A; Watch: crime C-, schools D-, amenities F.
- Fort Bend ISD (suburban): math 44% / reading 53% proficiency, ranked #140 of 826 in TX (top 17%) — families likely to look elsewhere, expect single-tenant / working-renter base with shorter leases.
- Market conditions: Rents flat; 1139 active listings in the ZIP; 2 comparable units currently listed for rent nearby; high-income renter base; 12,093 units permitted in Fort Bend County in 2024 (815 in 5+ unit buildings).
Forward outlook
- Local home prices are declining (-3.0%/yr); year-one equity from $2k of loan paydown is wiped out by about $7k of value loss. Plan a longer hold.
- Fort Bend County population projected at +75% by 2050 — long-run rental-demand tailwind backs the buy-and-hold thesis.
Negotiation context
- It's been on market 111 days — a 9% lower offer ($214k) is reasonable based on typical stale-listing flexibility.
- 2 sale attempts since 3y ago; this cycle's ask has dropped $15k (6%) from the opening price — seller is motivated, your offer sets the floor, not the list.
Risks & watch-outs
- Climate carrying-cost: moderate flood risk; severe wind risk, 99% chance of damaging wind over 30y; moderate wildfire risk; extreme-heat days projected 7→23/yr by 2055 (HVAC capex compounding) — expect insurance premiums to compound above CPI over the hold.
Questions for the listing agent
- It's been on market 111 days. Have you received any prior offers? Is the seller open to a 9% concession, seller financing, or rate buy-down credit?
- What does the HOA fee cover, when was the last increase, and are there any pending special assessments or reserve-fund shortfalls?
- Why hasn't it sold? Are there any deal-killer items the seller is aware of (foundation, flood, title, zoning, code violations)?
- Is there a deadline driving the sale (1031 exchange, divorce, estate, relocation)? That informs how much negotiation room exists.
- Schools are D-rated, which usually means shorter tenancies and higher turnover. Who's the typical renter profile here, and what's been the actual vacancy rate?
- What's the average days-on-market for RENTAL listings here right now (not sales)? A rising rental-DOM trend means longer vacancies and softer asking-rent achievability than the comps imply.
- What's the recent tenant-quality profile in this submarket — average credit score on applications, eviction rate, late-payment / NSF rate, and stable-employment percentage? A property-management company in the area should have these aggregated.
- How much new for-sale + rental construction is in the pipeline within 1–3 miles? Heavy new supply typically softens prices + rents 12–24 months out; constrained supply supports both.
Investment metrics
- 1% rule
- 1.21% ✓
- Cap rate
- 8.18%
- Cash-on-cash
- 6.76%
- DSCR
- 1.30
- GRM
- 6.9
CMA / ARV
- ARV (median comp)
- $264,044
- List price
- $234,900
- Delta
- -11.04%
- Verdict
- UNDERPRICED
- Comps
- 20 within 1.0 mi
Show comp detail 12 sales within ~0.75 mi
| Address | Dist | Beds/Ba | Sqft | Sold | Price | $/sf | Match |
|---|---|---|---|---|---|---|---|
| 14506 Broadbury Pond Rd | 0.00mi | 4/2.0 | 1,285 (0%) | 0mo | $234,900 | $183 | 100 |
| 14518 Broadbury Pond Rd | 0.03mi | 3/2.0 (-1) | 1,180 (-8%) | 3mo | $224,900 | $191 | 77 |
| 946 Luke Darrell Dr | 0.25mi | 3/2.0 (-1) | 1,337 (+4%) | 3mo | $244,000 | $182 | 74 |
| 5122 Hector Gustavo Dr | 0.31mi | 3/2.0 (-1) | 1,331 (+4%) | 3mo | $244,000 | $183 | 72 |
| 5127 Shelby Katherine Dr | 0.34mi | 3/2.0 (-1) | 1,331 (+4%) | 2mo | $244,000 | $183 | 71 |
| 5002 Hurston Park Trl | 0.25mi | 3/2.0 (-1) | 1,311 (+2%) | 13mo | $262,000 | $200 | 69 |
| 5114 Hector Gustavo Dr | 0.30mi | 3/2.0 (-1) | 1,331 (+4%) | 8mo | $249,990 | $188 | 69 |
| 5107 Shelby Katherine Dr | 0.29mi | 3/2.0 (-1) | 1,331 (+4%) | 12mo | $259,990 | $195 | 66 |
| 4523 Rose Ln | 0.62mi | 3/2.0 (-1) | 1,293 (+1%) | 3mo | $259,000 | $200 | 63 |
| 5130 Shelby Katherine Dr | 0.35mi | 3/2.0 (-1) | 1,331 (+4%) | 13mo | $259,990 | $195 | 62 |
| 5050 Hurston Park Trl | 0.17mi | 3/2.0 (-1) | 1,450 (+13%) | 8mo | $304,000 | $210 | 59 |
| 5603 Briana Dee Dr | 0.57mi | 3/2.0 (-1) | 1,370 (+7%) | 9mo | $250,000 | $182 | 50 |
Match score weights: distance 35% · size 25% · config 20% · recency 20%. Top-matched comps best support the ARV.
Projected returns pro-forma
-3.0% appreciation · 0.44% rent growth · sell at horizon
- IRR
- -9.1%
- Equity multiple
- 0.67×
- Total profit
- $-21,417
- Equity at exit
- $35,024
- IRR
- -4.0%
- Equity multiple
- 0.77×
- Total profit
- $-15,301
- Equity at exit
- $20,310
Cash invested: $65,772 (down + closing). Projections, not guarantees.
Landlord ↔ Tenant lean methodology
- Overall (STATE)
- 87 Strongly Landlord-Friendly
- State Texas
- 87 Strongly Landlord-Friendly · R+5
- County
- — inherits STATE
- City
- — inherits STATE
ZIP-level market 77583
- Rents YoY
- 0.4%
- Active inventory
- 1139
- Price-to-rent
- 6.9×
Monthly cashflow live
- Estimated rent
- $2,842 medium interval (Pro) →
- Mortgage (P&I)
- −$1,232
- Tax from tax record
- −$470 /mo · $5,639/yr
- Insurance
- −$98
- HOA
- −$75
- Vacancy / Maint / Mgmt
- −$597
- Net cashflow
- $370
Break-even live
UW: 25.0% down · 7.5% · 30yr · 1.5% tax · 5.0% vac · 8.0% maint · 8.0% mgmt
Financing live
Cash to close
- Down payment
- $58,725
- Closing costs
- $7,047
- Reserves months
- —
- Total cash needed
- —
Loan-product check · same deal, 3 products live
Conventional
25% down · 7.5% · 30yr
- Down + closing
- —
- Monthly P&I
- —
- Monthly cashflow
- —
- DSCR
- —
- Eligible?
- —
Personal DTI + credit; lowest rate.
DSCR
20% down · 8.5% · 30yr
- Down + closing
- —
- Monthly P&I
- —
- Monthly cashflow
- —
- DSCR
- —
- Eligible?
- —
No personal income docs; deal must DSCR.
Hard money
10% down · 12.0% · 12mo
- Down + closing
- —
- Monthly P&I
- —
- Monthly cashflow
- —
- DSCR
- —
- Eligible?
- —
Short-term bridge; refi at stabilization.
Rent comps 2 comps
| Address | Beds | Baths | Sqft | Rent | $/sqft | DOM | Units | Dist |
|---|---|---|---|---|---|---|---|---|
| 5522 Briana Dee Dr Rosharon, TX | 3.0 | 2.0 | 1370 | $2,100 | $1.53 | 43d | 1 | 0.54mi |
| 919 Yorkshire Holw Fresno, TX | 3.0 | 2.0 | 1506 | $2,100 | $1.39 | 43d | 1 | 1.20mi |
HOA detail
- Monthly dues
- $75 · $900/yr
Listing history 7 events
-
2026-05-20status Pending 276-char remark
Show marketing remark (276 chars)
Welcome to 14506 Broadbury, a charming Single-Family property with 4 bedrooms and 2 bathrooms. This almost new home, built in 2021, has 1285 square feet of living space on a spacious corner lot size of 7126 square feet. Contact me for more information on this lovely property!
-
2026-05-07status Pending 276-char remark
Show marketing remark (276 chars)
Welcome to 14506 Broadbury, a charming Single-Family property with 4 bedrooms and 2 bathrooms. This almost new home, built in 2021, has 1285 square feet of living space on a spacious corner lot size of 7126 square feet. Contact me for more information on this lovely property!
-
2026-04-21price $234,900 276-char remark
Show marketing remark (276 chars)
Welcome to 14506 Broadbury, a charming Single-Family property with 4 bedrooms and 2 bathrooms. This almost new home, built in 2021, has 1285 square feet of living space on a spacious corner lot size of 7126 square feet. Contact me for more information on this lovely property!
-
2026-03-10price $245,000 276-char remark
Show marketing remark (276 chars)
Welcome to 14506 Broadbury, a charming Single-Family property with 4 bedrooms and 2 bathrooms. This almost new home, built in 2021, has 1285 square feet of living space on a spacious corner lot size of 7126 square feet. Contact me for more information on this lovely property!
-
2026-01-29$249,900 Active 276-char remark
Show marketing remark (276 chars)
Welcome to 14506 Broadbury, a charming Single-Family property with 4 bedrooms and 2 bathrooms. This almost new home, built in 2021, has 1285 square feet of living space on a spacious corner lot size of 7126 square feet. Contact me for more information on this lovely property!
-
2024-01-10historical $2,029
-
2023-09-29$2,029
ⓘ Source: listings_history table (triggers on properties + properties_extension) + one-shot
backfill from property_details.listing_events for pre-trigger history.
Tax reassessment forecast TX · Resets to sale price
- Current annual tax
- $5,639 · $470/mo
- Projected year-2 tax
- $5,639 · $470/mo
- Expected delta
- $0/yr ($0/mo · 0.0%)
ⓘ Screening estimate from a state-policy table — verify with the county assessor before closing.
Climate risk First Street
- Flood 5/10 Major FEMA zone X (unshaded) · 65% chance over 30 yrs
- Wildfire 5/10 Major
- Heat 9/10 Extreme 7 d/yr ≥111°F today · 23 d/yr by 30 yrs out
- Wind 9/10 Extreme 99% chance of damaging wind over 30 yrs
- Air quality 2/10 Low 1 unhealthy d/yr today · 2 by 30 yrs out
Nearby sold comps map
Loading sold comps map…
Walkable amenities ~0.75 mi
Loading nearby amenities…
Taxation est. · year 1
- Rental income
- $34,101
- − Mortgage interest
- −$13,158
- − Property taxes
- −$5,639
- − Insurance
- −$1,174
- − Repairs & maintenance
- −$2,728
- − Management
- −$2,728
- − HOA
- −$900
- − Depreciation
- −$6,833
- Taxable income
- $940
- Est. tax owed @ 24.0%
- −$226
- After-tax cash flow
- $4,218/yr
For passive investors: Depreciation is non-cash, so a rental often shows a tax loss while cash-flowing — sheltering income. Rental losses are passive: they offset passive income freely, and up to $25,000/yr can offset ordinary (W-2) income if you actively participate and your MAGI is under $100k (phasing out to $0 by $150k); unused losses carry forward. On sale, claimed depreciation is recaptured at up to 25%, and gains may owe capital-gains tax (a 1031 exchange can defer both). Figures are a year-1 estimate at your 24.0% rate — not tax advice; consult a CPA.
Condition & rehab AI · 12 photos
This nearly new single-family home in Fresno, TX, offers a good condition with minimal repairs needed. It's move-in ready with potential for value-adding improvements to enhance its curb appeal and interior aesthetics.
Value-add opportunities
- Both Painting the exterior and interior — Fresh paint enhances curb appeal and interior aesthetics
- Both Landscaping improvements — Aesthetic improvements can increase both resale and rental value
- Both HVAC maintenance — A clean and efficient HVAC system improves comfort and energy efficiency
Renovation cost estimate screening
Value-add ROI direction
- Both Painting the exterior and interior — Fresh paint enhances curb appeal and interior aesthetics ↑
- Both Landscaping improvements — Aesthetic improvements can increase both resale and rental value ↑
- Both HVAC maintenance — A clean and efficient HVAC system improves comfort and energy efficiency ↑
ⓘ Cost ranges are severity-bucket heuristics (US national rule-of-thumb). Get contractor quotes + a written scope before underwriting a rehab budget.
Schools (NCES district)
- District
- Fort Bend ISD
- NCES district ID
- 4819650
- Math proficiency
- 44% ▼ -15.00%
- Reading proficiency
- 53% ▼ -4.00%
- Median HH income
- $82,360
- Composite
- 44.61/100
- National rank
- #2779
- State rank
- #140 of 826 in TX
Livability — Fresno
- Score
- 62/100
- State rank
- #943
- US rank
- #16815
Category grades
Schools grade is shown separately in the Schools card above.
Census & demographics
- Census place
- Fresno, TX
- County
- Brazoria County · 374,982 people
- City population
- 26,236
- Metro
- Houston-The Woodlands-Sugar Land, TX
- Population (ZIP)
- 52,747
- Household income
- $119,287
- Rent vs Own
- Severe rent burden
- 251.0
Population outlook (Fort Bend County) Hauer SSP2
- Today (2025)
- 1,004,526 people
- By 2030
- 1,153,104 · +14.8%
- By 2040
- 1,453,718 · +44.7%
- By 2050
- 1,753,781 · +74.6%
- By 2075
- 2,455,772 · +144.5%
- By 2100
- 2,930,528 · +191.7%
Race, ethnicity, and origin ACS 2023
- Neighborhood character
- Highly diverse neighborhood (Simpson 0.70)
- Race & ethnicity
- Hispanic / Latino 38% Black 34% White 20% Two or more races 18% Asian 5%
- Hispanic origin (detail)
- Mexican 31% Puerto Rican 2%
- Common ancestry
- Lithuanian 1% Slovak 1% Romanian 1%
- Foreign-born
- 16% · Canada, Vietnam, China
- Languages at home
- 64% English-only · Spanish 28% Other Asian/Pacific 2% Vietnamese 1%
Political lean MEDSL · Fort Bend
- 2024 margin
- Toss-up / Even · D 49.5% · R 47.9% · Other 2.6%
- 2008→2024 swing
- +4.0pp toward D · 2008: -2.4pp · 2024: 1.6pp
- All cycles
- 2024: D+1.6 2020: D+10.6 2016: D+6.6 2012: R+6.8 2008: R+2.4
Not yet ingested
- Civics
- —
Market trends
- HPI YoY
- ▼ -120.19%
- Current HPI
- 198.6559
- Rent YoY
- ▲ 0.44%
- Metro
- Houston-The Woodlands-Sugar Land, TX
- State GDP YoY
- ▲ 3.95%
- F500 in state
- 110
Industry mix (Fortune 500 HQ in TX)
| Industry | F500 HQs | Revenue |
|---|---|---|
| Energy | 16 | $1,198B |
|
||
| Technology | 5 | $198B |
|
||
| Engineering / Construction | 4 | $72B |
|
||
| Energy Services | 3 | $60B |
|
||
| Utilities | 3 | $41B |
|
||
| Healthcare | 2 | $330B |
|
||
Price history
+11477.1% since first listed7 events — show timeline
- 2026-05-20 Pending — HARMLS
- 2026-05-07 Pending — HARMLS
- 2026-04-21 Price Changed $234,900 HARMLS
- 2026-03-10 Price Changed $245,000 HARMLS
- 2026-01-29 Listed $249,900 HARMLS
- 2024-01-10 Rental Removed $2,029 HARMLS
- 2023-09-29 Listed for Rent $2,029 HARMLS
Property tax history
+2.6%/yrLatest (2025): $5,639 · +5.2% YoY. Source: county tax records.
Cash-flow waterfall
monthlySold comps — $/sqft
last 12 mo · ≤1 miLoading sold comps…