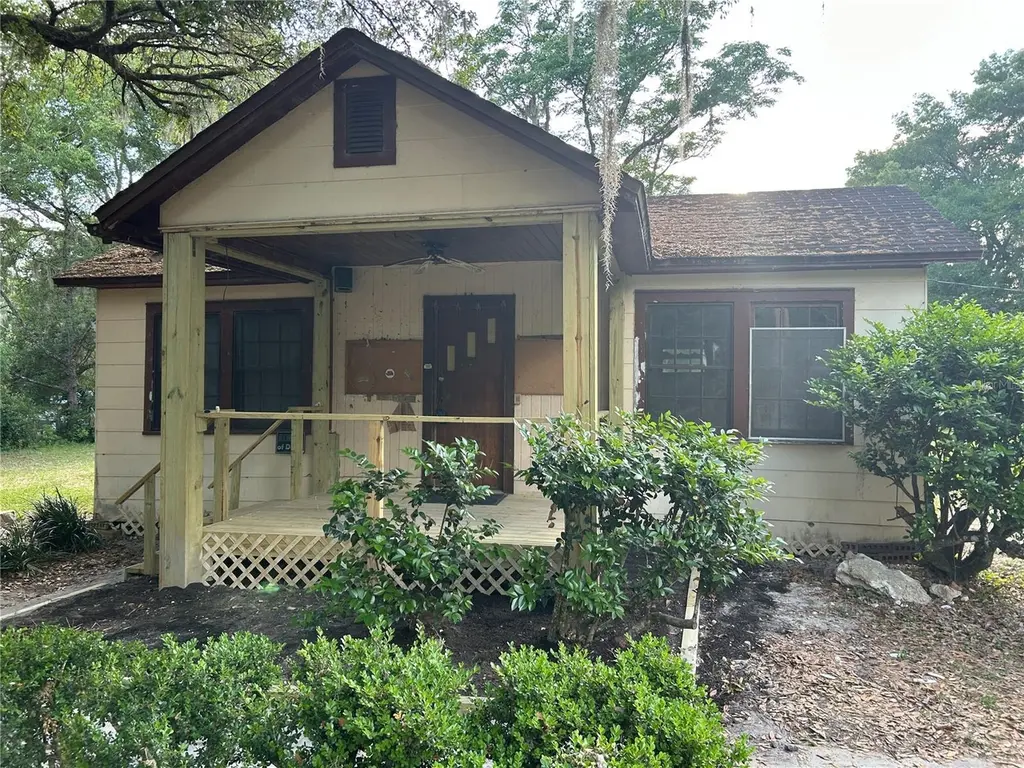
2242 NW 1st Ave · Ocala, FL
Flood risk 1/10 · Minimal
- FEMA flood zone
- X (unshaded)
- Chance of flooding over 30 yrs
- 0.0%
- Est. flood insurance / yr
- $507 – $1,088
Fire risk 4/10 · Minor
- Est. fire insurance / yr
- $947 – $1,759
Heat risk 8/10 · Major
- Hot days now (above 108°F)
- 7 days/yr
- Hot days in 30 yrs
- 22 days/yr
Wind risk 9/10 · Severe
- Chance of severe wind over 30 yrs
- 99.0%
Air-quality risk 4/10 · Minor
- Unhealthy air days now
- 5 days/yr
- Unhealthy air days in 30 yrs
- 5 days/yr
Risk factors via First Street. Map © Google.
Why this score? — see what drove the C- grade
The composite is a weighted blend of 9 inputs, each scored 0–100. Each bar is that input's sub-score; the figure is the points it added to the 100-point composite (weight × sub-score).
- Cash flow +25.0/30.0
- DSCR +8.1/10.0
- 1% rule +5.2/10.0
- Schools +3.6/10.0
- Livability +3.5/5.0
- Rent growth +2.5/5.0
- Condition / age +2.5/5.0
- ARV discount +2.1/15.0
- Appreciation +0.0/10.0
$125,000
🖨 Deal sheet 📄 Offer letter ✓ Due diligence
Listing remarks
Handyman special! Unlock the potential of this hidden gem near downtown Ocala. Situated on a spacious almost 1-acre lot, this property features high ceilings and offers a fantastic opportunity for investors or buyers looking to create their dream home. With solid bones and endless possibilities, this is the perfect canvas for renovation or customization. Conveniently located close to shopping, dining, major roadways, and everything Ocala has to offer. Whether you’re looking for your next flip, rental investment, or personal project, this property is full of upside. With the right vision and updates, this property can truly shine—don’t miss this chance to bring it back to l
Key facts
- Close to dining
- High ceilings
- Close to shopping
Tags
Property features AI
Finance
- Other: Property sits on about 0.95 acres
- Financial info: No lease restrictions noted
- HOA & community: No HOA/association
Exterior
- Parking: Attached garage with 1 parking space
- Security: No security features listed
- Utilities: Well water; Septic system; Other utilities
- Home design: Single-family residence; One story; Facing east; Residential zoning
- Construction: Block construction; Other roof type; Crawlspace foundation; Approximately 199? year built not provided
- Exterior features: Private mailbox; Dirt road access
Interior
- Kitchen: No appliances listed
- Bedrooms: 2 bedrooms
- Flooring: Laminate flooring
- Bathrooms: 1 full bathroom
- Heating & cooling: Heating: Other; No central cooling listed
- Interior features: No notable interior features listed
- Laundry & utility: No laundry features
Neighborhood map
What this means for you Summary
Snapshot
- This is a 2-bed/1.0-bath single-family listed at $125k.
Deal economics
- At list price, monthly cash flow is $271 ($3k/yr) — positive.
- The deal already cash-flows at list — no discount required.
- Meets the 1% rule at list price ($1k rent vs $125k).
- Recommended offer: $123k (1.5% below list) — sets the bar for market timing.
- Cap rate 8.9% vs local median 4.2% in Ocala — top-decile yield for the area; either an underpriced asset or a hidden risk that comps aren't pricing in. Stress-test before assuming the spread holds.
Location & tenants
- Location reads 69/100 on livability (#476 in FL) — a middle-class / working-renter tenant base. Strengths: cost of living A+, housing A+, health & safety A+; Watch: crime F, amenities F, commute F.
- Marion (rural): math 42% / reading 43% proficiency, ranked #61 of 73 in FL (top 84%) — families likely to look elsewhere, expect single-tenant / working-renter base with shorter leases; 61% free/reduced lunch — lower-income household profile, screen leases tightly.
- Market conditions: 199 active listings in the ZIP; 12 comparable units currently listed for rent nearby; rentals at typical pace (median 21d on market — plan ~3-4 weeks tenant-placement turnaround); lower-income renter base — watch delinquency; 7,071 units permitted in Marion County in 2024 (534 in 5+ unit buildings).
- At $1,271/mo this rent would consume 51% of the median local household income ($30k/yr) (locally 923% of renters already pay >50% of income on rent) — very limited rent-growth headroom before tenants either downsize or default.
Forward outlook
- Local home prices are declining (-3.0%/yr); year-one equity from $864 of loan paydown is wiped out by about $4k of value loss. Plan a longer hold.
- Marion County population projected at +13% by 2050 — modest demand growth; plan on rents tracking national, not racing it.
Negotiation context
- It's been on market 18 days — a 2% lower offer ($123k) is reasonable based on typical stale-listing flexibility.
Risks & watch-outs
- Watch-outs: built in 1948 — expect roof / HVAC / electrical / plumbing capex.
- Climate carrying-cost: severe wind risk, 99% chance of damaging wind over 30y; extreme-heat days projected 7→22/yr by 2055 (HVAC capex compounding) — expect insurance premiums to compound above CPI over the hold.
Questions for the listing agent
- Built in 1948 — when were the roof, HVAC, electrical panel, plumbing, and water heater last replaced?
- Is there a deadline driving the sale (1031 exchange, divorce, estate, relocation)? That informs how much negotiation room exists.
- Crime grade is F in this area — have there been break-ins, vandalism, or insurance claims at this property in the last 3 years? What carrier currently insures it and at what premium?
- What's the average days-on-market for RENTAL listings here right now (not sales)? A rising rental-DOM trend means longer vacancies and softer asking-rent achievability than the comps imply.
- What's the recent tenant-quality profile in this submarket — average credit score on applications, eviction rate, late-payment / NSF rate, and stable-employment percentage? A property-management company in the area should have these aggregated.
- How much new for-sale + rental construction is in the pipeline within 1–3 miles? Heavy new supply typically softens prices + rents 12–24 months out; constrained supply supports both.
Investment metrics
- 1% rule
- 1.02% ✓
- Cap rate
- 8.89%
- Cash-on-cash
- 9.28%
- DSCR
- 1.41
- GRM
- 8.2
CMA / ARV
- ARV (on-the-fly)
- $111,552
- Comps found
- 1
Show comp detail 1 sale within ~0.75 mi
| Address | Dist | Beds/Ba | Sqft | Sold | Price | $/sf | Match |
|---|---|---|---|---|---|---|---|
| 1711 NW 3rd Ave | 0.52mi | 2/1.0 | 848 (-15%) | 8mo | $95,000 | $112 | 45 |
Match score weights: distance 35% · size 25% · config 20% · recency 20%. Top-matched comps best support the ARV.
Projected returns pro-forma
-3.0% appreciation · 3.0% rent growth · sell at horizon
- IRR
- -2.3%
- Equity multiple
- 0.91×
- Total profit
- $-3,087
- Equity at exit
- $18,638
- IRR
- 7.3%
- Equity multiple
- 1.55×
- Total profit
- $19,251
- Equity at exit
- $10,808
Cash invested: $35,000 (down + closing). Projections, not guarantees.
Landlord ↔ Tenant lean methodology
- Overall (STATE)
- 87 Strongly Landlord-Friendly
- State Florida
- 87 Strongly Landlord-Friendly · R+3
- County
- — inherits STATE
- City
- — inherits STATE
ZIP-level market 34475
- Home prices YoY
- -8.0%
- Active inventory
- 199
- Price-to-rent
- 8.2×
Monthly cashflow live
- Estimated rent
- $1,271 high interval (Pro) →
- Mortgage (P&I)
- −$656
- Tax from tax record
- −$26 /mo · $309/yr
- Insurance
- −$52
- HOA
- −$0
- Vacancy / Maint / Mgmt
- −$267
- Net cashflow
- $271
Break-even live
UW: 25.0% down · 7.5% · 30yr · 1.5% tax · 5.0% vac · 8.0% maint · 8.0% mgmt
Financing live
Cash to close
- Down payment
- $31,250
- Closing costs
- $3,750
- Reserves months
- —
- Total cash needed
- —
Loan-product check · same deal, 3 products live
Conventional
25% down · 7.5% · 30yr
- Down + closing
- —
- Monthly P&I
- —
- Monthly cashflow
- —
- DSCR
- —
- Eligible?
- —
Personal DTI + credit; lowest rate.
DSCR
20% down · 8.5% · 30yr
- Down + closing
- —
- Monthly P&I
- —
- Monthly cashflow
- —
- DSCR
- —
- Eligible?
- —
No personal income docs; deal must DSCR.
Hard money
10% down · 12.0% · 12mo
- Down + closing
- —
- Monthly P&I
- —
- Monthly cashflow
- —
- DSCR
- —
- Eligible?
- —
Short-term bridge; refi at stabilization.
Rent comps 12 comps
| Address | Beds | Baths | Sqft | Rent | $/sqft | DOM | Units | Dist |
|---|---|---|---|---|---|---|---|---|
| 101 NW 23rd Pl Ocala, FL | 2.0 | 1.0 | 716 | $1,150 | $1.61 | 13d | 1 | 0.04mi |
| 506 NE 28th St Unit C Ocala, FL | 1.0 | 1.0 | 525 | $1,050 | $2.00 | 21d | 1 | 0.41mi |
| 708 NE 26th St Ocala, FL | 3.0 | 2.0 | 1100 | $1,600 | $1.45 | 21d | 1 | 0.46mi |
| 712 NE 26th St Ocala, FL | 3.0 | 2.0 | 1105 | $1,590 | $1.44 | 21d | 1 | 0.48mi |
| 2836 NE 8th Ter Unit 2836 Ocala, FL | 2.0 | 2.0 | 840 | $1,150 | $1.37 | 21d | 1 | 0.67mi |
| 2818 NE 8th Ter Unit 2818 Ocala, FL | 2.0 | 2.0 | 840 | $1,150 | $1.37 | 21d | 1 | 0.67mi |
| NE 8th Ter Ocala, FL | 2.0 | 2.0 | 840 | $1,150 | $1.37 | 13d | 2 | 0.70mi |
| 2205 NE 14th Ave Ocala, FL | 3.0 | 1.0 | 1020 | $1,345 | $1.32 | 21d | 1 | 1.06mi |
| 1404 NW 18th Ave Unit 2 Ocala, FL | 1.0 | 1.0 | 619 | $1,149 | $1.86 | 21d | 1 | 1.31mi |
| 1908 NW 13th Pl Ocala, FL | 3.0 | 1.0 | 1000 | $1,325 | $1.32 | 21d | 1 | 1.42mi |
| 2150 NW 21st Ave Ocala, FL | 3.0 | 1.0–3.0 | 933 | $1,876 | $2.01 | 13d | 10 | 1.46mi |
| 1011 NW 42nd Ln Ocala, FL | 2.0 | 1.0 | 874 | $950 | $1.09 | 21d | 1 | 1.49mi |
Listing history 3 events
-
2026-05-12status Pending
-
2026-05-02price $125,000
-
2026-04-24$129,000 Active
ⓘ Source: listings_history table (triggers on properties + properties_extension) + one-shot
backfill from property_details.listing_events for pre-trigger history.
Tax reassessment forecast FL · Resets to sale price
- Current annual tax
- $309 · $26/mo
- Projected year-2 tax
- $1,038 · $86/mo
- Expected delta
- +$729/yr (+$61/mo · 236.1%)
ⓘ Screening estimate from a state-policy table — verify with the county assessor before closing.
Climate risk First Street
- Flood 1/10 Low FEMA zone X (unshaded) · 0% chance over 30 yrs
- Wildfire 4/10 Moderate
- Heat 8/10 Severe 7 d/yr ≥108°F today · 22 d/yr by 30 yrs out
- Wind 9/10 Extreme 99% chance of damaging wind over 30 yrs
- Air quality 4/10 Moderate 5 unhealthy d/yr today · 5 by 30 yrs out
Nearby sold comps map
Loading sold comps map…
Walkable amenities ~0.75 mi
Loading nearby amenities…
Taxation est. · year 1
- Rental income
- $15,248
- − Mortgage interest
- −$7,002
- − Property taxes
- −$309
- − Insurance
- −$625
- − Repairs & maintenance
- −$1,220
- − Management
- −$1,220
- − Depreciation
- −$3,636
- Taxable income
- $1,237
- Est. tax owed @ 24.0%
- −$297
- After-tax cash flow
- $2,950/yr
For passive investors: Depreciation is non-cash, so a rental often shows a tax loss while cash-flowing — sheltering income. Rental losses are passive: they offset passive income freely, and up to $25,000/yr can offset ordinary (W-2) income if you actively participate and your MAGI is under $100k (phasing out to $0 by $150k); unused losses carry forward. On sale, claimed depreciation is recaptured at up to 25%, and gains may owe capital-gains tax (a 1031 exchange can defer both). Figures are a year-1 estimate at your 24.0% rate — not tax advice; consult a CPA.
Schools (NCES district)
- District
- Marion
- NCES district ID
- 1201260
- Math proficiency
- 42% ▼ -7.00%
- Reading proficiency
- 43% ▼ -4.00%
- Median HH income
- $40,015
- Composite
- 35.61/100
- National rank
- #4890
- State rank
- #61 of 73 in FL
Livability — Ocala
- Score
- 69/100
- State rank
- #476
- US rank
- #8461
Category grades
Schools grade is shown separately in the Schools card above.
Census & demographics
- Census place
- Ocala, FL
- County
- Marion County · 315,796 people
- City population
- 263,375
- Metro
- Ocala, FL
- Population (ZIP)
- 14,301
- Household income
- $30,174
- Rent vs Own
- Severe rent burden
- 923.0
Population outlook (Marion County) Hauer SSP2
- Today (2025)
- 365,905 people
- By 2030
- 376,768 · +3.0%
- By 2040
- 396,555 · +8.4%
- By 2050
- 412,723 · +12.8%
- By 2075
- 446,090 · +21.9%
- By 2100
- 436,193 · +19.2%
Race, ethnicity, and origin ACS 2023
- Neighborhood character
- Diverse neighborhood (Simpson 0.68)
- Race & ethnicity
- Black 44% White 30% Hispanic / Latino 19% Two or more races 11%
- Hispanic origin (detail)
- Mexican 1% Puerto Rican 8% Cuban 3%
- Common ancestry
- Serbian 2% Hispanic 1% Lithuanian 1%
- Foreign-born
- 8% · Canada, China, Jamaica
- Languages at home
- 84% English-only · Spanish 13% French/Haitian/Cajun 2%
Political lean MEDSL · Marion
- 2024 margin
- Solid R (+31.6) · D 33.8% · R 65.5%
- 2008→2024 swing
- -20.0pp toward R · 2008: -11.6pp · 2024: -31.6pp
- All cycles
- 2024: R+31.6 2020: R+25.9 2016: R+26.2 2012: R+16.2 2008: R+11.6
Not yet ingested
- Civics
- —
Market trends
- HPI YoY
- ▼ -22.26%
- Current HPI
- 254.6319
- Rent YoY
- —
- Metro
- Ocala, FL
- State GDP YoY
- ▲ 3.28%
- F500 in state
- 36
Industry mix (Fortune 500 HQ in FL)
| Industry | F500 HQs | Revenue |
|---|---|---|
| Industrial Technology | 2 | $29B |
|
||
| Insurance | 2 | $17B |
|
||
| Retail | 1 | $60B |
|
||
| Technology Distribution | 1 | $58B |
|
||
| Homebuilding | 1 | $35B |
|
||
| Technology Manufacturing | 1 | $35B |
|
||
Price history
-3.1% since first listed3 events — show timeline
- 2026-05-12 Pending — Stellar MLS as Distributed by MLS Grid
- 2026-05-02 Price Changed $125,000 Stellar MLS as Distributed by MLS Grid
- 2026-04-24 Listed $129,000 Stellar MLS as Distributed by MLS Grid
Property tax history
+19.3%/yrLatest (2025): $309 · +4.3% YoY. Source: county tax records.
Cash-flow waterfall
monthlySold comps — $/sqft
last 12 mo · ≤1 miLoading sold comps…