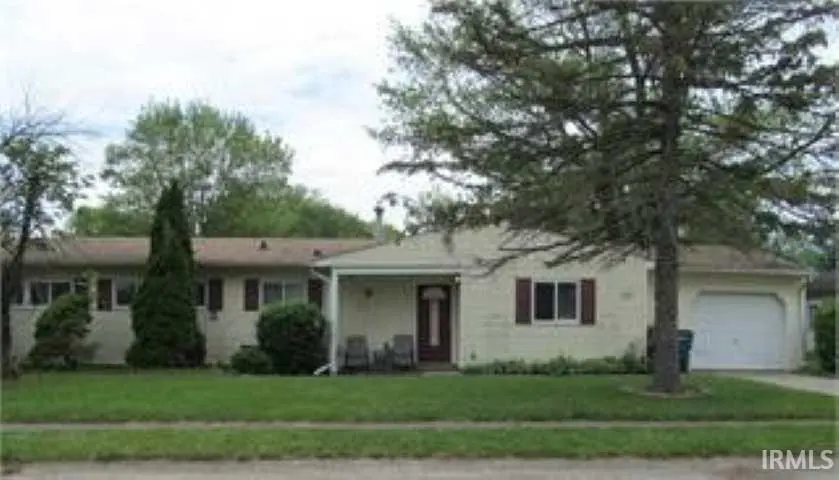
1543 Forbes Ave · Grissom AFB, IN
Flood risk 1/10 · Minimal
- FEMA flood zone
- X (unshaded)
- Chance of flooding over 30 yrs
- 0.0%
- Est. flood insurance / yr
- $507 – $1,088
Fire risk 1/10 · Minimal
- Est. fire insurance / yr
- $717 – $1,331
Heat risk 3/10 · Minor
- Hot days now (above 101°F)
- 7 days/yr
- Hot days in 30 yrs
- 17 days/yr
Wind risk 2/10 · Minimal
- Chance of severe wind over 30 yrs
- —
Air-quality risk 3/10 · Minor
- Unhealthy air days now
- 2 days/yr
- Unhealthy air days in 30 yrs
- 3 days/yr
Risk factors via First Street. Map © Google.
Why this score? — see what drove the C+ grade
The composite is a weighted blend of 9 inputs, each scored 0–100. Each bar is that input's sub-score; the figure is the points it added to the 100-point composite (weight × sub-score).
- Cash flow +30.0/30.0
- DSCR +10.0/10.0
- 1% rule +7.4/10.0
- ARV discount +4.9/15.0
- Livability +3.2/5.0
- Schools +2.8/10.0
- Rent growth +2.5/5.0
- Condition / age +2.5/5.0
- Appreciation +0.0/10.0
$89,000
🖨 Deal sheet (PDF) 📄 Offer letter ✓ Due diligence
Listing remarks MLS
WELL MAINTAINED, THREE BEDROOM, ONE BATH, RANCH STYLE ATTACHED HOME LOCATED IN THE ESTATES OF EAGLE'S POINTE IN MACONAQUAH SCHOOL DISTRICT. THIS HOME HAS SPACIOUS ROOMS, ATTACHED GARAGE, NICE SIZE YARD, AND MUCH MORE.
Key facts
- 7,754 sq ft lot
- Garage
- Community pool
Neighborhood map
What this means for you Summary
Snapshot
- This is a 3-bed/1.0-bath single-family listed at $89k.
Deal economics
- At list price, monthly cash flow is $340 ($4k/yr) — positive.
- The deal already cash-flows at list — no discount required.
- Meets the 1% rule at list price ($1k rent vs $89k).
Location & tenants
- Location reads 65/100 on livability (#359 in IN) — a middle-class / working-renter tenant base. Strengths: cost of living A+, housing A+, crime A; Watch: amenities F, commute F, health & safety D-.
- Maconaquah School Corporation (rural): math 25% / reading 40% proficiency, ranked #213 of 301 in IN (top 71%) — families likely to look elsewhere, expect single-tenant / working-renter base with shorter leases.
- Zoned schools: Maconaquah Elementary School (math 36% / reading 36%, grade F, #577 of 994 statewide, top 59%, 557 students, 67% FRL); Maconaquah Middle School (math 14% / reading 36%, grade F, #247 of 330 statewide, top 76%, 435 students, 63% FRL); Maconaquah High School (math 37% / reading 72%, grade C-, #79 of 369 statewide, top 26%, 594 students, 52% FRL).
- Market conditions: 129 active listings in the ZIP; 6 comparable units currently listed for rent nearby; rentals lingering (median 45d on market — plan ~5-8 weeks vacancy on turnover, expect pricing pressure); 100% of comp listings sitting > 30 days — soft ceiling on asking rent; 35 units permitted in Miami County in 2024 (0 in 5+ unit buildings).
Forward outlook
- Local home prices are declining (-3.0%/yr); year-one equity from $615 of loan paydown is wiped out by about $3k of value loss. Plan a longer hold.
- Miami County population projected at -12% by 2050 — secular population decline; favor cash flow + early exit over multi-decade hold.
- At projected returns (-3.0% appreciation + 3.0% rent growth), your $25k cash investment doubles in ~8 years — after that, you're playing with house money.
Negotiation context
- Only 0 days on market — expect competitive offers; lowballing is unlikely to land.
- Current owner paid $58k; list at $89k implies a 53% gain — meaningful room to come down on a strong offer.
Risks & watch-outs
- Watch-outs: built in 1958 — expect roof / HVAC / electrical / plumbing capex.
Questions for the listing agent
- Built in 1958 — when were the roof, HVAC, electrical panel, plumbing, and water heater last replaced?
- Is there a deadline driving the sale (1031 exchange, divorce, estate, relocation)? That informs how much negotiation room exists.
- Schools are F-rated, which usually means shorter tenancies and higher turnover. Who's the typical renter profile here, and what's been the actual vacancy rate?
- What's the average days-on-market for RENTAL listings here right now (not sales)? A rising rental-DOM trend means longer vacancies and softer asking-rent achievability than the comps imply.
- What's the recent tenant-quality profile in this submarket — average credit score on applications, eviction rate, late-payment / NSF rate, and stable-employment percentage? A property-management company in the area should have these aggregated.
- How much new for-sale + rental construction is in the pipeline within 1–3 miles? Heavy new supply typically softens prices + rents 12–24 months out; constrained supply supports both.
Investment metrics
- 1% rule
- 1.24% ✓
- Cap rate
- 10.88%
- Cash-on-cash
- 16.40%
- DSCR
- 1.73
- GRM
- 6.7
CMA / ARV
- ARV (on-the-fly)
- $84,135
- Comps found
- 9
Show comp detail 9 sales within ~0.75 mi
| Address | Dist | Beds/Ba | Sqft | Sold | Price | $/sf | Match |
|---|---|---|---|---|---|---|---|
| 2942 Travis St | 0.20mi | 3/1.0 | 1,160 (-2%) | 3mo | $120,000 | $103 | 84 |
| 2804 Castle Ct | 0.29mi | 3/2.0 | 1,160 (-2%) | 3mo | $120,000 | $103 | 76 |
| 1129 Barksdale Ave | 0.22mi | 3/1.0 | 1,025 (-14%) | 1mo | $33,500 | $33 | 66 |
| 1617 Warhawk Rd | 0.30mi | 3/1.0 | 1,185 (0%) | 24mo | $77,500 | $65 | 66 |
| 1933 George Ave | 0.11mi | 3/1.0 | 1,025 (-14%) | 10mo | $28,000 | $27 | 64 |
| 2810 Castle Ct | 0.26mi | 3/1.5 | 1,130 (-5%) | 20mo | $110,900 | $98 | 61 |
| 1520 Forbes Ave | 0.15mi | 2/1.0 (-1) | 1,025 (-14%) | 15mo | $100,000 | $98 | 52 |
| 1013 Donaldson St | 0.21mi | 2/1.0 (-1) | 1,026 (-13%) | 18mo | $72,900 | $71 | 48 |
| 41026 Gunter Ct | 0.46mi | 2/1.0 (-1) | 1,059 (-11%) | 17mo | $60,000 | $57 | 42 |
Match score weights: distance 35% · size 25% · config 20% · recency 20%. Top-matched comps best support the ARV.
Projected returns pro-forma
-3.0% appreciation · 3.0% rent growth · sell at horizon
- IRR
- 7.4%
- Equity multiple
- 1.29×
- Total profit
- $7,229
- Equity at exit
- $13,270
- IRR
- 16.7%
- Equity multiple
- 2.37×
- Total profit
- $34,074
- Equity at exit
- $7,695
Cash invested: $24,920 (down + closing). Projections, not guarantees.
Landlord ↔ Tenant lean methodology
- Overall (STATE)
- 90 Strongly Landlord-Friendly
- State Indiana
- 90 Strongly Landlord-Friendly · R+11
- County
- — inherits STATE
- City
- — inherits STATE
ZIP-level market 46970
- Home prices YoY
- -8.8%
- Active inventory
- 129
- Price-to-rent
- 6.7×
Monthly cashflow live
- Estimated rent
- $1,101 high interval (Pro) →
- Mortgage (P&I)
- −$467
- Tax from tax record
- −$26 /mo · $310/yr
- Insurance
- −$37
- HOA
- −$0
- Vacancy / Maint / Mgmt
- −$231
- Net cashflow
- $340
Break-even live
Sensitivity live
| Price | -10% $391 | -5% $366 | +0% $340 | +5% $315 | +10% $290 |
|---|---|---|---|---|---|
| Rent | -10% $253 | -5% $297 | +0% $340 | +5% $384 | +10% $428 |
| Rate | -1.0pp $385 | -0.5pp $363 | base $340 | +0.5pp $317 | +1.0pp $294 |
UW: 25.0% down · 7.5% · 30yr · 1.5% tax · 5.0% vac · 8.0% maint · 8.0% mgmt
Financing live
Cash to close
- Down payment
- $22,250
- Closing costs
- $2,670
- Reserves months
- —
- Total cash needed
- —
Loan-product check · same deal, 3 products live
Conventional
25% down · 7.5% · 30yr
- Down + closing
- —
- Monthly P&I
- —
- Monthly cashflow
- —
- DSCR
- —
- Eligible?
- —
Personal DTI + credit; lowest rate.
DSCR
20% down · 8.5% · 30yr
- Down + closing
- —
- Monthly P&I
- —
- Monthly cashflow
- —
- DSCR
- —
- Eligible?
- —
No personal income docs; deal must DSCR.
Hard money
10% down · 12.0% · 12mo
- Down + closing
- —
- Monthly P&I
- —
- Monthly cashflow
- —
- DSCR
- —
- Eligible?
- —
Short-term bridge; refi at stabilization.
Rent comps 6 comps
| Address | Beds | Baths | Sqft | Rent | $/sqft | DOM | Units | Dist |
|---|---|---|---|---|---|---|---|---|
| 1029 N Lincoln St Peru, IN | 3.0 | 1.0 | 941 | $1,000 | $1.06 | 45d | 1 | 0.25mi |
| 2909 Travis St Peru, IN | 3.0 | 1.5 | 1148 | $1,125 | $0.98 | 45d | 1 | 0.25mi |
| 1005 N Lincoln St Peru, IN | 2.0 | 1.0 | 834 | $855 | $1.03 | 45d | 1 | 0.28mi |
| 1703 S Lincoln St Peru, IN | 3.0 | 2.0 | 1201 | $1,100 | $0.92 | 45d | 1 | 0.36mi |
| 39023 Edwards Ct Peru, IN | 4.0 | 2.5 | 1334 | $1,230 | $0.92 | 45d | 1 | 0.56mi |
| 36013 Beale Ct Peru, IN | 3.0 | 1.5 | 1080 | $1,050 | $0.97 | 45d | 1 | 0.66mi |
Listing history 2 events
-
2026-06-14remarks 213-char remark
-
2026-06-14$89,000 Pending
ⓘ Source: listings_history table (triggers on properties + properties_extension) + one-shot
backfill from property_details.listing_events for pre-trigger history.
Tax reassessment forecast IN · Partial reset (capped growth)
- Current annual tax
- $310 · $26/mo
- Projected year-2 tax
- $533 · $44/mo
- Expected delta
- +$223/yr (+$19/mo · 72.0%)
ⓘ Screening estimate from a state-policy table — verify with the county assessor before closing.
Climate risk First Street
- Flood 1/10 Low FEMA zone X (unshaded) · 0% chance over 30 yrs
- Wildfire 1/10 Low
- Heat 3/10 Moderate 7 d/yr ≥101°F today · 17 d/yr by 30 yrs out
- Wind 2/10 Low
- Air quality 3/10 Moderate 2 unhealthy d/yr today · 3 by 30 yrs out
Nearby sold comps map
Loading sold comps map…
Walkable amenities ~0.75 mi
Loading nearby amenities…
Taxation est. · year 1
- Rental income
- $13,217
- − Mortgage interest
- −$4,985
- − Property taxes
- −$310
- − Insurance
- −$445
- − Repairs & maintenance
- −$1,057
- − Management
- −$1,057
- − Depreciation
- −$2,589
- Taxable income
- $2,773
- Est. tax owed @ 24.0%
- −$666
- After-tax cash flow
- $3,420/yr
For passive investors: Depreciation is non-cash, so a rental often shows a tax loss while cash-flowing — sheltering income. Rental losses are passive: they offset passive income freely, and up to $25,000/yr can offset ordinary (W-2) income if you actively participate and your MAGI is under $100k (phasing out to $0 by $150k); unused losses carry forward. On sale, claimed depreciation is recaptured at up to 25%, and gains may owe capital-gains tax (a 1031 exchange can defer both). Figures are a year-1 estimate at your 24.0% rate — not tax advice; consult a CPA.
Schools (NCES district)
- District
- Maconaquah School Corporation
- NCES district ID
- 1806090
- Math proficiency
- 25% ▼ -12.00%
- Reading proficiency
- 40% ▼ -6.00%
- Median HH income
- $47,296
- Composite
- 27.96/100
- National rank
- #6859
- State rank
- #213 of 301 in IN
Livability — Grissom AFB
- Score
- 65/100
- State rank
- #359
- US rank
- #13555
Category grades
Schools grade is shown separately in the Schools card above.
Census & demographics
- Census place
- Grissom AFB, IN
- County
- Miami County · 23,020 people
- Metro
- Peru, IN
- Population (ZIP)
- 23,020
- Household income
- $57,842
- Rent vs Own
- Severe rent burden
- 498.0
Population outlook (Miami County) Hauer SSP2
- Today (2025)
- 34,421 people
- By 2030
- 33,571 · -2.5%
- By 2040
- 31,919 · -7.3%
- By 2050
- 30,313 · -11.9%
- By 2075
- 26,202 · -23.9%
- By 2100
- 20,856 · -39.4%
Race, ethnicity, and origin ACS 2023
- Neighborhood character
- Predominantly White (87%)
- Race & ethnicity
- White 87% Two or more races 6% Hispanic / Latino 4% Black 3%
- Common ancestry
- Iranian 2% Romanian 2% Slovak 2%
- Foreign-born
- 1% · Canada
- Languages at home
- 97% English-only · Spanish 2% German/W. Germanic 0%
Political lean MEDSL · Miami
- 2024 margin
- Solid R (+54.5) · D 21.8% · R 76.3% · Other 1.9%
- 2008→2024 swing
- -35.1pp toward R · 2008: -19.5pp · 2024: -54.5pp
- All cycles
- 2024: R+54.5 2020: R+53.1 2016: R+53.6 2012: R+30.9 2008: R+19.5
Not yet ingested
- Civics
- —
Market trends
- HPI YoY
- ▼ -24.29%
- Current HPI
- 252.7166
- Rent YoY
- —
- Metro
- Peru, IN
- State GDP YoY
- ▲ 2.90%
- F500 in state
- 18
Industry mix (Fortune 500 HQ in IN)
| Industry | F500 HQs | Revenue |
|---|---|---|
| Industrial Machinery | 2 | $37B |
|
||
| Healthcare | 1 | $177B |
|
||
| Pharmaceuticals | 1 | $45B |
|
||
| Metals / Steel | 1 | $18B |
|
||
| Agriculture | 1 | $17B |
|
||
| Packaging | 1 | $12B |
|
||
Price history
-22.6% since first listed3 events — show timeline
- 2023-11-13 Sold (MLS) $58,000 IRMLS
- 2023-10-18 Pending — IRMLS
- 2023-08-11 Listed $74,900 IRMLS
Property tax history
-1.1%/yrLatest (2024): $310 · +44.1% YoY. Source: county tax records.
Cash-flow waterfall
monthlySold comps — $/sqft
last 12 mo · ≤1 miLoading sold comps…