568 Jennifer · K-Bar Ranch, TX
Flood risk 1/10 · Minimal
- FEMA flood zone
- X (unshaded)
- Chance of flooding over 30 yrs
- 0.0%
- Est. flood insurance / yr
- $507 – $1,088
Fire risk 8/10 · Major
- Est. fire insurance / yr
- $1,222 – $2,270
Heat risk 9/10 · Severe
- Hot days now (above 110°F)
- 7 days/yr
- Hot days in 30 yrs
- 21 days/yr
Wind risk 9/10 · Severe
- Chance of severe wind over 30 yrs
- 99.0%
Air-quality risk 1/10 · Minimal
- Unhealthy air days now
- 0 days/yr
- Unhealthy air days in 30 yrs
- 0 days/yr
Risk factors via First Street. Map © Google.
Why this score? — see what drove the C grade
The composite is a weighted blend of 9 inputs, each scored 0–100. Each bar is that input's sub-score; the figure is the points it added to the 100-point composite (weight × sub-score).
- Cash flow +22.1/30.0
- ARV discount +7.5/15.0
- DSCR +7.1/10.0
- Appreciation +5.7/10.0
- 1% rule +5.0/10.0
- Schools +4.2/10.0
- Rent growth +2.5/5.0
- Livability +2.5/5.0
- Condition / age +2.5/5.0
$132,000
🖨 Deal sheet 📄 Offer letter ✓ Due diligence
Listing remarks MLS
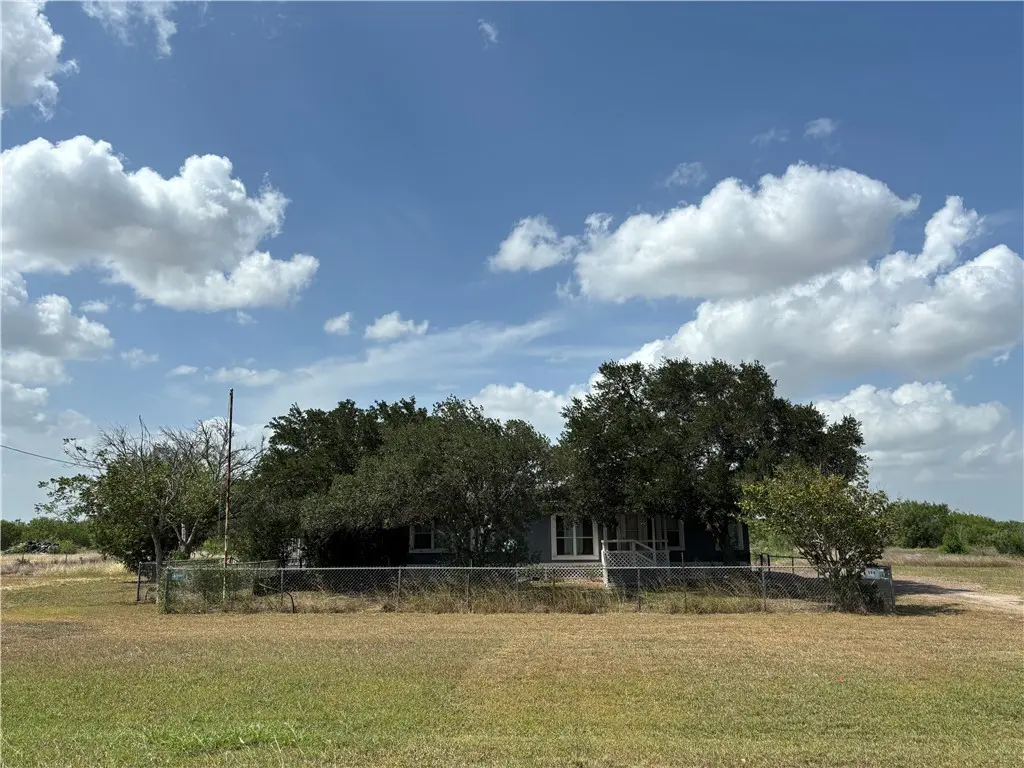
This spacious double-wide 3-bedroom 2 bath manufacture home is located few minutes outside of Orange Gove, Texas. This home sits on large yard approximately 1.6 acres. Also, boasts a big storage shed. With a little TLC this could become a great permanent residents or great income producing property
Key facts
- Big storage shed
- Large yard
- 1.66 acre lot
Tags
Neighborhood map
What this means for you Summary
Snapshot
- This is a 3-bed/2.0-bath manufactured listed at $132k.
Deal economics
- At list price, monthly cash flow is $213 ($3k/yr) — positive.
- The deal already cash-flows at list — no discount required.
- Meets the 1% rule at list price ($1k rent vs $132k).
- Recommended offer: $116k (12.0% below list) — sets the bar for market timing.
Location & tenants
- Location reads: area grade C — affects rentability + tenant quality, not the cash-flow math above.
- Orange Grove ISD (rural): math 49% / reading 49% proficiency, ranked #196 of 826 in TX (top 24%) — families likely to look elsewhere, expect single-tenant / working-renter base with shorter leases.
- Market conditions: 95 active listings in the ZIP; 6 units permitted in Jim Wells County in 2024 (0 in 5+ unit buildings).
Forward outlook
- In year one you build about $3k of equity ($913 loan paydown + $2k appreciation (1.3% local appreciation)).
- Jim Wells County population projected at +10% by 2050 — modest demand growth; plan on rents tracking national, not racing it.
- At projected returns (1.3% appreciation + 3.0% rent growth), your $37k cash investment doubles in ~6 years — after that, you're playing with house money.
Negotiation context
- It's been on market 364 days — a 12% lower offer ($116k) is reasonable based on typical stale-listing flexibility.
- 2 sale attempts since 9y ago; this cycle's ask has dropped $10k (7%) from the opening price — seller is motivated, your offer sets the floor, not the list.
Risks & watch-outs
- Climate carrying-cost: severe wind risk, 99% chance of damaging wind over 30y; severe wildfire risk; extreme-heat days projected 7→21/yr by 2055 (HVAC capex compounding) — expect insurance premiums to compound above CPI over the hold.
Questions for the listing agent
- It's been on market 364 days. Have you received any prior offers? Is the seller open to a 12% concession, seller financing, or rate buy-down credit?
- Why hasn't it sold? Are there any deal-killer items the seller is aware of (foundation, flood, title, zoning, code violations)?
- Is there a deadline driving the sale (1031 exchange, divorce, estate, relocation)? That informs how much negotiation room exists.
- What's the average days-on-market for RENTAL listings here right now (not sales)? A rising rental-DOM trend means longer vacancies and softer asking-rent achievability than the comps imply.
- What's the recent tenant-quality profile in this submarket — average credit score on applications, eviction rate, late-payment / NSF rate, and stable-employment percentage? A property-management company in the area should have these aggregated.
- How much new for-sale + rental construction is in the pipeline within 1–3 miles? Heavy new supply typically softens prices + rents 12–24 months out; constrained supply supports both.
Investment metrics
- 1% rule
- 1.00% ✓
- Cap rate
- 8.23%
- Cash-on-cash
- 6.90%
- DSCR
- 1.31
- GRM
- 8.3
CMA / ARV
No comps found within radius.
Projected returns pro-forma
1.34% appreciation · 3.0% rent growth · sell at horizon
- IRR
- 9.5%
- Equity multiple
- 1.49×
- Total profit
- $18,194
- Equity at exit
- $47,414
- IRR
- 13.1%
- Equity multiple
- 2.64×
- Total profit
- $60,710
- Equity at exit
- $64,870
Cash invested: $36,960 (down + closing). Projections, not guarantees.
Landlord ↔ Tenant lean methodology
- Overall (STATE)
- 87 Strongly Landlord-Friendly
- State Texas
- 87 Strongly Landlord-Friendly · R+5
- County
- — inherits STATE
- City
- — inherits STATE
ZIP-level market 78372
- Home prices YoY
- 1.1%
- Active inventory
- 95
- Price-to-rent
- 8.3×
Monthly cashflow live
- Estimated rent
- $1,321 medium interval (Pro) →
- Mortgage (P&I)
- −$692
- Tax from tax record
- −$83 /mo · $1,001/yr
- Insurance
- −$55
- HOA
- −$0
- Vacancy / Maint / Mgmt
- −$277
- Net cashflow
- $213
Break-even live
UW: 25.0% down · 7.5% · 30yr · 1.5% tax · 5.0% vac · 8.0% maint · 8.0% mgmt
Financing live
Cash to close
- Down payment
- $33,000
- Closing costs
- $3,960
- Reserves months
- —
- Total cash needed
- —
Loan-product check · same deal, 3 products live
Conventional
25% down · 7.5% · 30yr
- Down + closing
- —
- Monthly P&I
- —
- Monthly cashflow
- —
- DSCR
- —
- Eligible?
- —
Personal DTI + credit; lowest rate.
DSCR
20% down · 8.5% · 30yr
- Down + closing
- —
- Monthly P&I
- —
- Monthly cashflow
- —
- DSCR
- —
- Eligible?
- —
No personal income docs; deal must DSCR.
Hard money
10% down · 12.0% · 12mo
- Down + closing
- —
- Monthly P&I
- —
- Monthly cashflow
- —
- DSCR
- —
- Eligible?
- —
Short-term bridge; refi at stabilization.
Listing history 9 events
-
2026-06-02days on market $132,000 Active 364 DOM
-
2026-06-01days on market $132,000 Active 363 DOM
-
2026-05-31days on market $132,000 Active 362 DOM
-
2025-08-12price $132,000 299-char remark
Show marketing remark (299 chars)
This spacious double-wide 3-bedroom 2 bath manufacture home is located few minutes outside of Orange Gove, Texas. This home sits on large yard approximately 1.6 acres. Also, boasts a big storage shed. With a little TLC this could become a great permanent residents or great income producing property
-
2025-06-03$142,500 Active 299-char remark
Show marketing remark (299 chars)
This spacious double-wide 3-bedroom 2 bath manufacture home is located few minutes outside of Orange Gove, Texas. This home sits on large yard approximately 1.6 acres. Also, boasts a big storage shed. With a little TLC this could become a great permanent residents or great income producing property
-
2017-07-31historical 403-char remark
Show marketing remark (403 chars)
Country living yet so close to Orange Grove! In this quite neighborhood you will find this cute double-wide mobile home with wonderful, breezy oak trees in the front yard. The back yard is clear and ready for fun. The home has a open living space with large kitchen and breakfast bar. large utility room and large bedrooms, great for a big family. Be sure and take a look at this and is priced to sell.
-
2017-07-17soldstatus Closed 403-char remark
Show marketing remark (403 chars)
Country living yet so close to Orange Grove! In this quite neighborhood you will find this cute double-wide mobile home with wonderful, breezy oak trees in the front yard. The back yard is clear and ready for fun. The home has a open living space with large kitchen and breakfast bar. large utility room and large bedrooms, great for a big family. Be sure and take a look at this and is priced to sell.
-
2017-06-20status Pending 403-char remark
Show marketing remark (403 chars)
Country living yet so close to Orange Grove! In this quite neighborhood you will find this cute double-wide mobile home with wonderful, breezy oak trees in the front yard. The back yard is clear and ready for fun. The home has a open living space with large kitchen and breakfast bar. large utility room and large bedrooms, great for a big family. Be sure and take a look at this and is priced to sell.
-
2017-05-22$79,000 Active 403-char remark
Show marketing remark (403 chars)
Country living yet so close to Orange Grove! In this quite neighborhood you will find this cute double-wide mobile home with wonderful, breezy oak trees in the front yard. The back yard is clear and ready for fun. The home has a open living space with large kitchen and breakfast bar. large utility room and large bedrooms, great for a big family. Be sure and take a look at this and is priced to sell.
ⓘ Source: listings_history table (triggers on properties + properties_extension) + one-shot
backfill from property_details.listing_events for pre-trigger history.
Tax reassessment forecast TX · Resets to sale price
- Current annual tax
- $1,001 · $83/mo
- Projected year-2 tax
- $2,416 · $201/mo
- Expected delta
- +$1,415/yr (+$118/mo · 141.3%)
ⓘ Screening estimate from a state-policy table — verify with the county assessor before closing.
Climate risk First Street
- Flood 1/10 Low FEMA zone X (unshaded) · 0% chance over 30 yrs
- Wildfire 8/10 Severe
- Heat 9/10 Extreme 7 d/yr ≥110°F today · 21 d/yr by 30 yrs out
- Wind 9/10 Extreme 99% chance of damaging wind over 30 yrs
- Air quality 1/10 Low 0 unhealthy d/yr today · 0 by 30 yrs out
Nearby sold comps map
Loading sold comps map…
Walkable amenities ~0.75 mi
Loading nearby amenities…
Taxation est. · year 1
- Rental income
- $15,848
- − Mortgage interest
- −$7,394
- − Property taxes
- −$1,001
- − Insurance
- −$660
- − Repairs & maintenance
- −$1,268
- − Management
- −$1,268
- − Depreciation
- −$3,840
- Taxable income
- $417
- Est. tax owed @ 24.0%
- −$100
- After-tax cash flow
- $2,452/yr
For passive investors: Depreciation is non-cash, so a rental often shows a tax loss while cash-flowing — sheltering income. Rental losses are passive: they offset passive income freely, and up to $25,000/yr can offset ordinary (W-2) income if you actively participate and your MAGI is under $100k (phasing out to $0 by $150k); unused losses carry forward. On sale, claimed depreciation is recaptured at up to 25%, and gains may owe capital-gains tax (a 1031 exchange can defer both). Figures are a year-1 estimate at your 24.0% rate — not tax advice; consult a CPA.
Schools (NCES district)
- District
- Orange Grove ISD
- NCES district ID
- 4833720
- Math proficiency
- 49% ▼ -6.00%
- Reading proficiency
- 49% ▲ 4.00%
- Median HH income
- $49,348
- Composite
- 41.9/100
- National rank
- #3367
- State rank
- #196 of 826 in TX
Livability — K-Bar Ranch
No livability data for this city. (Only ~50 U.S. cities are tracked.)
Census & demographics
- Population (ZIP)
- 5,066
Population outlook (Jim Wells County) Hauer SSP2
- Today (2025)
- 43,325 people
- By 2030
- 44,156 · +1.9%
- By 2040
- 45,790 · +5.7%
- By 2050
- 47,455 · +9.5%
- By 2075
- 51,800 · +19.6%
- By 2100
- 52,006 · +20.0%
Race, ethnicity, and origin ACS 2023
- Neighborhood character
- Majority Hispanic (56%)
- Race & ethnicity
- Hispanic / Latino 56% White 41% Two or more races 14%
- Hispanic origin (detail)
- Mexican 54%
- Common ancestry
- Arab 2% Italian 1% Romanian 1%
- Foreign-born
- 7% · Canada
- Languages at home
- 60% English-only · Spanish 36% Arabic 4%
Political lean MEDSL · Jim Wells
- 2024 margin
- R (+15.5) · D 42.0% · R 57.5%
- 2008→2024 swing
- -31.6pp toward R · 2008: 16.1pp · 2024: -15.5pp
- All cycles
- 2024: R+15.5 2020: R+9.8 2016: D+10.3 2012: D+17.0 2008: D+16.1
Not yet ingested
- Civics
- —
Market trends
- HPI YoY
- ▲ 1.34%
- Current HPI
- 126.8482
- Rent YoY
- —
- Metro
- —
- State GDP YoY
- ▲ 3.95%
- F500 in state
- 110
Industry mix (Fortune 500 HQ in TX)
| Industry | F500 HQs | Revenue |
|---|---|---|
| Energy | 16 | $1,198B |
|
||
| Technology | 5 | $198B |
|
||
| Engineering / Construction | 4 | $72B |
|
||
| Energy Services | 3 | $60B |
|
||
| Utilities | 3 | $41B |
|
||
| Healthcare | 2 | $330B |
|
||
Price history
+67.1% since first listed6 events — show timeline
- 2025-08-12 Price Changed $132,000 CBMLS
- 2025-06-03 Listed $142,500 CBMLS
- 2017-07-31 Delisted — CBMLS
- 2017-07-17 Sold (MLS) — CBMLS
- 2017-06-20 Pending — CBMLS
- 2017-05-22 Listed $79,000 CBMLS
Property tax history
+11.7%/yrLatest (2025): $1,001 · +11.1% YoY. Source: county tax records.
Cash-flow waterfall
monthlySold comps — $/sqft
last 12 mo · ≤1 miLoading sold comps…