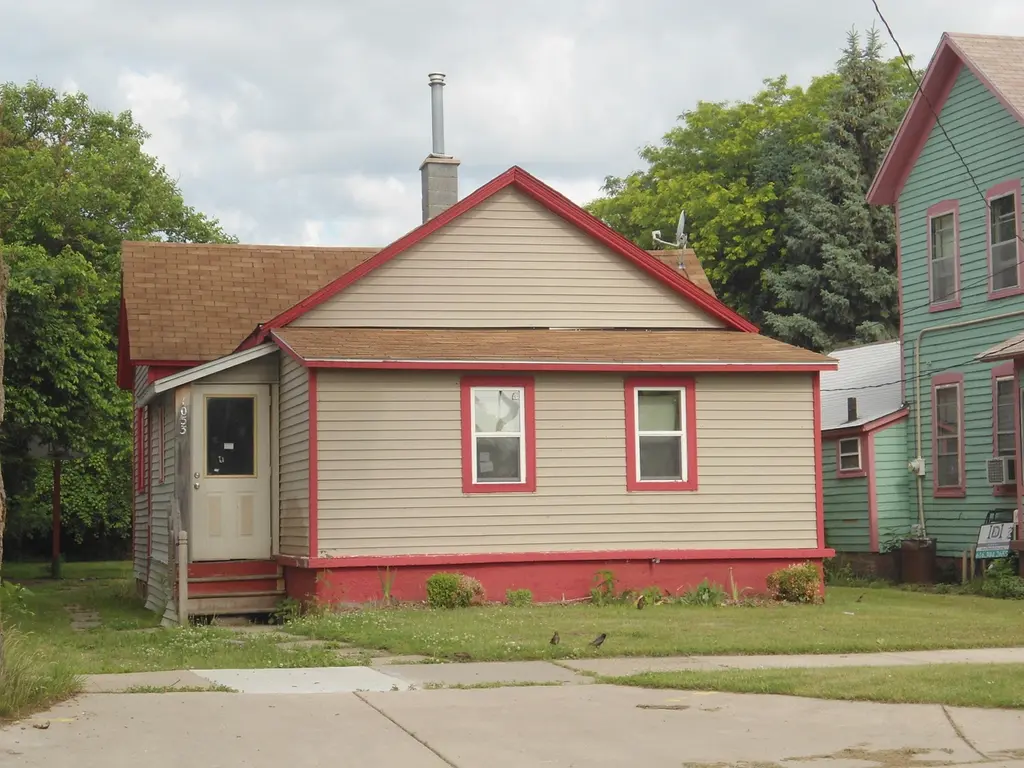
1053 Sheldon Ave SE · Grand Rapids, MI
Flood risk 1/10 · Minimal
- FEMA flood zone
- X (unshaded)
- Chance of flooding over 30 yrs
- 0.0%
- Est. flood insurance / yr
- $473 – $860
Fire risk 1/10 · Minimal
- Est. fire insurance / yr
- $784 – $1,456
Heat risk 3/10 · Minor
- Hot days now (above 96°F)
- 7 days/yr
- Hot days in 30 yrs
- 16 days/yr
Wind risk 2/10 · Minimal
- Chance of severe wind over 30 yrs
- —
Air-quality risk 2/10 · Minimal
- Unhealthy air days now
- 2 days/yr
- Unhealthy air days in 30 yrs
- 2 days/yr
Risk factors via First Street. Map © Google.
Why this score? — see what drove the B grade
The composite is a weighted blend of 9 inputs, each scored 0–100. Each bar is that input's sub-score; the figure is the points it added to the 100-point composite (weight × sub-score).
- Cash flow +28.8/30.0
- ARV discount +15.0/15.0
- DSCR +10.0/10.0
- 1% rule +7.3/10.0
- Livability +4.2/5.0
- Rent growth +3.7/5.0
- Condition / age +2.5/5.0
- Schools +1.9/10.0
- Appreciation +0.0/10.0
$129,900
🖨 Deal sheet 📄 Offer letter ✓ Due diligence
Listing remarks MLS
Investor special with endless potential! Located in the heart of Grand Rapids, this 3 bedroom, 1 bathroom home is ready for a complete transformation. Whether you're an investor searching for your next flip or rental property, or a buyer looking for a blank canvas to create a personalized home from the ground up, this property offers a great opportunity. The home needs a full remodel but features a functional layout and plenty of possibilities to add value. Conveniently located near downtown Grand Rapids, parks, restaurants, and major highways. Bring your vision, creativity, and tools to unlock the potential of 1053 Sheldon Avenue SE! CAUTION WALKING: walking this home may be dangerous and the seller and listing agent are not responsible for any injuries; bathroom does not currently have a floor.
Key facts
- Near restaurants
- Near parks
- Functional layout
Tags
Property features AI
Exterior
- Utilities: Natural gas connected
- Home design: Ranch-style single family residence; Located on 0.18 acre lot; Public water
- Construction: Vinyl siding; Composition roof; Built in 1890
- Exterior features: Paved road access; Sidewalk; Wooded lot
Interior
- Kitchen: Kitchen
- Bedrooms: Primary bedroom; Two additional bedrooms
- Bathrooms: One full bathroom
- Heating & cooling: Forced air heating
- Interior features: Six total rooms; Partial Michigan-style basement
Neighborhood map
What this means for you Summary
Snapshot
- This is a 2-bed/1.0-bath single-family listed at $130k.
Deal economics
- At list price, monthly cash flow is $437 ($5k/yr) — positive.
- The deal already cash-flows at list — no discount required.
- Meets the 1% rule at list price ($2k rent vs $130k).
- Recommended offer: $126k (3.0% below list) — sets the bar for market timing.
- Cap rate 10.3% vs local median 4.5% in Grand Rapids — top-decile yield for the area; either an underpriced asset or a hidden risk that comps aren't pricing in. Stress-test before assuming the spread holds.
Location & tenants
- Location reads 83/100 on livability (#44 in MI, #939 nationally) — a professional / high-income tenant draw. Strengths: amenities A+, commute A+, cost of living A+; Watch: employment C-, crime F.
- Grand Rapids Public Schools (urban): math 15% / reading 29% proficiency, ranked #451 of 540 in MI (top 84%) — low school quality limits family demand, transient renter base, plan for 1-2y turnover; 80% free/reduced lunch — lower-income household profile, screen leases tightly.
- Market conditions: Rents rising fast (+4.7%/yr); 178 active listings in the ZIP; 27 comparable units currently listed for rent nearby; rentals lingering (median 44d on market — plan ~5-8 weeks vacancy on turnover, expect pricing pressure); 67% of comp listings sitting > 30 days — soft ceiling on asking rent; 2,253 units permitted in Kent County in 2024 (969 in 5+ unit buildings).
- This rent runs 31% of the median local income ($61k/yr) — at the standard rent-burdened threshold; future hikes will face affordability resistance.
Forward outlook
- Local home prices are declining (-3.0%/yr); year-one equity from $898 of loan paydown is wiped out by about $4k of value loss. Plan a longer hold.
- Kent County population projected at +22% by 2050 — long-run rental-demand tailwind backs the buy-and-hold thesis.
- At projected returns (-3.0% appreciation + 4.7% rent growth), your $36k cash investment doubles in ~8 years — after that, you're playing with house money.
Negotiation context
- It's been on market 34 days — a 3% lower offer ($126k) is reasonable based on typical stale-listing flexibility.
- 13 sale attempts since 38y ago; this cycle's ask has dropped $10k (7%) from the opening price — seller is motivated, your offer sets the floor, not the list.
- Current owner paid $70k; list at $130k implies a 86% gain — meaningful room to come down on a strong offer.
Risks & watch-outs
- Watch-outs: built in 1890 — expect roof / HVAC / electrical / plumbing capex.
Questions for the listing agent
- It's been on market 34 days. Have you received any prior offers? Is the seller open to a 3% concession, seller financing, or rate buy-down credit?
- Built in 1890 — when were the roof, HVAC, electrical panel, plumbing, and water heater last replaced?
- Is there a deadline driving the sale (1031 exchange, divorce, estate, relocation)? That informs how much negotiation room exists.
- Crime grade is F in this area — have there been break-ins, vandalism, or insurance claims at this property in the last 3 years? What carrier currently insures it and at what premium?
- What's the average days-on-market for RENTAL listings here right now (not sales)? A rising rental-DOM trend means longer vacancies and softer asking-rent achievability than the comps imply.
- What's the recent tenant-quality profile in this submarket — average credit score on applications, eviction rate, late-payment / NSF rate, and stable-employment percentage? A property-management company in the area should have these aggregated.
- How much new for-sale + rental construction is in the pipeline within 1–3 miles? Heavy new supply typically softens prices + rents 12–24 months out; constrained supply supports both.
Investment metrics
- 1% rule
- 1.23% ✓
- Cap rate
- 10.33%
- Cash-on-cash
- 14.40%
- DSCR
- 1.64
- GRM
- 6.8
CMA / ARV
- ARV (median comp)
- $212,597
- List price
- $129,900
- Delta
- -38.90%
- Verdict
- UNDERPRICED
- Comps
- 10 within 2.0 mi
Projected returns pro-forma
-3.0% appreciation · 4.74% rent growth · sell at horizon
- IRR
- 6.6%
- Equity multiple
- 1.26×
- Total profit
- $9,580
- Equity at exit
- $19,369
- IRR
- 17.4%
- Equity multiple
- 2.54×
- Total profit
- $56,159
- Equity at exit
- $11,231
Cash invested: $36,372 (down + closing). Projections, not guarantees.
Landlord ↔ Tenant lean methodology
- Overall (STATE)
- 62 Landlord-Friendly
- State Michigan
- 62 Landlord-Friendly · EVEN
- County
- — inherits STATE
- City
- — inherits STATE
ZIP-level market 49507
- Rents YoY
- 4.7%
- Active inventory
- 178
- Price-to-rent
- 6.8×
Monthly cashflow live
- Estimated rent
- $1,597 high interval (Pro) →
- Mortgage (P&I)
- −$681
- Tax from tax record
- −$90 /mo · $1,080/yr
- Insurance
- −$54
- HOA
- −$0
- Vacancy / Maint / Mgmt
- −$335
- Net cashflow
- $437
Break-even live
UW: 25.0% down · 7.5% · 30yr · 1.5% tax · 5.0% vac · 8.0% maint · 8.0% mgmt
Financing live
Cash to close
- Down payment
- $32,475
- Closing costs
- $3,897
- Reserves months
- —
- Total cash needed
- —
Loan-product check · same deal, 3 products live
Conventional
25% down · 7.5% · 30yr
- Down + closing
- —
- Monthly P&I
- —
- Monthly cashflow
- —
- DSCR
- —
- Eligible?
- —
Personal DTI + credit; lowest rate.
DSCR
20% down · 8.5% · 30yr
- Down + closing
- —
- Monthly P&I
- —
- Monthly cashflow
- —
- DSCR
- —
- Eligible?
- —
No personal income docs; deal must DSCR.
Hard money
10% down · 12.0% · 12mo
- Down + closing
- —
- Monthly P&I
- —
- Monthly cashflow
- —
- DSCR
- —
- Eligible?
- —
Short-term bridge; refi at stabilization.
Rent comps 27 comps
| Address | Beds | Baths | Sqft | Rent | $/sqft | DOM | Units | Dist |
|---|---|---|---|---|---|---|---|---|
| 840 Lafayette Ave SE Unit 2 Grand Rapids, MI | 3.0 | 1.0 | 950 | $1,600 | $1.68 | 43d | 1 | 0.29mi |
| 19 La Belle St SE Grand Rapids, MI | 2.0 | 1.0 | 846 | $1,045 | $1.24 | 43d | 1 | 0.41mi |
| 434 Worden St SE Unit 2 Grand Rapids, MI | 2.0 | 1.0 | 900 | $1,495 | $1.66 | 43d | 1 | 0.45mi |
| 1309 Madison Ave SE Grand Rapids, MI | 1.0–2.0 | 1.0 | 775 | $1,560 | $2.01 | 2d | 1 | 0.54mi |
| 90 Wealthy St SE Grand Rapids, MI | 2.0 | 1.0–2.0 | 602 | $1,850 | $3.07 | 3d | 10 | 0.75mi |
| 400 Grant St SW Unit 2 Grand Rapids, MI | 2.0 | 1.0 | 1000 | $1,500 | $1.50 | 2d | 1 | 0.76mi |
| 350 Ionia Ave SW Grand Rapids, MI | 2.0–3.0 | 2.0–3.0 | 1400 | $1,074 | $0.77 | 11d | 2 | 0.82mi |
| 357 Madison Ave SE Grand Rapids, MI | 1.0–2.0 | 1.0–2.0 | 692 | $1,595 | $2.30 | 43d | 4 | 0.83mi |
| 640 Eastern Ave SE Unit 2D Grand Rapids, MI | 1.0 | 1.0 | 609 | $1,295 | $2.13 | 43d | 1 | 0.95mi |
| 240 Ionia Ave SW Grand Rapids, MI | 1.0–2.0 | 1.0–2.0 | 922 | $1,280 | $1.39 | 43d | 2 | 0.95mi |
| 216 Lafayette Ave SE Grand Rapids, MI | 2.0 | 1.5 | 1000 | $1,395 | $1.40 | 43d | 1 | 0.97mi |
| 459 Dickinson St SE Grand Rapids, MI | 2.0 | 1.0 | 731 | $1,195 | $1.63 | 43d | 1 | 0.97mi |
| 209 Division Ave S Grand Rapids, MI | 1.0–3.0 | 1.0–2.0 | 1180 | $1,218 | $1.03 | 21d | 2 | 0.99mi |
| 638 Wealthy St SE Unit A Grand Rapids, MI | 2.0 | 2.0 | 1000 | $2,100 | $2.10 | 43d | 1 | 0.99mi |
| 26 Cherry St SW Grand Rapids, MI | 1.0–2.0 | 1.0–2.0 | 878 | $1,275 | $1.45 | 43d | 2 | 1.00mi |
| 470 Market Ave SW Grand Rapids, MI | 2.0 | 1.0–2.0 | 622 | $2,090 | $3.36 | 2d | 17 | 1.04mi |
| 242 Elm St SW Grand Rapids, MI | 2.0 | 1.5 | 1100 | $3,200 | $2.91 | 2d | 1 | 1.07mi |
| 345 State St SE Grand Rapids, MI | 2.0 | 2.0 | 1107 | $1,280 | $1.16 | 43d | 2 | 1.08mi |
| 410 Eastern Ave SE Unit 2 Grand Rapids, MI | 1.0 | 1.0 | 600 | $1,195 | $1.99 | 43d | 1 | 1.11mi |
| 547 Cherry St SE Grand Rapids, MI | 2.0 | 1.0 | 521 | $1,250 | $2.40 | 43d | 1 | 1.18mi |
| 17 Lafayette Ave SE Grand Rapids, MI | 2.0 | 1.0–2.0 | 720 | $2,125 | $2.95 | 43d | 7 | 1.22mi |
| 138 Fulton St E Unit 2 Grand Rapids, MI | 2.0 | 1.0 | 800 | $1,800 | $2.25 | 43d | 1 | 1.25mi |
| 20 Fulton St E Grand Rapids, MI | 1.0 | 1.0 | 687 | $1,750 | $2.55 | 43d | 1 | 1.25mi |
| 2040 Division Ave S Unit 207 Grand Rapids, MI | 2.0 | 1.0 | 768 | $1,703 | $2.22 | 2d | 1 | 1.29mi |
| 2040 Division Ave S Unit 205 Grand Rapids, MI | 1.0 | 1.0 | 719 | $1,490 | $2.07 | 2d | 1 | 1.29mi |
| 1114 Dunham St SE Unit 1 Grand Rapids, MI | 2.0 | 1.0 | 894 | $1,300 | $1.45 | 43d | 1 | 1.32mi |
| 27 Library St NE #501 Grand Rapids, MI | 2.0 | 2.0 | 1109 | $2,925 | $2.64 | 43d | 1 | 1.36mi |
Listing history 36 events
-
2026-06-18days on market $129,900 Active 34 DOM
-
2026-06-17days on market $129,900 Active 33 DOM
-
2026-06-16days on market $129,900 Active 32 DOM
-
2026-06-15days on market $129,900 Active 31 DOM
-
2026-06-14days on market $129,900 Active 29 DOM
-
2026-06-13days on market $129,900 Active 28 DOM
-
2026-06-10days on market $129,900 Active 26 DOM
-
2026-06-09days on market $129,900 Active 25 DOM
-
2026-06-08days on market $129,900 Active 24 DOM
-
2026-06-07days on market $129,900 Active 23 DOM
-
2026-06-05days on market $129,900 Active 20 DOM
-
2026-06-03days on market $129,900 Active 19 DOM
-
2026-06-03days on market $129,900 Active 18 DOM
-
2026-06-01days on market $129,900 Active 17 DOM
-
2026-05-31days on market $129,900 Active 16 DOM
-
2026-05-15$139,900 Active 807-char remark
Show marketing remark (807 chars)
Investor special with endless potential! Located in the heart of Grand Rapids, this 3 bedroom, 1 bathroom home is ready for a complete transformation. Whether you're an investor searching for your next flip or rental property, or a buyer looking for a blank canvas to create a personalized home from the ground up, this property offers a great opportunity. The home needs a full remodel but features a functional layout and plenty of possibilities to add value. Conveniently located near downtown Grand Rapids, parks, restaurants, and major highways. Bring your vision, creativity, and tools to unlock the potential of 1053 Sheldon Avenue SE! CAUTION WALKING: walking this home may be dangerous and the seller and listing agent are not responsible for any injuries; bathroom does not currently have a floor.
-
2026-05-15$139,900 Active
Show marketing remark (807 chars)
Investor special with endless potential! Located in the heart of Grand Rapids, this 3 bedroom, 1 bathroom home is ready for a complete transformation. Whether you're an investor searching for your next flip or rental property, or a buyer looking for a blank canvas to create a personalized home from the ground up, this property offers a great opportunity. The home needs a full remodel but features a functional layout and plenty of possibilities to add value. Conveniently located near downtown Grand Rapids, parks, restaurants, and major highways. Bring your vision, creativity, and tools to unlock the potential of 1053 Sheldon Avenue SE! CAUTION WALKING: walking this home may be dangerous and the seller and listing agent are not responsible for any injuries; bathroom does not currently have a floor.
-
2015-02-05historical
-
2015-01-28historical
-
2015-01-28historical
-
2015-01-28historical
-
2005-07-08soldstatus $70,000
-
2005-05-16historical
-
2004-12-16$66,900
-
2004-12-16$66,900
-
1998-04-14soldstatus $35,500
-
1998-04-14soldstatus $35,500
-
1997-12-09$34,900
-
1997-12-09$34,900
-
1989-09-19$15,000
-
1989-09-19$15,000
-
1989-02-23$15,000
-
1989-02-23$15,000
-
1988-08-03$15,000
-
1988-08-03$15,000
ⓘ Source: listings_history table (triggers on properties + properties_extension) + one-shot
backfill from property_details.listing_events for pre-trigger history.
Tax reassessment forecast MI · Partial reset (capped growth)
- Current annual tax
- $1,080 · $90/mo
- Projected year-2 tax
- $1,540 · $128/mo
- Expected delta
- +$460/yr (+$38/mo · 42.6%)
ⓘ Screening estimate from a state-policy table — verify with the county assessor before closing.
Climate risk First Street
- Flood 1/10 Low FEMA zone X (unshaded) · 0% chance over 30 yrs
- Wildfire 1/10 Low
- Heat 3/10 Moderate 7 d/yr ≥96°F today · 16 d/yr by 30 yrs out
- Wind 2/10 Low
- Air quality 2/10 Low 2 unhealthy d/yr today · 2 by 30 yrs out
Nearby sold comps map
Loading sold comps map…
Walkable amenities ~0.75 mi
Loading nearby amenities…
Taxation est. · year 1
- Rental income
- $19,169
- − Mortgage interest
- −$7,276
- − Property taxes
- −$1,080
- − Insurance
- −$650
- − Repairs & maintenance
- −$1,533
- − Management
- −$1,533
- − Depreciation
- −$3,779
- Taxable income
- $3,316
- Est. tax owed @ 24.0%
- −$796
- After-tax cash flow
- $4,443/yr
For passive investors: Depreciation is non-cash, so a rental often shows a tax loss while cash-flowing — sheltering income. Rental losses are passive: they offset passive income freely, and up to $25,000/yr can offset ordinary (W-2) income if you actively participate and your MAGI is under $100k (phasing out to $0 by $150k); unused losses carry forward. On sale, claimed depreciation is recaptured at up to 25%, and gains may owe capital-gains tax (a 1031 exchange can defer both). Figures are a year-1 estimate at your 24.0% rate — not tax advice; consult a CPA.
Schools (NCES district)
- District
- Grand Rapids Public Schools
- NCES district ID
- 2616440
- Math proficiency
- 15% ▼ -5.00%
- Reading proficiency
- 29% ▼ -1.00%
- Median HH income
- $40,612
- Composite
- 18.62/100
- National rank
- #8899
- State rank
- #451 of 540 in MI
Livability — Grand Rapids
- Score
- 83/100
- State rank
- #44
- US rank
- #939
Category grades
Schools grade is shown separately in the Schools card above.
Census & demographics
- Census place
- Grand Rapids, MI
- County
- Kent County · 533,805 people
- City population
- 181,325
- Metro
- Grand Rapids-Kentwood, MI
- Population (ZIP)
- 38,487
- Household income
- $61,461
- Rent vs Own
- Severe rent burden
- 1625.0
Population outlook (Kent County) Hauer SSP2
- Today (2025)
- 712,484 people
- By 2030
- 748,618 · +5.1%
- By 2040
- 814,777 · +14.4%
- By 2050
- 868,556 · +21.9%
- By 2075
- 966,487 · +35.7%
- By 2100
- 967,975 · +35.9%
Race, ethnicity, and origin ACS 2023
- Neighborhood character
- Highly diverse neighborhood (Simpson 0.71)
- Race & ethnicity
- Hispanic / Latino 31% Black 31% White 30% Two or more races 21%
- Hispanic origin (detail)
- Mexican 18% Puerto Rican 3% Dominican 1%
- Common ancestry
- Iranian 8% Romanian 2% Lithuanian 1%
- Foreign-born
- 18% · Canada
- Languages at home
- 71% English-only · Spanish 23% Arabic 1% Other Indo-European 1%
Political lean MEDSL · Kent
- 2024 margin
- Lean D (+5.4) · D 51.8% · R 46.5% · Other 1.7%
- 2008→2024 swing
- +4.8pp toward D · 2008: 0.5pp · 2024: 5.4pp
- All cycles
- 2024: D+5.4 2020: D+6.1 2016: R+3.1 2012: R+7.9 2008: D+0.5
Not yet ingested
- Civics
- —
Market trends
- HPI YoY
- ▼ -301.99%
- Current HPI
- 325.3878
- Rent YoY
- ▲ 4.74%
- Metro
- Grand Rapids-Kentwood, MI
- State GDP YoY
- ▲ 1.37%
- F500 in state
- 28
Industry mix (Fortune 500 HQ in MI)
| Industry | F500 HQs | Revenue |
|---|---|---|
| Automotive Parts | 3 | $48B |
|
||
| Automotive | 2 | $372B |
|
||
| Chemicals | 1 | $45B |
|
||
| Automotive Retail | 1 | $29B |
|
||
| Healthcare / Medical Devices | 1 | $23B |
|
||
| Automotive Technology | 1 | $20B |
|
||
Price history
+766.0% since first listed24 events — show timeline
- 2026-05-27 Price Changed $129,900 MiRealSource-MiMLS
- 2026-05-27 Price Changed $129,900 REALCOMP
- 2026-05-27 Price Changed $129,900 SW Michigan MLS
- 2026-05-15 Listed $139,900 SW Michigan MLS
- 2026-05-15 Listed $139,900 REALCOMP
- 2026-05-15 Listed $139,900 MiRealSource-MiMLS
- 2015-02-05 Listing Removed — SW Michigan MLS
- 2015-01-28 Listing Removed — SW Michigan MLS
- 2015-01-28 Listing Removed — SW Michigan MLS
- 2015-01-28 Listing Removed — SW Michigan MLS
- 2005-07-08 Sold (Public Records) $70,000 Public Records
- 2005-05-16 Listing Removed — REALCOMP
- 2004-12-16 Listed $66,900 REALCOMP
- 2004-12-16 Listed $66,900 SW Michigan MLS
- 1998-04-14 Sold (MLS) $35,500 REALCOMP
- 1998-04-14 Sold (MLS) $35,500 SW Michigan MLS
- 1997-12-09 Listed $34,900 REALCOMP
- 1997-12-09 Listed $34,900 SW Michigan MLS
- 1989-09-19 Listed $15,000 REALCOMP
- 1989-09-19 Listed $15,000 SW Michigan MLS
- 1989-02-23 Listed $15,000 REALCOMP
- 1989-02-23 Listed $15,000 SW Michigan MLS
- 1988-08-03 Listed $15,000 REALCOMP
- 1988-08-03 Listed $15,000 SW Michigan MLS
Property tax history
+1.4%/yrLatest (2025): $1,080 · +2.7% YoY. Source: county tax records.
Cash-flow waterfall
monthlySold comps — $/sqft
last 12 mo · ≤1 miLoading sold comps…