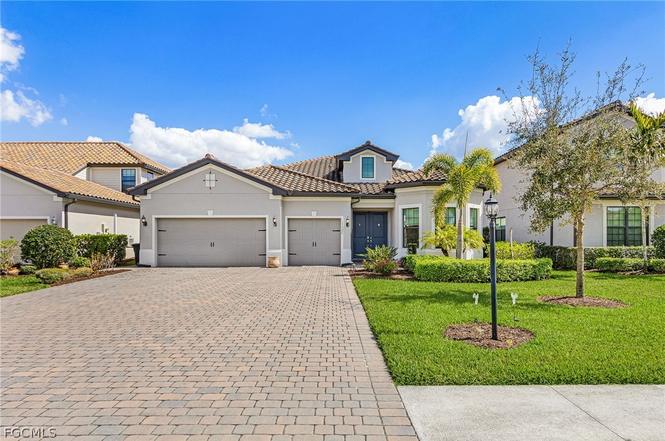
17526 Elkgrove Ln · Estero, FL
Flood risk 1/10 · Minimal
- FEMA flood zone
- X (unshaded)
- Chance of flooding over 30 yrs
- 0.0%
- Est. flood insurance / yr
- $507 – $1,088
Fire risk 7/10 · Major
- Est. fire insurance / yr
- $947 – $1,759
Heat risk 9/10 · Severe
- Hot days now (above 107°F)
- 7 days/yr
- Hot days in 30 yrs
- 29 days/yr
Wind risk 10/10 · Severe
- Chance of severe wind over 30 yrs
- 99.0%
Air-quality risk 2/10 · Minimal
- Unhealthy air days now
- 1 days/yr
- Unhealthy air days in 30 yrs
- 1 days/yr
Risk factors via First Street. Map © Google.
Why this score? — see what drove the D grade
The composite is a weighted blend of 9 inputs, each scored 0–100. Each bar is that input's sub-score; the figure is the points it added to the 100-point composite (weight × sub-score).
- ARV discount +15.0/15.0
- Cash flow +8.2/30.0
- Schools +4.1/10.0
- Livability +4.0/5.0
- 1% rule +3.3/10.0
- Condition / age +2.5/5.0
- DSCR +2.2/10.0
- Rent growth +2.1/5.0
- Appreciation +0.0/10.0
$739,000
🖨 Deal sheet 📄 Offer letter ✓ Due diligence
Listing remarks
The Place at Corkscrew is one of Southwest Florida’s most desirable communities. The minute you enter the double front doors of this beautiful home, you will feel the 2852 square foot of luxury living space that this home has to offer. With the Open floor plan combined with the volume ceiling heights gives you a very nice sence of space. Sellers have $75,000 in Builder upgrades in this Beautiful Home. The gourmet kitchen with its oversized sit up to island, offers ample cabinetry and a walk in Pantry, opening directly to the spacious great room with a dedicated home office space. The Guest Bedrooms each having there own bathrooms, are positioned on opposite sides of the home to create
Key facts
- Indoor restaurant
- Gourmet kitchen
- Walk in pantry
Tags
Property features AI
Finance
- Financial info: Pets allowed
- HOA & community: Homeowners association with quarterly fee; Association fee includes management, irrigation water, grounds maintenance, recreation facilities, road maintenance, street lights, security and trash; Community amenities include clubhouse, pool, spa/hot tub, fitness center, playground, dog park, park, cabana, restaurant, basketball and tennis courts, pickleball, bocce, sport court, sidewalks and on-site management; Gated community with street lights
Exterior
- Parking: Attached 3-car garage; Driveway parking; Paved parking; Garage door opener; Two parking spaces noted
- Security: Gated community with guard; Security gate; Smoke detector(s)
- Utilities: Public water; Public sewer; Cable available; High speed internet available; Underground utilities; Irrigation uses reclaimed water
- Home design: Single-story home; Entry level: 1; Resale property; Faces west
- Construction: Block, concrete and stucco construction; Tile roof
- Exterior features: Lanai; Screened porch; Porch; Sprinkler/irrigation (automatic); Room for pool; Shutters (manual); East exposure; Has view
Interior
- Kitchen: Built-In Oven; Range; Microwave; Dishwasher; Disposal; Refrigerator with ice maker; Freezer; Icemaker; Kitchen island; Pantry; Eat-in kitchen
- Bedrooms: Includes bedroom on the main level
- Flooring: Carpet; Tile
- Bathrooms: 3 full bathrooms; Dual sinks; Separate shower
- Heating & cooling: Central heating (electric); Central air (electric); Ceiling fan(s)
- Interior features: Unfurnished; Bedroom on main level; Main level primary; Separate/formal dining room; Entrance foyer; Eat-in kitchen; Kitchen island; Pantry; Walk-in pantry; Walk-in closet(s); Dual sinks; Separate shower (shower only); High ceilings; Living/Dining room; French doors/atrium doors; Window treatments; Cable TV; High speed internet; Split bedrooms
- Laundry & utility: Washer; Dryer; Laundry tub; Laundry inside
Neighborhood map
What this means for you Summary
Snapshot
- This is a 3-bed/3.0-bath single-family listed at $739k.
Deal economics
- At list price, monthly cash flow is $-699 ($-8k/yr) — negative.
- To cash-flow at today's rent, offer at most $616k (16.7% below list).
- To meet the 1% rule (rent ≥ 1% of price), the offer needs to be $610k (17.4% below list).
- Recommended offer: $610k (17.4% below list) — sets the bar for 1% rule.
- Cap rate 5.2% vs local median 3.4% in Estero — top-decile yield for the area; either an underpriced asset or a hidden risk that comps aren't pricing in. Stress-test before assuming the spread holds.
Location & tenants
- Location reads 79/100 on livability (#149 in FL, #2,242 nationally) — a middle-class / working-renter tenant base. Strengths: crime A+, employment A+, housing A+; Watch: amenities F, commute F, cost of living D-.
- Lee (suburban): math 47% / reading 50% proficiency, ranked #42 of 73 in FL (top 58%) — families likely to look elsewhere, expect single-tenant / working-renter base with shorter leases.
- Market conditions: Rents soft (-1.4%/yr); 668 active listings in the ZIP; 16 comparable units currently listed for rent nearby; rentals at typical pace (median 24d on market — plan ~3-4 weeks tenant-placement turnaround); solid renter incomes; 15,411 units permitted in Lee County in 2024 (4,686 in 5+ unit buildings).
- At $6,103/mo this rent would consume 71% of the median local household income ($103k/yr) (locally 606% of renters already pay >50% of income on rent) — very limited rent-growth headroom before tenants either downsize or default.
Forward outlook
- Local home prices are declining (-3.0%/yr); year-one equity from $5k of loan paydown is wiped out by about $22k of value loss. Plan a longer hold.
- Lee County population projected at +44% by 2050 — long-run rental-demand tailwind backs the buy-and-hold thesis.
Negotiation context
- It's been on market 116 days — a 9% lower offer ($672k) is reasonable based on typical stale-listing flexibility.
- Current owner paid $5k; list at $739k implies a 15019% gain — meaningful room to come down on a strong offer.
Risks & watch-outs
- Climate carrying-cost: severe wind risk, 99% chance of damaging wind over 30y; major wildfire risk; extreme-heat days projected 7→29/yr by 2055 (HVAC capex compounding) — expect insurance premiums to compound above CPI over the hold.
Questions for the listing agent
- What do current leases actually rent for vs. the listed asking? Can we see a recent rent roll and the last 12 months of T-12 income?
- It's been on market 116 days. Have you received any prior offers? Is the seller open to a 17% concession, seller financing, or rate buy-down credit?
- What does the HOA fee cover, when was the last increase, and are there any pending special assessments or reserve-fund shortfalls?
- Why hasn't it sold? Are there any deal-killer items the seller is aware of (foundation, flood, title, zoning, code violations)?
- Is there a deadline driving the sale (1031 exchange, divorce, estate, relocation)? That informs how much negotiation room exists.
- Schools are A-rated — typically a magnet for longer-tenancy family renters. What's the average tenant stay here, and is there a school-zone premium baked into asking?
- The area grade is low — what's the realistic commute time and amenity access for the typical tenant pool here? Any planned neighborhood developments (good or bad) we should know about?
- What's the average days-on-market for RENTAL listings here right now (not sales)? A rising rental-DOM trend means longer vacancies and softer asking-rent achievability than the comps imply.
- What's the recent tenant-quality profile in this submarket — average credit score on applications, eviction rate, late-payment / NSF rate, and stable-employment percentage? A property-management company in the area should have these aggregated.
- How much new for-sale + rental construction is in the pipeline within 1–3 miles? Heavy new supply typically softens prices + rents 12–24 months out; constrained supply supports both.
Investment metrics
- 1% rule
- 0.83% ✗
- Cap rate
- 5.16%
- Cash-on-cash
- -4.05%
- DSCR
- 0.82
- GRM
- 10.1
CMA / ARV
- ARV (on-the-fly)
- $944,012
- Comps found
- 8
Show comp detail 8 sales within ~0.75 mi
| Address | Dist | Beds/Ba | Sqft | Sold | Price | $/sf | Match |
|---|---|---|---|---|---|---|---|
| 17574 Ashcomb Way | 0.42mi | 3/3.0 | 2,866 (+0%) | 1mo | $950,000 | $331 | 79 |
| 17430 Elkgrove Ln | 0.25mi | 3/4.0 | 2,797 (-2%) | 16mo | $818,000 | $292 | 68 |
| 19136 Elston Way | 0.57mi | 3/3.5 | 2,976 (+4%) | 3mo | $975,000 | $328 | 62 |
| 19743 Beechcrest Pl | 0.24mi | 4/3.0 (+1) | 2,491 (-13%) | 14mo | $965,000 | $387 | 51 |
| 17615 Kinzie Ln | 0.40mi | 3/3.0 | 2,491 (-13%) | 15mo | $839,000 | $337 | 48 |
| 17586 Ashcomb Way | 0.45mi | 3/3.0 | 2,445 (-14%) | 9mo | $575,000 | $235 | 48 |
| 19612 The Place Blvd | 0.68mi | 3/3.0 | 2,445 (-14%) | 2mo | $820,000 | $335 | 43 |
| 17203 Ashcomb Way | 0.68mi | 4/3.0 (+1) | 2,491 (-13%) | 3mo | $675,000 | $271 | 40 |
Match score weights: distance 35% · size 25% · config 20% · recency 20%. Top-matched comps best support the ARV.
Projected returns pro-forma
-3.0% appreciation · 0.0% rent growth · sell at horizon
- IRR
- -26.8%
- Equity multiple
- 0.12×
- Total profit
- $-181,796
- Equity at exit
- $110,187
- IRR
- -41.2%
- Equity multiple
- -0.37×
- Total profit
- $-283,330
- Equity at exit
- $63,895
Cash invested: $206,920 (down + closing). Projections, not guarantees.
Landlord ↔ Tenant lean methodology
- Overall (STATE)
- 87 Strongly Landlord-Friendly
- State Florida
- 87 Strongly Landlord-Friendly · R+3
- County
- — inherits STATE
- City
- — inherits STATE
ZIP-level market 33928
- Rents YoY
- -1.4%
- Active inventory
- 668
- Price-to-rent
- 10.1×
Monthly cashflow live
- Estimated rent
- $6,103 high interval (Pro) →
- Mortgage (P&I)
- −$3,875
- Tax from tax record
- −$881 /mo · $10,570/yr
- Insurance
- −$308
- HOA
- −$456
- Vacancy / Maint / Mgmt
- −$1,282
- Net cashflow
- $-699
Break-even live
UW: 25.0% down · 7.5% · 30yr · 1.5% tax · 5.0% vac · 8.0% maint · 8.0% mgmt
Financing live
Cash to close
- Down payment
- $184,750
- Closing costs
- $22,170
- Reserves months
- —
- Total cash needed
- —
Loan-product check · same deal, 3 products live
Conventional
25% down · 7.5% · 30yr
- Down + closing
- —
- Monthly P&I
- —
- Monthly cashflow
- —
- DSCR
- —
- Eligible?
- —
Personal DTI + credit; lowest rate.
DSCR
20% down · 8.5% · 30yr
- Down + closing
- —
- Monthly P&I
- —
- Monthly cashflow
- —
- DSCR
- —
- Eligible?
- —
No personal income docs; deal must DSCR.
Hard money
10% down · 12.0% · 12mo
- Down + closing
- —
- Monthly P&I
- —
- Monthly cashflow
- —
- DSCR
- —
- Eligible?
- —
Short-term bridge; refi at stabilization.
Rent comps 16 comps
| Address | Beds | Baths | Sqft | Rent | $/sqft | DOM | Units | Dist |
|---|---|---|---|---|---|---|---|---|
| 19752 Beechcrest Pl Estero, FL | 4.0 | 3.0 | 2491 | $5,000 | $2.01 | 3d | 1 | 0.20mi |
| 19824 Beechcrest Pl Estero, FL | 3.0 | 3.0 | 2202 | $7,000 | $3.18 | 23d | 1 | 0.32mi |
| 19347 Elston Way Estero, FL | 4.0 | 3.0 | 2032 | $7,500 | $3.69 | 23d | 1 | 0.40mi |
| 19074 Elston Way Estero, FL | 3.0 | 2.5 | 2964 | $9,500 | $3.21 | 23d | 1 | 0.47mi |
| 19563 Utopia Ln Estero, FL | 3.0 | 2.0 | 2010 | $5,995 | $2.98 | 23d | 1 | 0.52mi |
| 19860 The Pl Blvd Miromar Lakes, FL | 4.0 | 3.0 | 2606 | $3,600 | $1.38 | 3d | 1 | 0.70mi |
| 19701 Deming Ln Estero, FL | 4.0 | 3.0 | 2032 | $6,500 | $3.20 | 23d | 1 | 0.74mi |
| 19712 Deming Ln Estero, FL | 3.0 | 3.0 | 2091 | $8,500 | $4.07 | 21d | 1 | 0.77mi |
| 20024 Hartford Blvd Estero, FL | 3.0 | 2.0 | 2081 | $6,950 | $3.34 | 23d | 1 | 1.34mi |
| 20015 Napa Loop Estero, FL | 3.0 | 3.0 | 2202 | $8,000 | $3.63 | 23d | 1 | 1.36mi |
| 20040 Hartford Blvd Estero, FL | 3.0 | 4.0 | 2534 | $3,800 | $1.50 | 23d | 1 | 1.38mi |
| 20047 Napa Loop Estero, FL | 3.0 | 3.0 | 2202 | $9,000 | $4.09 | 3d | 1 | 1.43mi |
| 20047 Napa Loop Estero, FL | 3.0 | 3.0 | 2621 | $3,495 | $1.33 | 16d | 1 | 1.43mi |
| 18262 Parksville Dr Estero, FL | 4.0 | 3.0 | 2098 | $3,700 | $1.76 | 23d | 1 | 1.45mi |
| 20210 Kingmont Dr Estero, FL | 4.0 | 3.0 | 2267 | $3,995 | $1.76 | 23d | 1 | 1.46mi |
| 18282 Parksville Dr Estero, FL | 3.0 | 3.0 | 2126 | $10,000 | $4.70 | 23d | 1 | 1.48mi |
HOA detail
- Monthly dues
- $456 · $5,472/yr
Listing history 12 events
-
2026-06-17days on market $739,000 Active 116 DOM
-
2026-06-16days on market $739,000 Active 115 DOM
-
2026-06-15days on market $739,000 Active 114 DOM
-
2026-06-13days on market $739,000 Active 112 DOM
-
2026-06-10days on market $739,000 Active 109 DOM
-
2026-06-09days on market $739,000 Active 108 DOM
-
2026-06-07days on market $739,000 Active 106 DOM
-
2026-06-02days on market $739,000 Active 101 DOM
-
2026-06-01days on market $739,000 Active 100 DOM
-
2026-06-01days on market $739,000 Active 99 DOM
-
2026-02-20$739,000 Active
-
2020-08-21soldstatus $4,888
ⓘ Source: listings_history table (triggers on properties + properties_extension) + one-shot
backfill from property_details.listing_events for pre-trigger history.
Tax reassessment forecast FL · Resets to sale price
- Current annual tax
- $10,570 · $881/mo
- Projected year-2 tax
- $10,570 · $881/mo
- Expected delta
- $0/yr ($0/mo · 0.0%)
ⓘ Screening estimate from a state-policy table — verify with the county assessor before closing.
Climate risk First Street
- Flood 1/10 Low FEMA zone X (unshaded) · 0% chance over 30 yrs
- Wildfire 7/10 Severe
- Heat 9/10 Extreme 7 d/yr ≥107°F today · 29 d/yr by 30 yrs out
- Wind 10/10 Extreme 99% chance of damaging wind over 30 yrs
- Air quality 2/10 Low 1 unhealthy d/yr today · 1 by 30 yrs out
Nearby sold comps map
Loading sold comps map…
Walkable amenities ~0.75 mi
Loading nearby amenities…
Taxation est. · year 1
- Rental income
- $73,235
- − Mortgage interest
- −$41,395
- − Property taxes
- −$10,570
- − Insurance
- −$3,695
- − Repairs & maintenance
- −$5,859
- − Management
- −$5,859
- − HOA
- −$5,472
- − Depreciation
- −$21,498
- Taxable loss
- −$21,113
- Est. tax savings @ 24.0%
- +$5,067
- After-tax cash flow
- $-3,319/yr
For passive investors: Depreciation is non-cash, so a rental often shows a tax loss while cash-flowing — sheltering income. Rental losses are passive: they offset passive income freely, and up to $25,000/yr can offset ordinary (W-2) income if you actively participate and your MAGI is under $100k (phasing out to $0 by $150k); unused losses carry forward. On sale, claimed depreciation is recaptured at up to 25%, and gains may owe capital-gains tax (a 1031 exchange can defer both). Figures are a year-1 estimate at your 24.0% rate — not tax advice; consult a CPA.
Schools (NCES district)
- District
- Lee
- NCES district ID
- 1201080
- Math proficiency
- 47% ▼ -11.00%
- Reading proficiency
- 50% ▼ -4.00%
- Median HH income
- $49,518
- Composite
- 41.49/100
- National rank
- #3458
- State rank
- #42 of 73 in FL
Livability — Estero
- Score
- 79/100
- State rank
- #149
- US rank
- #2242
Category grades
Schools grade is shown separately in the Schools card above.
Census & demographics
- County
- Lee County · 788,662 people
- City population
- 31,926
- Metro
- Cape Coral-Fort Myers, FL
- Population (ZIP)
- 31,926
- Household income
- $102,624
- Rent vs Own
- Severe rent burden
- 606.0
Population outlook (Lee County) Hauer SSP2
- Today (2025)
- 871,946 people
- By 2030
- 955,468 · +9.6%
- By 2040
- 1,113,587 · +27.7%
- By 2050
- 1,256,891 · +44.1%
- By 2075
- 1,560,270 · +78.9%
- By 2100
- 1,726,848 · +98.0%
Race, ethnicity, and origin ACS 2023
- Neighborhood character
- Predominantly White (85%)
- Race & ethnicity
- White 85% Hispanic / Latino 8% Two or more races 7% Asian 3% Black 1%
- Hispanic origin (detail)
- Mexican 2% Puerto Rican 2% Cuban 1%
- Common ancestry
- Romanian 5% Lithuanian 3% Slovak 2%
- Foreign-born
- 11% · Canada, China, Jamaica
- Languages at home
- 90% English-only · Spanish 5% Other Indo-European 1% French/Haitian/Cajun 1%
Political lean MEDSL · Lee
- 2024 margin
- Strong R (+28.4) · D 35.5% · R 63.9%
- 2008→2024 swing
- -18.0pp toward R · 2008: -10.4pp · 2024: -28.4pp
- All cycles
- 2024: R+28.4 2020: R+19.2 2016: R+20.4 2012: R+16.6 2008: R+10.4
Not yet ingested
- Civics
- —
Market trends
- HPI YoY
- ▼ -109.49%
- Current HPI
- 197.5913
- Rent YoY
- ▼ -1.42%
- Metro
- Cape Coral-Fort Myers, FL
- State GDP YoY
- ▲ 3.28%
- F500 in state
- 36
Industry mix (Fortune 500 HQ in FL)
| Industry | F500 HQs | Revenue |
|---|---|---|
| Industrial Technology | 2 | $29B |
|
||
| Insurance | 2 | $17B |
|
||
| Retail | 1 | $60B |
|
||
| Technology Distribution | 1 | $58B |
|
||
| Homebuilding | 1 | $35B |
|
||
| Technology Manufacturing | 1 | $35B |
|
||
Price history
+15018.7% since first listed2 events — show timeline
- 2026-02-20 Listed $739,000 FORTMLS
- 2020-08-21 Sold (Public Records) $4,888 Public Records
Property tax history
+28.7%/yrLatest (2025): $10,570 · -6.6% YoY. Source: county tax records.
Cash-flow waterfall
monthlySold comps — $/sqft
last 12 mo · ≤1 miLoading sold comps…