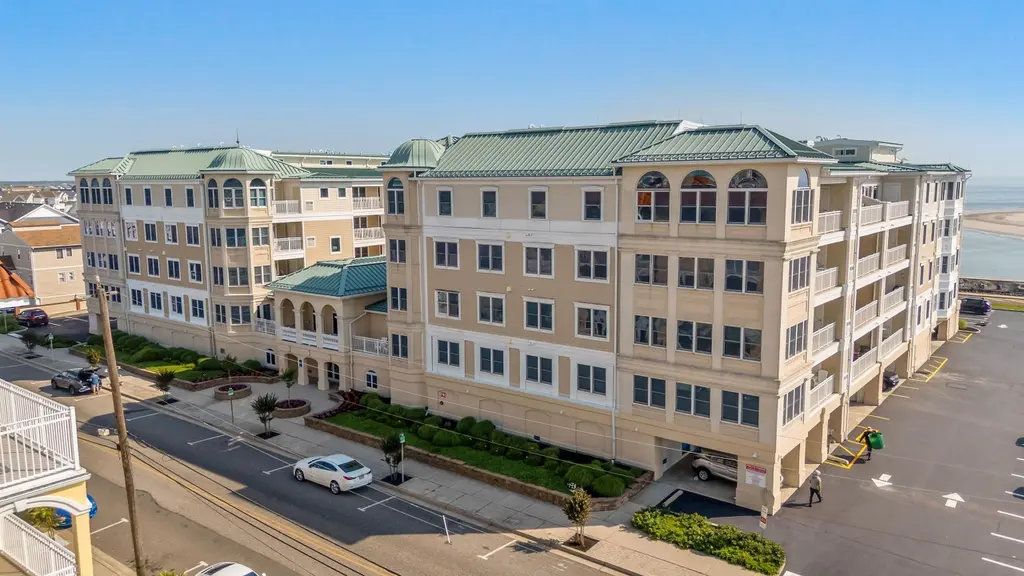
101 W Spruce Ave #303 · North Wildwood, NJ
Flood risk No data
- FEMA flood zone
- —
- Chance of flooding over 30 yrs
- —
- Est. flood insurance / yr
- —
Fire risk No data
- Est. fire insurance / yr
- —
Heat risk No data
- Hot days now (above threshold)
- —
- Hot days in 30 yrs
- —
Wind risk No data
- Chance of severe wind over 30 yrs
- —
Air-quality risk No data
- Unhealthy air days now
- —
- Unhealthy air days in 30 yrs
- —
Risk factors via First Street. Map © Google.
Why this score? — see what drove the D+ grade
The composite is a weighted blend of 9 inputs, each scored 0–100. Each bar is that input's sub-score; the figure is the points it added to the 100-point composite (weight × sub-score).
- Cash flow +18.3/30.0
- ARV discount +7.5/15.0
- DSCR +5.8/10.0
- 1% rule +5.3/10.0
- Schools +4.4/10.0
- Livability +3.4/5.0
- Rent growth +2.5/5.0
- Condition / age +2.5/5.0
- Appreciation +0.0/10.0
$959,900
🖨 Deal sheet 📄 Offer letter ✓ Due diligence
Listing remarks
Welcome to The Pointe at Moore’s Inlet. This third-floor residence offers elevated views of the ocean and North Wildwood’s entertainment district, placing you right in the center of the area’s most popular events and festivities throughout the year. This three-bedroom, two-bath condo delivers a strong combination of location, comfort, and lifestyle in one of North Wildwood’s premier oceanfront communities. The open concept living area leads to a private balcony where you can take in ocean views and the energy of the surrounding district. The kitchen is equipped with granite countertops, stainless steel appliances, and ample cabinet space. Recently upgraded furniture
Key facts
- Hardwood flooring
- Private balcony
- Tile flooring
Tags
Property features AI
Finance
- HOA & community: Condo fee of $900; Community amenities include elevator, pool and cable TV
Exterior
- Parking: Assigned garage parking for 1 car
- Utilities: City water; City sewer; Electric hot water
- Home design: Condominium unit; First-floor entry (unit 303); Year-round usage
- Exterior features: Deck/porch; Outside shower; Water view; Located near the beach (1 block)
Interior
- Kitchen: Range; Self-cleaning oven; Microwave; Refrigerator; Dishwasher
- Bedrooms: 3 bedrooms (one master bedroom on the first floor)
- Flooring: Hardwood floors
- Bathrooms: 2 full bathrooms
- Heating & cooling: Natural gas heating; Central air conditioning
- Interior features: Living room; Dining area; Laundry/utility room; Shades, blinds and rugs included; Furniture included
- Laundry & utility: Washer and dryer; Laundry/utility room
Neighborhood map
What this means for you Summary
Snapshot
- This is a 3-bed/2.0-bath condo listed at $960k.
Deal economics
- At list price, monthly cash flow is $887 ($11k/yr) — positive.
- The deal already cash-flows at list — no discount required.
- Meets the 1% rule at list price ($10k rent vs $960k).
- Recommended offer: $902k (6.0% below list) — sets the bar for market timing.
- Cap rate 7.4% vs local median 3.6% in North Wildwood — top-decile yield for the area; either an underpriced asset or a hidden risk that comps aren't pricing in. Stress-test before assuming the spread holds.
Location & tenants
- Location reads 68/100 on livability (#318 in NJ) — a middle-class / working-renter tenant base. Strengths: health & safety A+; Watch: amenities C-, crime D-, commute F.
- North Wildwood School District (suburban): math 55% / reading 45% proficiency, ranked #396 of 612 in NJ (top 65%) — acceptable for families but not a draw, mixed tenant base, ~2y average lease.
- Market conditions: 431 active listings in the ZIP; 1 comparable units currently listed for rent nearby; 877 units permitted in Cape May County in 2024 (35 in 5+ unit buildings).
Forward outlook
- Local home prices are declining (-3.0%/yr); year-one equity from $7k of loan paydown is wiped out by about $29k of value loss. Plan a longer hold.
- Cape May County population projected at -24% by 2050 — secular population decline; favor cash flow + early exit over multi-decade hold.
Negotiation context
- It's been on market 77 days — a 6% lower offer ($902k) is reasonable based on typical stale-listing flexibility.
Questions for the listing agent
- It's been on market 77 days. Have you received any prior offers? Is the seller open to a 6% concession, seller financing, or rate buy-down credit?
- What does the HOA fee cover, when was the last increase, and are there any pending special assessments or reserve-fund shortfalls?
- Any open or pending special assessments — roof, HVAC, plumbing, elevator, façade? What's the per-unit balance and payoff schedule, and is the seller paying it off at close or rolling it to the buyer?
- Why hasn't it sold? Are there any deal-killer items the seller is aware of (foundation, flood, title, zoning, code violations)?
- Is there a deadline driving the sale (1031 exchange, divorce, estate, relocation)? That informs how much negotiation room exists.
- Crime grade is D in this area — have there been break-ins, vandalism, or insurance claims at this property in the last 3 years? What carrier currently insures it and at what premium?
- The area grade is low — what's the realistic commute time and amenity access for the typical tenant pool here? Any planned neighborhood developments (good or bad) we should know about?
- What's the average days-on-market for RENTAL listings here right now (not sales)? A rising rental-DOM trend means longer vacancies and softer asking-rent achievability than the comps imply.
- What's the recent tenant-quality profile in this submarket — average credit score on applications, eviction rate, late-payment / NSF rate, and stable-employment percentage? A property-management company in the area should have these aggregated.
- How much new apartment / multifamily construction is in the pipeline within 1–3 miles? Heavy new supply (>2% of stock underway) typically softens rents 12–24 months out; light construction supports rent growth.
Investment metrics
- 1% rule
- 1.03% ✓
- Cap rate
- 7.40%
- Cash-on-cash
- 3.96%
- DSCR
- 1.18
- GRM
- 8.1
CMA / ARV
No comps found within radius.
Projected returns pro-forma
-3.0% appreciation · 3.0% rent growth · sell at horizon
- IRR
- -10.1%
- Equity multiple
- 0.63×
- Total profit
- $-98,715
- Equity at exit
- $143,124
- IRR
- -0.6%
- Equity multiple
- 0.96×
- Total profit
- $-11,856
- Equity at exit
- $82,995
Cash invested: $268,772 (down + closing). Projections, not guarantees.
Landlord ↔ Tenant lean methodology
- Overall (STATE)
- 21 Tenant-Leaning
- State New Jersey
- 21 Tenant-Leaning · D+6
- County
- — inherits STATE
- City
- — inherits STATE
ZIP-level market 08260
- Home prices YoY
- -30.7%
- Active inventory
- 431
- Price-to-rent
- 8.1×
Monthly cashflow live
- Estimated rent
- $9,900 medium interval (Pro) →
- Mortgage (P&I)
- −$5,034
- Tax from tax record
- −$600 /mo · $7,202/yr
- Insurance
- −$400
- HOA est. from 1 same-building comp
- −$900
- Vacancy / Maint / Mgmt
- −$2,079
- Net cashflow
- $887
Break-even live
UW: 25.0% down · 7.5% · 30yr · 1.5% tax · 5.0% vac · 8.0% maint · 8.0% mgmt
Financing live
Cash to close
- Down payment
- $239,975
- Closing costs
- $28,797
- Reserves months
- —
- Total cash needed
- —
Loan-product check · same deal, 3 products live
Conventional
25% down · 7.5% · 30yr
- Down + closing
- —
- Monthly P&I
- —
- Monthly cashflow
- —
- DSCR
- —
- Eligible?
- —
Personal DTI + credit; lowest rate.
DSCR
20% down · 8.5% · 30yr
- Down + closing
- —
- Monthly P&I
- —
- Monthly cashflow
- —
- DSCR
- —
- Eligible?
- —
No personal income docs; deal must DSCR.
Hard money
10% down · 12.0% · 12mo
- Down + closing
- —
- Monthly P&I
- —
- Monthly cashflow
- —
- DSCR
- —
- Eligible?
- —
Short-term bridge; refi at stabilization.
Rent comps 1 comps
| Address | Beds | Baths | Sqft | Rent | $/sqft | DOM | Units | Dist |
|---|---|---|---|---|---|---|---|---|
| 96 Seaspray Ct Wildwood, NJ | 3.0 | 2.5 | 1650 | $9,900 | $6.00 | 44d | 1 | 0.61mi |
HOA detail condo
- Monthly dues
- $0 · $0/yr
- Assessments
- None detected in remarks — confirm with the listing agent.
Listing history 16 events
-
2026-06-18days on market $959,900 Active 77 DOM
-
2026-06-17days on market $959,900 Active 76 DOM
-
2026-06-16days on market $959,900 Active 75 DOM
-
2026-06-15days on market $959,900 Active 74 DOM
-
2026-06-13days on market $959,900 Active 72 DOM
-
2026-06-12days on market $959,900 Active 71 DOM
-
2026-06-09days on market $959,900 Active 68 DOM
-
2026-06-08days on market $959,900 Active 67 DOM
-
2026-06-07days on market $959,900 Active 66 DOM
-
2026-06-07days on market $959,900 Active 65 DOM
-
2026-06-04days on market $959,900 Active 62 DOM
-
2026-06-02days on market $959,900 Active 61 DOM
-
2026-06-01days on market $959,900 Active 60 DOM
-
2026-05-31days on market $959,900 Active 59 DOM
-
2026-05-05price $959,900
-
2026-04-02$969,900 Active
ⓘ Source: listings_history table (triggers on properties + properties_extension) + one-shot
backfill from property_details.listing_events for pre-trigger history.
Tax reassessment forecast NJ · Partial reset (capped growth)
- Current annual tax
- $7,202 · $600/mo
- Projected year-2 tax
- $15,552 · $1,296/mo
- Expected delta
- +$8,350/yr (+$696/mo · 115.9%)
ⓘ Screening estimate from a state-policy table — verify with the county assessor before closing.
Nearby sold comps map
Loading sold comps map…
Walkable amenities ~0.75 mi
Loading nearby amenities…
Taxation est. · year 1
- Rental income
- $118,800
- − Mortgage interest
- −$53,769
- − Property taxes
- −$7,202
- − Insurance
- −$4,800
- − Repairs & maintenance
- −$9,504
- − Management
- −$9,504
- − HOA
- −$10,800
- − Depreciation
- −$27,924
- Taxable loss
- −$4,703
- Est. tax savings @ 24.0%
- +$1,129
- After-tax cash flow
- $11,773/yr
For passive investors: Depreciation is non-cash, so a rental often shows a tax loss while cash-flowing — sheltering income. Rental losses are passive: they offset passive income freely, and up to $25,000/yr can offset ordinary (W-2) income if you actively participate and your MAGI is under $100k (phasing out to $0 by $150k); unused losses carry forward. On sale, claimed depreciation is recaptured at up to 25%, and gains may owe capital-gains tax (a 1031 exchange can defer both). Figures are a year-1 estimate at your 24.0% rate — not tax advice; consult a CPA.
Schools (NCES district)
- District
- North Wildwood School District
- NCES district ID
- 3411670
- Math proficiency
- 55% ▲ 5.00%
- Reading proficiency
- 45% ▬ 0.00%
- Median HH income
- $45,310
- Composite
- 44.38/100
- National rank
- #6123
- State rank
- #396 of 612 in NJ
Livability — North Wildwood
- Score
- 68/100
- State rank
- #318
- US rank
- #9827
Category grades
Schools grade is shown separately in the Schools card above.
Census & demographics
- Census place
- North Wildwood, NJ
- Population (ZIP)
- 12,913
Population outlook (Cape May County) Hauer SSP2
- Today (2025)
- 88,234 people
- By 2030
- 84,144 · -4.6%
- By 2040
- 75,146 · -14.8%
- By 2050
- 67,389 · -23.6%
- By 2075
- 55,732 · -36.8%
- By 2100
- 44,972 · -49.0%
Race, ethnicity, and origin ACS 2023
- Neighborhood character
- Predominantly White (78%)
- Race & ethnicity
- White 78% Hispanic / Latino 14% Two or more races 7% Black 3% Native American 1%
- Hispanic origin (detail)
- Mexican 10% Puerto Rican 3%
- Common ancestry
- Romanian 7% Slovak 2% Lithuanian 1%
- Foreign-born
- 9% · Canada
- Languages at home
- 84% English-only · Spanish 12% Other Indo-European 3% French/Haitian/Cajun 1%
Political lean MEDSL · Cape May
- 2024 margin
- R (+19.2) · D 39.7% · R 58.9% · Other 1.4%
- 2008→2024 swing
- -10.6pp toward R · 2008: -8.7pp · 2024: -19.2pp
- All cycles
- 2024: R+19.2 2020: R+15.9 2016: R+19.9 2012: R+8.9 2008: R+8.7
Not yet ingested
- Civics
- —
Market trends
- HPI YoY
- ▼ -243.83%
- Current HPI
- 551.3393
- Rent YoY
- —
- Metro
- —
- State GDP YoY
- ▲ 2.05%
- F500 in state
- 34
Industry mix (Fortune 500 HQ in NJ)
| Industry | F500 HQs | Revenue |
|---|---|---|
| Consumer Goods | 3 | $31B |
|
||
| Pharmaceuticals | 2 | $153B |
|
||
| Technology | 2 | $21B |
|
||
| Insurance | 2 | $20B |
|
||
| Healthcare | 2 | $19B |
|
||
| Financial Services | 1 | $70B |
|
||
Price history
-1.0% since first listed2 events — show timeline
- 2026-05-05 Price Changed $959,900 CMCMLS
- 2026-04-02 Listed $969,900 CMCMLS
Property tax history
+0.9%/yrLatest (2025): $7,202 · +2.1% YoY. Source: county tax records.
Cash-flow waterfall
monthlySold comps — $/sqft
last 12 mo · ≤1 miLoading sold comps…