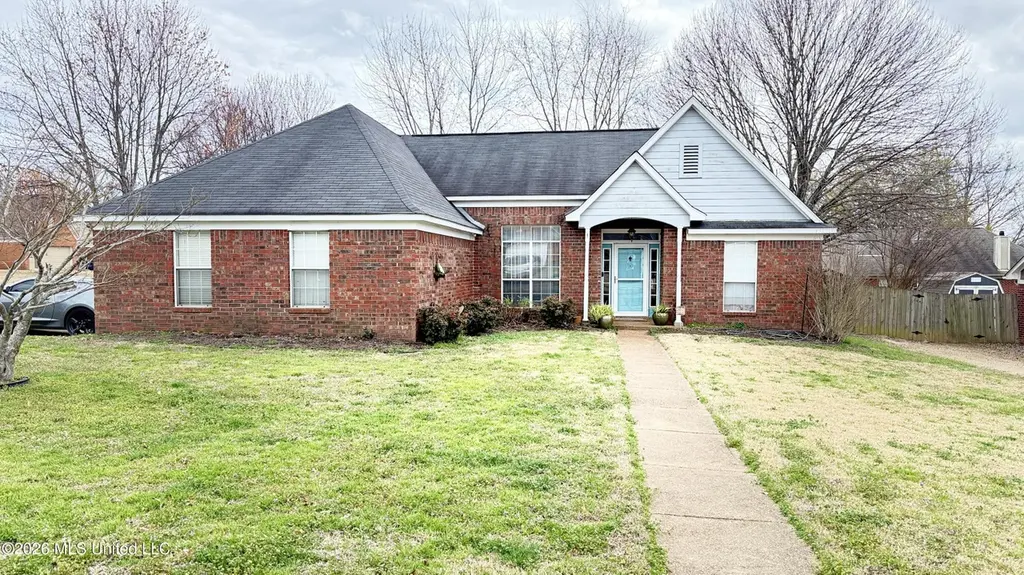
9635 N Geneva Loop · Olive Branch, MS
Flood risk 1/10 · Minimal
- FEMA flood zone
- X (unshaded)
- Chance of flooding over 30 yrs
- 0.0%
- Est. flood insurance / yr
- $507 – $1,088
Fire risk 1/10 · Minimal
- Est. fire insurance / yr
- $1,241 – $2,305
Heat risk 7/10 · Major
- Hot days now (above 109°F)
- 7 days/yr
- Hot days in 30 yrs
- 21 days/yr
Wind risk 4/10 · Minor
- Chance of severe wind over 30 yrs
- 19.0%
Air-quality risk 2/10 · Minimal
- Unhealthy air days now
- 2 days/yr
- Unhealthy air days in 30 yrs
- 2 days/yr
Risk factors via First Street. Map © Google.
Why this score? — see what drove the D grade
The composite is a weighted blend of 9 inputs, each scored 0–100. Each bar is that input's sub-score; the figure is the points it added to the 100-point composite (weight × sub-score).
- Cash flow +12.4/30.0
- ARV discount +10.5/15.0
- Schools +4.0/10.0
- DSCR +3.7/10.0
- Livability +3.6/5.0
- 1% rule +2.7/10.0
- Condition / age +2.5/5.0
- Rent growth +2.4/5.0
- Appreciation +0.0/10.0
$269,900
🖨 Deal sheet (PDF) 📄 Offer letter ✓ Due diligence
Listing remarks MLS
Charming ranch-style home located in the **Plantation Phase 2 subdivision of Olive Branch, MS**, conveniently situated just off Stateline Road between Olive Branch and Memphis--perfect for commuters. This home features a desirable **split floor plan** with two bedrooms and a full bath on one side and a private primary suite on the other. Situated on a **spacious corner lot**, the property includes a **fully fenced backyard** offering plenty of privacy and space to relax after a long day. The **roof is only 6 years old**, adding extra peace of mind for the new owner. Don't miss this great opportunity--schedule your showing with your favorite real estate professional today!
Key facts
- Split floor plan
- Spacious corner lot
- 0.3 acre lot
Tags
Neighborhood map
What this means for you Summary
Snapshot
- This is a 3-bed/2.0-bath single-family listed at $270k.
Deal economics
- At list price, monthly cash flow is $-45 ($-537/yr) — negative.
- To cash-flow at today's rent, offer at most $262k (2.9% below list).
- To meet the 1% rule (rent ≥ 1% of price), the offer needs to be $207k (23.3% below list).
- Recommended offer: $207k (23.3% below list) — sets the bar for 1% rule.
- Cap rate 6.1% vs local median 4.3% in Olive Branch — top-decile yield for the area; either an underpriced asset or a hidden risk that comps aren't pricing in. Stress-test before assuming the spread holds.
Location & tenants
- Location reads 72/100 on livability (#29 in MS) — a middle-class / working-renter tenant base. Strengths: cost of living A+, housing A+, employment A; Watch: amenities F, commute F.
- Desoto County School District (suburban): math 48% / reading 42% proficiency, ranked #20 of 130 in MS (top 15%) — families likely to look elsewhere, expect single-tenant / working-renter base with shorter leases.
- Zoned schools: Overpark Elementary (math 47% / reading 50%, grade D, #80 of 375 statewide, top 21%, 677 students, 100% FRL); Center Hill Middle (math 65% / reading 44%, grade B-, #17 of 179 statewide, top 9%, 775 students, 100% FRL); Center Hill High School (math 57% / reading 53%, grade C, #9 of 197 statewide, top 4%, 1,075 students, 100% FRL) — zoned schools average 100% FRL vs 43% district-wide (56 pts higher); higher-poverty schools than district average — tighter screening recommended.
- Market conditions: Rents soft (-0.3%/yr); 575 active listings in the ZIP; 19 comparable units currently listed for rent nearby; rentals at typical pace (median 19d on market — plan ~3-4 weeks tenant-placement turnaround); solid renter incomes; 1,155 units permitted in DeSoto County in 2024 (0 in 5+ unit buildings).
Forward outlook
- Local home prices are declining (-3.0%/yr); year-one equity from $2k of loan paydown is wiped out by about $8k of value loss. Plan a longer hold.
- DeSoto County population projected at +33% by 2050 — long-run rental-demand tailwind backs the buy-and-hold thesis.
Negotiation context
- It's been on market 105 days — a 9% lower offer ($246k) is reasonable based on typical stale-listing flexibility.
- 5 sale attempts since 22y ago; this cycle's ask has dropped $15k (5%) from the opening price — seller is motivated, your offer sets the floor, not the list.
- Current owner paid $174k; list at $270k implies a 56% gain — meaningful room to come down on a strong offer.
Risks & watch-outs
- Climate carrying-cost: extreme-heat days projected 7→21/yr by 2055 (HVAC capex compounding) — expect insurance premiums to compound above CPI over the hold.
Questions for the listing agent
- What do current leases actually rent for vs. the listed asking? Can we see a recent rent roll and the last 12 months of T-12 income?
- It's been on market 105 days. Have you received any prior offers? Is the seller open to a 23% concession, seller financing, or rate buy-down credit?
- Why hasn't it sold? Are there any deal-killer items the seller is aware of (foundation, flood, title, zoning, code violations)?
- Is there a deadline driving the sale (1031 exchange, divorce, estate, relocation)? That informs how much negotiation room exists.
- Schools are B-rated — typically a magnet for longer-tenancy family renters. What's the average tenant stay here, and is there a school-zone premium baked into asking?
- The area grade is low — what's the realistic commute time and amenity access for the typical tenant pool here? Any planned neighborhood developments (good or bad) we should know about?
- What's the average days-on-market for RENTAL listings here right now (not sales)? A rising rental-DOM trend means longer vacancies and softer asking-rent achievability than the comps imply.
- What's the recent tenant-quality profile in this submarket — average credit score on applications, eviction rate, late-payment / NSF rate, and stable-employment percentage? A property-management company in the area should have these aggregated.
- How much new for-sale + rental construction is in the pipeline within 1–3 miles? Heavy new supply typically softens prices + rents 12–24 months out; constrained supply supports both.
Investment metrics
- 1% rule
- 0.77% ✗
- Cap rate
- 6.09%
- Cash-on-cash
- -0.71%
- DSCR
- 0.97
- GRM
- 10.9
CMA / ARV
- ARV (median comp)
- $289,279
- List price
- $269,900
- Delta
- -6.70%
- Verdict
- FAIR
- Comps
- 20 within 1.0 mi
Show comp detail 12 sales within ~0.75 mi
| Address | Dist | Beds/Ba | Sqft | Sold | Price | $/sf | Match |
|---|---|---|---|---|---|---|---|
| 9444 E Geneva Loop | 0.03mi | 3/2.0 | 1,520 (-7%) | 8mo | $260,000 | $171 | 80 |
| 9209 Hickory Dr | 0.25mi | 3/2.0 | 1,781 (+9%) | 2mo | $294,900 | $166 | 72 |
| 9178 William Paul Dr | 0.42mi | 3/2.0 | 1,733 (+6%) | 6mo | $295,000 | $170 | 66 |
| 9290 Lakeside Dr | 0.64mi | 3/2.0 | 1,529 (-7%) | 1mo | $319,000 | $209 | 58 |
| 9129 Tremont Dr | 0.66mi | 3/2.0 | 1,525 (-7%) | 4mo | $255,000 | $167 | 55 |
| 9320 Lacee Ln | 0.42mi | 3/2.0 | 1,802 (+10%) | 11mo | $299,000 | $166 | 54 |
| 9899 Wynngate Dr | 0.61mi | 3/2.0 | 1,520 (-7%) | 8mo | $240,000 | $158 | 53 |
| 9908 Vista Ridge Dr | 0.54mi | 4/2.0 (+1) | 1,523 (-7%) | 11mo | $234,900 | $154 | 49 |
| 8898 Travis Dr | 0.58mi | 3/2.0 | 1,858 (+13%) | 6mo | $294,900 | $159 | 45 |
| 9097 Gavin Dr | 0.42mi | 4/2.0 (+1) | 1,883 (+15%) | 8mo | $314,900 | $167 | 44 |
| 9181 Waterpointe Cv | 0.68mi | 3/2.0 | 1,495 (-9%) | 11mo | $272,000 | $182 | 44 |
| 8816 Glen Cir | 0.58mi | 2/2.0 (-1) | 1,814 (+11%) | 11mo | $182,500 | $101 | 41 |
Match score weights: distance 35% · size 25% · config 20% · recency 20%. Top-matched comps best support the ARV.
Projected returns pro-forma
-3.0% appreciation · 0.0% rent growth · sell at horizon
- IRR
- -20.6%
- Equity multiple
- 0.30×
- Total profit
- $-52,731
- Equity at exit
- $40,243
- IRR
- -21.4%
- Equity multiple
- 0.03×
- Total profit
- $-73,357
- Equity at exit
- $23,336
Cash invested: $75,572 (down + closing). Projections, not guarantees.
Landlord ↔ Tenant lean methodology
- Overall (STATE)
- 90 Strongly Landlord-Friendly
- State Mississippi
- 90 Strongly Landlord-Friendly · R+11
- County
- — inherits STATE
- City
- — inherits STATE
ZIP-level market 38654
- Home prices YoY
- -26.1%
- Rents YoY
- -0.3%
- Active inventory
- 575
- Price-to-rent
- 10.9×
Monthly cashflow live
- Estimated rent
- $2,069 high interval (Pro) →
- Mortgage (P&I)
- −$1,415
- Tax from tax record
- −$152 /mo · $1,818/yr
- Insurance
- −$112
- HOA
- −$0
- Vacancy / Maint / Mgmt
- −$435
- Net cashflow
- $-45
Break-even live
Sensitivity live
| Price | -10% $108 | -5% $32 | +0% $-45 | +5% $-121 | +10% $-198 |
|---|---|---|---|---|---|
| Rent | -10% $-208 | -5% $-126 | +0% $-45 | +5% $37 | +10% $119 |
| Rate | -1.0pp $91 | -0.5pp $24 | base $-45 | +0.5pp $-115 | +1.0pp $-186 |
UW: 25.0% down · 7.5% · 30yr · 1.5% tax · 5.0% vac · 8.0% maint · 8.0% mgmt
Financing live
Cash to close
- Down payment
- $67,475
- Closing costs
- $8,097
- Reserves months
- —
- Total cash needed
- —
Loan-product check · same deal, 3 products live
Conventional
25% down · 7.5% · 30yr
- Down + closing
- —
- Monthly P&I
- —
- Monthly cashflow
- —
- DSCR
- —
- Eligible?
- —
Personal DTI + credit; lowest rate.
DSCR
20% down · 8.5% · 30yr
- Down + closing
- —
- Monthly P&I
- —
- Monthly cashflow
- —
- DSCR
- —
- Eligible?
- —
No personal income docs; deal must DSCR.
Hard money
10% down · 12.0% · 12mo
- Down + closing
- —
- Monthly P&I
- —
- Monthly cashflow
- —
- DSCR
- —
- Eligible?
- —
Short-term bridge; refi at stabilization.
Rent comps 19 comps
| Address | Beds | Baths | Sqft | Rent | $/sqft | DOM | Units | Dist |
|---|---|---|---|---|---|---|---|---|
| 9305 Stateline Rd Olive Branch, MS | 1.0–2.0 | 1.0–2.0 | 927 | $1,600 | $1.73 | 4d | 12 | 0.30mi |
| 9117 Billy Pat Dr Olive Branch, MS | 3.0 | 2.0 | 1727 | $1,850 | $1.07 | 45d | 1 | 0.40mi |
| 9085 Billy Pat Dr Olive Branch, MS | 4.0 | 2.0 | 1457 | $2,000 | $1.37 | 22d | 1 | 0.45mi |
| 9069 Gavin Dr Olive Branch, MS | 4.0 | 2.0 | 1889 | $2,185 | $1.16 | 4d | 1 | 0.46mi |
| 9042 Billy Pat Dr Olive Branch, MS | 3.0 | 2.0 | 1877 | $2,000 | $1.07 | 19d | 1 | 0.53mi |
| 9083 Erie Cv Olive Branch, MS | 3.0 | 2.0 | 1600 | $1,995 | $1.25 | 22d | 1 | 0.53mi |
| 9913 Vista Ridge Dr Olive Branch, MS | 3.0 | 2.0 | 1312 | $1,680 | $1.28 | 5d | 1 | 0.57mi |
| 9007 Billy Pat Dr Olive Branch, MS | 4.0 | 2.0 | 1877 | $2,035 | $1.08 | 4d | 1 | 0.58mi |
| 9112 Lakeshore Dr Olive Branch, MS | 4.0 | 2.5 | 1985 | $2,350 | $1.18 | 45d | 1 | 0.67mi |
| 9135 Tremont Dr Olive Branch, MS | 4.0 | 2.0 | 1774 | $2,220 | $1.25 | 25d | 1 | 0.67mi |
| 9908 Tremont Dr Olive Branch, MS | 3.0 | 2.0 | 1507 | $1,770 | $1.17 | 19d | 1 | 0.68mi |
| 9025 Creekside Dr Olive Branch, MS | 3.0 | 2.5 | 1800 | $1,995 | $1.11 | 6d | 1 | 0.77mi |
| 8255 Cross Point Dr Olive Branch, MS | 3.0 | 2.0 | 1380 | $1,725 | $1.25 | 5d | 1 | 0.97mi |
| 8243 Cross Point Dr Olive Branch, MS | 3.0 | 2.0 | 1398 | $1,720 | $1.23 | 4d | 1 | 0.98mi |
| 8260 Clubview Dr Olive Branch, MS | 3.0 | 2.0 | 1588 | $1,875 | $1.18 | 21d | 1 | 1.00mi |
| 8564 Courtly Cir N Olive Branch, MS | 4.0 | 3.0 | 2207 | $2,140 | $0.97 | 45d | 1 | 1.17mi |
| 7843 Plantation Ridge Cv Olive Branch, MS | 3.0 | 2.0 | 1750 | $1,935 | $1.11 | 19d | 1 | 1.29mi |
| 7831 Plantation Ridge Cv Olive Branch, MS | 3.0 | 2.0 | 1543 | $1,980 | $1.28 | 6d | 1 | 1.31mi |
| 7838 Alexanders Crossing Dr Olive Branch, MS | 4.0 | 3.0 | 2159 | $2,220 | $1.03 | 4d | 1 | 1.34mi |
Listing history 30 events
-
2026-06-21days on market $269,900 Active 105 DOM
-
2026-06-18days on market $269,900 Active 102 DOM
-
2026-06-17days on market $269,900 Active 101 DOM
-
2026-06-16days on market $269,900 Active 100 DOM
-
2026-06-15days on market $269,900 Active 99 DOM
-
2026-06-13days on market $269,900 Active 97 DOM
-
2026-06-10days on market $269,900 Active 94 DOM
-
2026-06-09days on market $269,900 Active 93 DOM
-
2026-06-08days on market $269,900 Active 92 DOM
-
2026-06-07days on market $269,900 Active 91 DOM
-
2026-06-03days on market $269,900 Active 87 DOM
-
2026-06-02days on market $269,900 Active 86 DOM
-
2026-06-01days on market $269,900 Active 85 DOM
-
2026-05-31days on market $269,900 Active 84 DOM
-
2026-03-23price $269,900 680-char remark
Show marketing remark (680 chars)
Charming ranch-style home located in the **Plantation Phase 2 subdivision of Olive Branch, MS**, conveniently situated just off Stateline Road between Olive Branch and Memphis--perfect for commuters. This home features a desirable **split floor plan** with two bedrooms and a full bath on one side and a private primary suite on the other. Situated on a **spacious corner lot**, the property includes a **fully fenced backyard** offering plenty of privacy and space to relax after a long day. The **roof is only 6 years old**, adding extra peace of mind for the new owner. Don't miss this great opportunity--schedule your showing with your favorite real estate professional today!
-
2026-03-08$285,000 Active 680-char remark
Show marketing remark (680 chars)
Charming ranch-style home located in the **Plantation Phase 2 subdivision of Olive Branch, MS**, conveniently situated just off Stateline Road between Olive Branch and Memphis--perfect for commuters. This home features a desirable **split floor plan** with two bedrooms and a full bath on one side and a private primary suite on the other. Situated on a **spacious corner lot**, the property includes a **fully fenced backyard** offering plenty of privacy and space to relax after a long day. The **roof is only 6 years old**, adding extra peace of mind for the new owner. Don't miss this great opportunity--schedule your showing with your favorite real estate professional today!
-
2020-04-17soldstatus
-
2020-04-10soldstatus 417-char remark
Show marketing remark (417 chars)
Well maintained 3BR/2BA split floorplan home on large corner lot in highly sought after Plantation Lakes Subdivision. Great Room w/vaulted ceilings & corner FP that opens to formal Dining Room; eat-in Kitchen; coffered ceilings in MBR w/large salon bath; hardwood flooring (no carpet). Out back you will find a patio, storage shed & completely fenced backyard. This home has great curb appeal! Don't miss out.
-
2020-04-10soldstatus $173,500 Closed
Show marketing remark (417 chars)
Well maintained 3BR/2BA split floorplan home on large corner lot in highly sought after Plantation Lakes Subdivision. Great Room w/vaulted ceilings & corner FP that opens to formal Dining Room; eat-in Kitchen; coffered ceilings in MBR w/large salon bath; hardwood flooring (no carpet). Out back you will find a patio, storage shed & completely fenced backyard. This home has great curb appeal! Don't miss out.
-
2020-03-07status Pending
-
2020-03-07price $176,000
-
2020-03-02$176,000 417-char remark
Show marketing remark (417 chars)
Well maintained 3BR/2BA split floorplan home on large corner lot in highly sought after Plantation Lakes Subdivision. Great Room w/vaulted ceilings & corner FP that opens to formal Dining Room; eat-in Kitchen; coffered ceilings in MBR w/large salon bath; hardwood flooring (no carpet). Out back you will find a patio, storage shed & completely fenced backyard. This home has great curb appeal! Don't miss out.
-
2020-03-02$172,500 Active
Show marketing remark (417 chars)
Well maintained 3BR/2BA split floorplan home on large corner lot in highly sought after Plantation Lakes Subdivision. Great Room w/vaulted ceilings & corner FP that opens to formal Dining Room; eat-in Kitchen; coffered ceilings in MBR w/large salon bath; hardwood flooring (no carpet). Out back you will find a patio, storage shed & completely fenced backyard. This home has great curb appeal! Don't miss out.
-
2017-08-21soldstatus
-
2017-08-10soldstatus
-
2017-06-29$159,900
-
2004-09-13soldstatus
-
2004-08-13soldstatus
-
2004-08-02soldstatus
-
2004-02-18$137,900
ⓘ Source: listings_history table (triggers on properties + properties_extension) + one-shot
backfill from property_details.listing_events for pre-trigger history.
Tax reassessment forecast MS · Resets to sale price
- Current annual tax
- $1,818 · $152/mo
- Projected year-2 tax
- $2,132 · $178/mo
- Expected delta
- +$314/yr (+$26/mo · 17.3%)
ⓘ Screening estimate from a state-policy table — verify with the county assessor before closing.
Climate risk First Street
- Flood 1/10 Low FEMA zone X (unshaded) · 0% chance over 30 yrs
- Wildfire 1/10 Low
- Heat 7/10 Severe 7 d/yr ≥109°F today · 21 d/yr by 30 yrs out
- Wind 4/10 Moderate 19% chance of damaging wind over 30 yrs
- Air quality 2/10 Low 2 unhealthy d/yr today · 2 by 30 yrs out
Nearby sold comps map
Loading sold comps map…
Walkable amenities ~0.75 mi
Loading nearby amenities…
Taxation est. · year 1
- Rental income
- $24,830
- − Mortgage interest
- −$15,119
- − Property taxes
- −$1,818
- − Insurance
- −$1,350
- − Repairs & maintenance
- −$1,986
- − Management
- −$1,986
- − Depreciation
- −$7,852
- Taxable loss
- −$5,281
- Est. tax savings @ 24.0%
- +$1,267
- After-tax cash flow
- $731/yr
For passive investors: Depreciation is non-cash, so a rental often shows a tax loss while cash-flowing — sheltering income. Rental losses are passive: they offset passive income freely, and up to $25,000/yr can offset ordinary (W-2) income if you actively participate and your MAGI is under $100k (phasing out to $0 by $150k); unused losses carry forward. On sale, claimed depreciation is recaptured at up to 25%, and gains may owe capital-gains tax (a 1031 exchange can defer both). Figures are a year-1 estimate at your 24.0% rate — not tax advice; consult a CPA.
Schools (NCES district)
- District
- Desoto County School District
- NCES district ID
- 2801320
- Math proficiency
- 48% ▼ -13.00%
- Reading proficiency
- 42% ▼ -6.00%
- Median HH income
- $59,272
- Composite
- 39.56/100
- National rank
- #3933
- State rank
- #20 of 130 in MS
Livability — Olive Branch
- Score
- 72/100
- State rank
- #29
- US rank
- #6509
Category grades
Schools grade is shown separately in the Schools card above.
Census & demographics
- Census place
- Olive Branch, MS
- County
- DeSoto County · 176,513 people
- City population
- 57,898
- Metro
- Memphis, TN-MS-AR
- Population (ZIP)
- 57,898
- Household income
- $103,092
- Rent vs Own
- Severe rent burden
- 801.0
Population outlook (DeSoto County) Hauer SSP2
- Today (2025)
- 203,338 people
- By 2030
- 217,692 · +7.1%
- By 2040
- 245,320 · +20.6%
- By 2050
- 270,133 · +32.8%
- By 2075
- 323,341 · +59.0%
- By 2100
- 348,742 · +71.5%
Race, ethnicity, and origin ACS 2023
- Neighborhood character
- Diverse neighborhood (Simpson 0.57)
- Race & ethnicity
- White 57% Black 32% Hispanic / Latino 5% Two or more races 5% Asian 2%
- Hispanic origin (detail)
- Mexican 4%
- Common ancestry
- Slovak 2% Lithuanian 1% Romanian 1%
- Foreign-born
- 4% · Canada, Vietnam, China
- Languages at home
- 93% English-only · Spanish 4% Vietnamese 1% Arabic 1%
Political lean MEDSL · DeSoto
- 2024 margin
- Strong R (+24.1) · D 36.7% · R 60.8% · Other 2.5%
- 2008→2024 swing
- +14.2pp toward D · 2008: -38.2pp · 2024: -24.1pp
- All cycles
- 2024: R+24.1 2020: R+23.9 2016: R+34.8 2012: R+33.5 2008: R+38.2
Not yet ingested
- Civics
- —
Market trends
- HPI YoY
- ▼ -66.27%
- Current HPI
- 187.2114
- Rent YoY
- ▼ -0.34%
- Metro
- Memphis, TN-MS-AR
- State GDP YoY
- —
- F500 in state
- 0
Price history
+95.7% since first listed16 events — show timeline
- 2026-03-23 Price Changed $269,900 MLSU
- 2026-03-08 Listed $285,000 MLSU
- 2020-04-17 Sold (Public Records) — Public Records
- 2020-04-10 Sold (MLS) $173,500 Memphis Area Association of Realtors(R) MLS
- 2020-04-10 Sold (MLS) — MLSU
- 2020-03-07 Pending — Memphis Area Association of Realtors(R) MLS
- 2020-03-07 Price Changed $176,000 Memphis Area Association of Realtors(R) MLS
- 2020-03-02 Listed $172,500 Memphis Area Association of Realtors(R) MLS
- 2020-03-02 Listed $176,000 MLSU
- 2017-08-21 Sold (Public Records) — Public Records
- 2017-08-10 Sold (MLS) — MLSU
- 2017-06-29 Listed $159,900 MLSU
- 2004-09-13 Sold (Public Records) — Public Records
- 2004-08-13 Sold (Public Records) — Public Records
- 2004-08-02 Sold (MLS) — MLSU
- 2004-02-18 Listed $137,900 MLSU
Property tax history
+3.7%/yrLatest (2025): $1,818 · +14.2% YoY. Source: county tax records.
Cash-flow waterfall
monthlySold comps — $/sqft
last 12 mo · ≤1 miLoading sold comps…