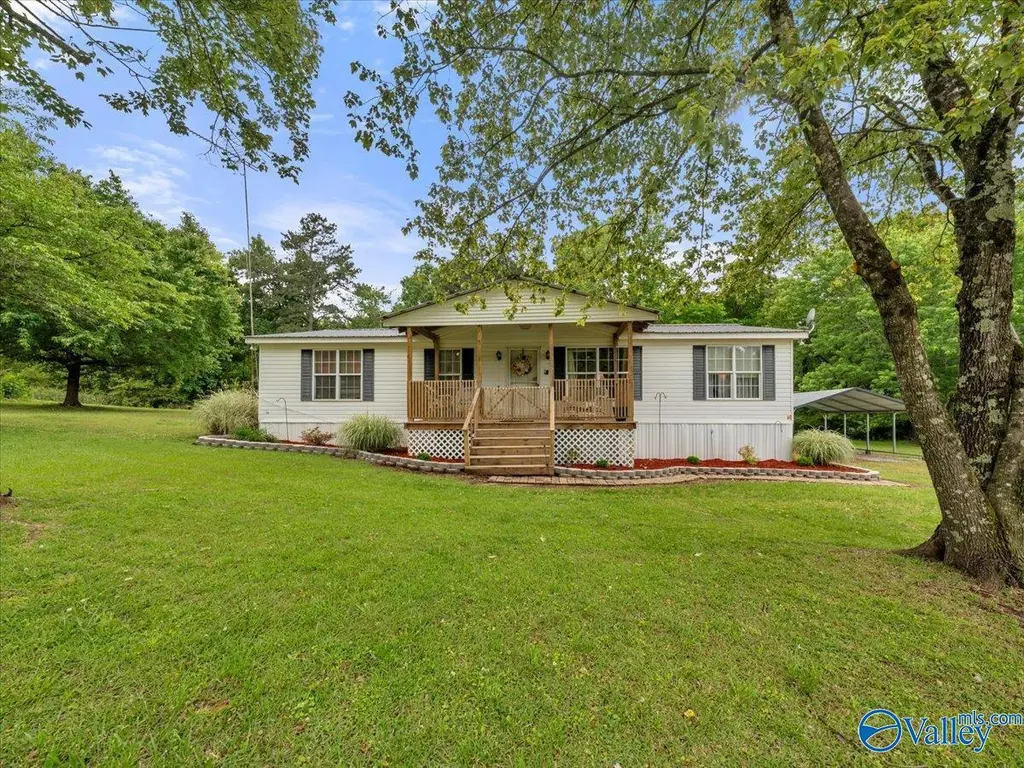
336 County Road 1931 · Crossville, AL
Flood risk 1/10 · Minimal
- FEMA flood zone
- X (unshaded)
- Chance of flooding over 30 yrs
- 0.0%
- Est. flood insurance / yr
- $507 – $1,088
Fire risk 5/10 · Moderate
- Est. fire insurance / yr
- $916 – $1,700
Heat risk 5/10 · Moderate
- Hot days now (above 103°F)
- 7 days/yr
- Hot days in 30 yrs
- 19 days/yr
Wind risk 4/10 · Minor
- Chance of severe wind over 30 yrs
- 20.0%
Air-quality risk 2/10 · Minimal
- Unhealthy air days now
- 1 days/yr
- Unhealthy air days in 30 yrs
- 1 days/yr
Risk factors via First Street. Map © Google.
Why this score? — see what drove the D grade
The composite is a weighted blend of 9 inputs, each scored 0–100. Each bar is that input's sub-score; the figure is the points it added to the 100-point composite (weight × sub-score).
- ARV discount +15.0/15.0
- Appreciation +6.8/10.0
- Cash flow +6.6/30.0
- Livability +3.2/5.0
- Rent growth +2.5/5.0
- Condition / age +2.5/5.0
- Schools +2.3/10.0
- 1% rule +1.7/10.0
- DSCR +0.9/10.0
$165,500
🖨 Deal sheet (PDF) 📄 Offer letter ✓ Due diligence
Listing remarks
Three bedroom, two bath mobile home in Crossville, Alabama featuring a nice yard and above-ground pool. Spacious floor plan with comfortable living area, functional kitchen. Large outdoor space perfect for relaxing or entertaining. Convenient location with small-town charm and easy access to nearby amenities.
Key facts
- Functional kitchen
- Spacious floor plan
- Large outdoor space
Tags
Property features AI
Finance
- Other: Property sits on about 1.01 acres
- HOA & community: No homeowners association
Exterior
- Parking: Detached carport
- Utilities: Septic tank
- Home design: Manufactured / mobile home (Residential); Built in 1999; Single-story
- Construction: Electric fireplace (feature listed); Crawl space foundation
- Exterior features: Private pool; Public water
Interior
- Bathrooms: 2 full bathrooms
- Heating & cooling: Central heating; Central cooling
- Interior features: Electric fireplace; Crawl space basement
Neighborhood map
What this means for you Summary
Snapshot
- This is a 3-bed/2.0-bath manufactured listed at $166k.
Deal economics
- At list price, monthly cash flow is $-269 ($-3k/yr) — negative.
- To cash-flow at today's rent, offer at most $127k (23.5% below list).
- To meet the 1% rule (rent ≥ 1% of price), the offer needs to be $111k (33.1% below list).
- Recommended offer: $111k (33.1% below list) — sets the bar for 1% rule.
- Cap rate 4.3% vs local median 2.8% in Crossville — top-decile yield for the area; either an underpriced asset or a hidden risk that comps aren't pricing in. Stress-test before assuming the spread holds.
Location & tenants
- Location reads 64/100 on livability (#171 in AL) — a middle-class / working-renter tenant base. Strengths: crime A+, cost of living A+, housing A+; Watch: employment D+, amenities F, commute F.
- Dekalb County (rural): math 18% / reading 37% proficiency, ranked #82 of 129 in AL (top 64%) — low school quality limits family demand, transient renter base, plan for 1-2y turnover.
- Zoned schools: Crossville Elementary School (math 17% / reading 27%, grade F, #442 of 627 statewide, top 72%, 578 students, 94% FRL); Crossville Middle School (math 8% / reading 20%, grade F, #209 of 257 statewide, top 82%, 790 students, 82% FRL); Crossville High School (math 8% / reading 17%, grade F, #238 of 305 statewide, top 79%, 657 students, 77% FRL) — zoned schools average 84% FRL vs 59% district-wide (26 pts higher); higher-poverty schools than district average — tighter screening recommended.
- Market conditions: 34 active listings in the ZIP; 49 units permitted in DeKalb County in 2024 (0 in 5+ unit buildings).
Forward outlook
- In year one you build about $7k of equity ($1k loan paydown + $6k appreciation (3.6% local appreciation)).
- DeKalb County population projected to shrink 8% by 2050 — rents likely to lag national; underwrite the cash flow, not the appreciation.
- By year 5, paydown + projected appreciation supports a ~$31k cash-out refi (75% LTV) — recoverable capital for the next deal without selling this one.
Negotiation context
- It's been on market 42 days — a 3% lower offer ($161k) is reasonable based on typical stale-listing flexibility.
Risks & watch-outs
- Climate carrying-cost: moderate wildfire risk; extreme-heat days projected 7→19/yr by 2055 (HVAC capex compounding) — expect insurance premiums to compound above CPI over the hold.
Questions for the listing agent
- What do current leases actually rent for vs. the listed asking? Can we see a recent rent roll and the last 12 months of T-12 income?
- It's been on market 42 days. Have you received any prior offers? Is the seller open to a 33% concession, seller financing, or rate buy-down credit?
- Is there a deadline driving the sale (1031 exchange, divorce, estate, relocation)? That informs how much negotiation room exists.
- Schools are F-rated, which usually means shorter tenancies and higher turnover. Who's the typical renter profile here, and what's been the actual vacancy rate?
- The area grade is low — what's the realistic commute time and amenity access for the typical tenant pool here? Any planned neighborhood developments (good or bad) we should know about?
- What's the average days-on-market for RENTAL listings here right now (not sales)? A rising rental-DOM trend means longer vacancies and softer asking-rent achievability than the comps imply.
- What's the recent tenant-quality profile in this submarket — average credit score on applications, eviction rate, late-payment / NSF rate, and stable-employment percentage? A property-management company in the area should have these aggregated.
- How much new for-sale + rental construction is in the pipeline within 1–3 miles? Heavy new supply typically softens prices + rents 12–24 months out; constrained supply supports both.
Investment metrics
- 1% rule
- 0.67% ✗
- Cap rate
- 4.34%
- Cash-on-cash
- -6.97%
- DSCR
- 0.69
- GRM
- 12.5
CMA / ARV
- ARV (median comp)
- $279,258
- List price
- $165,500
- Delta
- -40.74%
- Verdict
- UNDERPRICED
- Comps
- 3 within 1.0 mi
Show comp detail 1 sale within ~0.75 mi
| Address | Dist | Beds/Ba | Sqft | Sold | Price | $/sf | Match |
|---|---|---|---|---|---|---|---|
| 286 County Road 1930 | 0.14mi | 3/2.0 | 1,568 (0%) | 6mo | $125,000 | $80 | 88 |
Match score weights: distance 35% · size 25% · config 20% · recency 20%. Top-matched comps best support the ARV.
Projected returns pro-forma
3.64% appreciation · 3.0% rent growth · sell at horizon
- IRR
- 3.1%
- Equity multiple
- 1.18×
- Total profit
- $8,513
- Equity at exit
- $80,474
- IRR
- 6.3%
- Equity multiple
- 2.03×
- Total profit
- $47,507
- Equity at exit
- $128,952
Cash invested: $46,340 (down + closing). Projections, not guarantees.
Landlord ↔ Tenant lean methodology
- Overall (STATE)
- 90 Strongly Landlord-Friendly
- State Alabama
- 90 Strongly Landlord-Friendly · R+15
- County
- — inherits STATE
- City
- — inherits STATE
ZIP-level market 35962
- Home prices YoY
- 1.4%
- Active inventory
- 34
- Price-to-rent
- 12.5×
Monthly cashflow live
- Estimated rent
- $1,107 medium interval (Pro) →
- Mortgage (P&I)
- −$868
- Tax est. 1.5%
- −$207 /mo · $2,482/yr
- Insurance
- −$69
- HOA
- −$0
- Vacancy / Maint / Mgmt
- −$233
- Net cashflow
- $-269
Break-even live
Sensitivity live
| Price | -10% $-155 | -5% $-212 | +0% $-269 | +5% $-326 | +10% $-383 |
|---|---|---|---|---|---|
| Rent | -10% $-357 | -5% $-313 | +0% $-269 | +5% $-225 | +10% $-182 |
| Rate | -1.0pp $-186 | -0.5pp $-227 | base $-269 | +0.5pp $-312 | +1.0pp $-356 |
UW: 25.0% down · 7.5% · 30yr · 1.5% tax · 5.0% vac · 8.0% maint · 8.0% mgmt
Financing live
Cash to close
- Down payment
- $41,375
- Closing costs
- $4,965
- Reserves months
- —
- Total cash needed
- —
Loan-product check · same deal, 3 products live
Conventional
25% down · 7.5% · 30yr
- Down + closing
- —
- Monthly P&I
- —
- Monthly cashflow
- —
- DSCR
- —
- Eligible?
- —
Personal DTI + credit; lowest rate.
DSCR
20% down · 8.5% · 30yr
- Down + closing
- —
- Monthly P&I
- —
- Monthly cashflow
- —
- DSCR
- —
- Eligible?
- —
No personal income docs; deal must DSCR.
Hard money
10% down · 12.0% · 12mo
- Down + closing
- —
- Monthly P&I
- —
- Monthly cashflow
- —
- DSCR
- —
- Eligible?
- —
Short-term bridge; refi at stabilization.
Listing history 18 events
-
2026-06-21days on market $165,500 Active 42 DOM
-
2026-06-19days on market $165,500 Active 40 DOM
-
2026-06-18days on market $165,500 Active 39 DOM
-
2026-06-17days on market $165,500 Active 38 DOM
-
2026-06-16days on market $165,500 Active 37 DOM
-
2026-06-15days on market $165,500 Active 36 DOM
-
2026-06-14pricedays on market $165,500 Active 34 DOM
-
2026-06-12days on market $175,500 Active 33 DOM
-
2026-06-09days on market $175,500 Active 30 DOM
-
2026-06-08days on market $175,500 Active 29 DOM
-
2026-06-07days on market $175,500 Active 28 DOM
-
2026-06-07days on market $175,500 Active 27 DOM
-
2026-06-04days on market $175,500 Active 24 DOM
-
2026-06-02days on market $175,500 Active 23 DOM
-
2026-06-01days on market $175,500 Active 22 DOM
-
2026-05-31days on market $175,500 Active 21 DOM
-
2026-05-31days on market $175,500 Active 20 DOM
-
2026-05-10$175,500 Active 310-char remark
ⓘ Source: listings_history table (triggers on properties + properties_extension) + one-shot
backfill from property_details.listing_events for pre-trigger history.
Climate risk First Street
- Flood 1/10 Low FEMA zone X (unshaded) · 0% chance over 30 yrs
- Wildfire 5/10 Major
- Heat 5/10 Major 7 d/yr ≥103°F today · 19 d/yr by 30 yrs out
- Wind 4/10 Moderate 20% chance of damaging wind over 30 yrs
- Air quality 2/10 Low 1 unhealthy d/yr today · 1 by 30 yrs out
Nearby sold comps map
Loading sold comps map…
Walkable amenities ~0.75 mi
Loading nearby amenities…
Taxation est. · year 1
- Rental income
- $13,286
- − Mortgage interest
- −$9,271
- − Property taxes
- −$2,482
- − Insurance
- −$828
- − Repairs & maintenance
- −$1,063
- − Management
- −$1,063
- − Depreciation
- −$4,815
- Taxable loss
- −$6,235
- Est. tax savings @ 24.0%
- +$1,496
- After-tax cash flow
- $-1,732/yr
For passive investors: Depreciation is non-cash, so a rental often shows a tax loss while cash-flowing — sheltering income. Rental losses are passive: they offset passive income freely, and up to $25,000/yr can offset ordinary (W-2) income if you actively participate and your MAGI is under $100k (phasing out to $0 by $150k); unused losses carry forward. On sale, claimed depreciation is recaptured at up to 25%, and gains may owe capital-gains tax (a 1031 exchange can defer both). Figures are a year-1 estimate at your 24.0% rate — not tax advice; consult a CPA.
Schools (NCES district)
- District
- Dekalb County
- NCES district ID
- 0101140
- Math proficiency
- 18% ▼ -19.00%
- Reading proficiency
- 37% ▲ 2.00%
- Median HH income
- $36,655
- Composite
- 22.78/100
- National rank
- #8023
- State rank
- #82 of 129 in AL
Livability — Crossville
- Score
- 64/100
- State rank
- #171
- US rank
- #14863
Category grades
Schools grade is shown separately in the Schools card above.
Census & demographics
- Population (ZIP)
- 8,211
Population outlook (DeKalb County) Hauer SSP2
- Today (2025)
- 71,722 people
- By 2030
- 71,373 · -0.5%
- By 2040
- 69,536 · -3.0%
- By 2050
- 66,020 · -8.0%
- By 2075
- 53,325 · -25.7%
- By 2100
- 36,127 · -49.6%
Race, ethnicity, and origin ACS 2023
- Neighborhood character
- Predominantly White (77%)
- Race & ethnicity
- White 77% Hispanic / Latino 19% Two or more races 6% Native American 3%
- Hispanic origin (detail)
- Mexican 13% Cuban 1%
- Common ancestry
- Lithuanian 3% Scottish 2% Romanian 1%
- Foreign-born
- 11% · Canada
- Languages at home
- 82% English-only · Spanish 17%
Political lean MEDSL · DeKalb
- 2024 margin
- Solid R (+74.0) · D 12.7% · R 86.7%
- 2008→2024 swing
- -22.7pp toward R · 2008: -51.2pp · 2024: -74.0pp
- All cycles
- 2024: R+74.0 2020: R+69.8 2016: R+69.4 2012: R+54.9 2008: R+51.2
Not yet ingested
- Civics
- —
Market trends
- HPI YoY
- ▲ 3.64%
- Current HPI
- 257.6999
- Rent YoY
- —
- Metro
- —
- State GDP YoY
- ▲ 2.94%
- F500 in state
- 4
Industry mix (Fortune 500 HQ in AL)
| Industry | F500 HQs | Revenue |
|---|---|---|
| Financial Services | 1 | $8B |
|
||
| Healthcare | 1 | $5B |
|
||
Price history
-5.7% since first listed2 events — show timeline
- 2026-06-13 Price Changed $165,500 VMLS
- 2026-05-10 Listed $175,500 VMLS
Property tax history
+8.3%/yrLatest (2018): $106 · +57.9% YoY. Source: county tax records.
Cash-flow waterfall
monthlySold comps — $/sqft
last 12 mo · ≤1 miLoading sold comps…