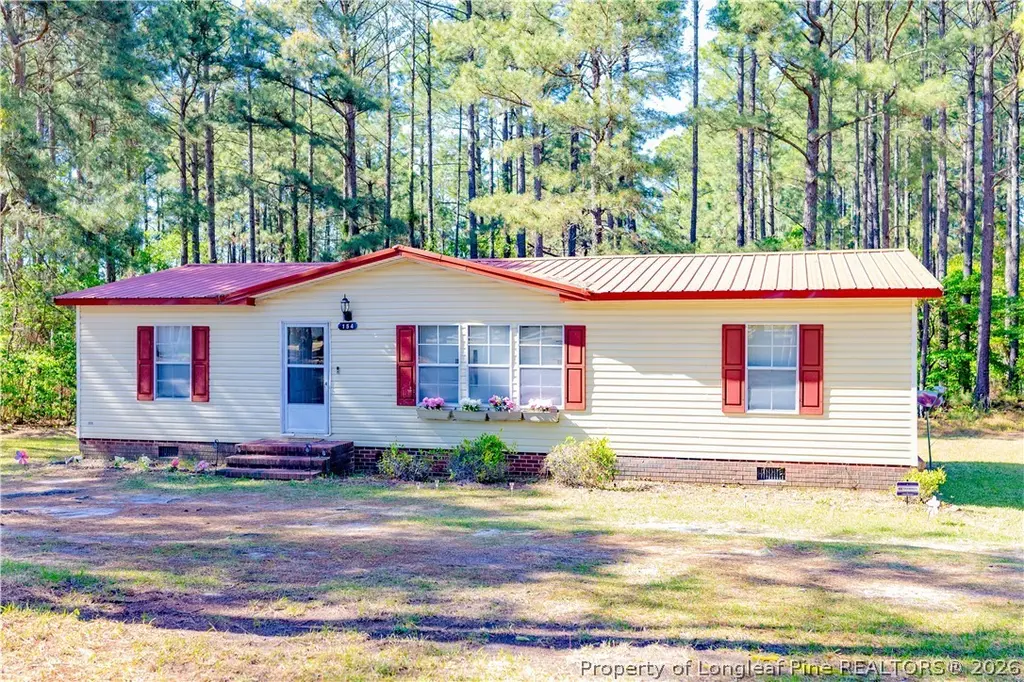
154 Roping Ln · Spout Springs, NC
Flood risk 1/10 · Minimal
- FEMA flood zone
- X (unshaded)
- Chance of flooding over 30 yrs
- 0.0%
- Est. flood insurance / yr
- $507 – $1,088
Fire risk 5/10 · Moderate
- Est. fire insurance / yr
- $906 – $1,684
Heat risk 6/10 · Moderate
- Hot days now (above 106°F)
- 7 days/yr
- Hot days in 30 yrs
- 16 days/yr
Wind risk 6/10 · Moderate
- Chance of severe wind over 30 yrs
- 69.0%
Air-quality risk 1/10 · Minimal
- Unhealthy air days now
- 0 days/yr
- Unhealthy air days in 30 yrs
- 0 days/yr
Risk factors via First Street. Map © Google.
Why this score? — see what drove the B+ grade
The composite is a weighted blend of 9 inputs, each scored 0–100. Each bar is that input's sub-score; the figure is the points it added to the 100-point composite (weight × sub-score).
- Cash flow +30.0/30.0
- ARV discount +15.0/15.0
- DSCR +10.0/10.0
- 1% rule +8.9/10.0
- Rent growth +3.2/5.0
- Schools +3.0/10.0
- Livability +2.5/5.0
- Condition / age +2.5/5.0
- Appreciation +0.0/10.0
$144,998
🖨 Deal sheet 📄 Offer letter ✓ Due diligence
Listing remarks MLS
-Charming 3 bedroom 2 bath home located in Cameron in Longhorn Estates. New carpet! Newer metal roof! Lovely kitchen, Split bedroom floor plan. This won't last! Close to 87 shopping and more! Great schools! Call for your showing today!
Key facts
- Metal roof
- Storage building
- Permanent foundation
Tags
Property features AI
Finance
- Other: Zoned RA-20 (Residential Agricultural); Cleared lot
Exterior
- Security: Smoke detectors
- Utilities: Public water; Septic tank or holding tank for sewer
- Home design: Single-family residence; One-story
- Construction: Brick veneer and vinyl siding; Built on a single level
- Exterior features: Storage; Front porch
Interior
- Kitchen: Dishwasher; Cooktop; Refrigerator
- Flooring: Laminate; Vinyl; Carpet
- Bathrooms: 2 full bathrooms
- Heating & cooling: Heat pump heating; Central air; Electric cooling; Ceiling fan(s)
- Interior features: Ceiling fans; Eat-in kitchen; 6 total rooms; No basement
- Laundry & utility: Washer; Dryer; Heat pump (utility/heating equipment noted)
Neighborhood map
What this means for you Summary
Snapshot
- This is a 3-bed/2.0-bath manufactured listed at $145k.
Deal economics
- At list price, monthly cash flow is $716 ($9k/yr) — positive.
- The deal already cash-flows at list — no discount required.
- Meets the 1% rule at list price ($2k rent vs $145k).
- Recommended offer: $143k (1.5% below list) — sets the bar for market timing.
- Cap rate 12.2% vs local median 4.1% in Spout Springs — top-decile yield for the area; either an underpriced asset or a hidden risk that comps aren't pricing in. Stress-test before assuming the spread holds.
Location & tenants
- Location reads: area grade B — affects rentability + tenant quality, not the cash-flow math above.
- Harnett County Schools (rural): math 31% / reading 39% proficiency, ranked #130 of 178 in NC (top 73%) — families likely to look elsewhere, expect single-tenant / working-renter base with shorter leases.
- Zoned schools: Highland Middle (math 34% / reading 41%, grade F, #256 of 475 statewide, top 55%, 875 students, 64% FRL); Western Harnett High (math 57% / reading 58%, grade C, #245 of 535 statewide, top 46%, 1,386 students, 60% FRL).
- Zoned-school proficiency averages 48% at this address vs 35% district-wide (+12 pts) — the actual schools serving this property are materially stronger than the Harnett County Schools average implies; a family-tenant draw the district grade alone would hide.
- Market conditions: Rents rising (+3.0%/yr); 244 active listings in the ZIP; solid renter incomes; 2,080 units permitted in Harnett County in 2024 (12 in 5+ unit buildings).
Forward outlook
- Local home prices are declining (-3.0%/yr); year-one equity from $1k of loan paydown is wiped out by about $4k of value loss. Plan a longer hold.
- Harnett County population projected at +42% by 2050 — long-run rental-demand tailwind backs the buy-and-hold thesis.
- At projected returns (-3.0% appreciation + 3.0% rent growth), your $41k cash investment doubles in ~6 years — after that, you're playing with house money.
Negotiation context
- It's been on market 17 days — a 2% lower offer ($143k) is reasonable based on typical stale-listing flexibility.
- 2 sale attempts since 8y ago with the ask held roughly flat each time — persistent listings suggest the price (not the market) is what's stuck; bring a comps-based counter.
- Current owner paid $67k; list at $145k implies a 116% gain — meaningful room to come down on a strong offer.
Risks & watch-outs
- Climate carrying-cost: major wind risk, 69% chance of damaging wind over 30y; moderate wildfire risk; extreme-heat days projected 7→16/yr by 2055 (HVAC capex compounding) — expect insurance premiums to compound above CPI over the hold.
Questions for the listing agent
- Is there a deadline driving the sale (1031 exchange, divorce, estate, relocation)? That informs how much negotiation room exists.
- What's the average days-on-market for RENTAL listings here right now (not sales)? A rising rental-DOM trend means longer vacancies and softer asking-rent achievability than the comps imply.
- What's the recent tenant-quality profile in this submarket — average credit score on applications, eviction rate, late-payment / NSF rate, and stable-employment percentage? A property-management company in the area should have these aggregated.
- How much new for-sale + rental construction is in the pipeline within 1–3 miles? Heavy new supply typically softens prices + rents 12–24 months out; constrained supply supports both.
Investment metrics
- 1% rule
- 1.39% ✓
- Cap rate
- 12.22%
- Cash-on-cash
- 21.15%
- DSCR
- 1.94
- GRM
- 6.0
CMA / ARV
- ARV (on-the-fly)
- $192,192
- Comps found
- 2
Show comp detail 2 sales within ~0.75 mi
| Address | Dist | Beds/Ba | Sqft | Sold | Price | $/sf | Match |
|---|---|---|---|---|---|---|---|
| 212 Roping Ln | 0.07mi | 3/2.0 | 1,379 (+10%) | 13mo | $204,000 | $148 | 68 |
| 1531 Hillmon Grove Rd | 0.50mi | 3/2.0 | 1,158 (-7%) | 14mo | $178,500 | $154 | 53 |
Match score weights: distance 35% · size 25% · config 20% · recency 20%. Top-matched comps best support the ARV.
Projected returns pro-forma
-3.0% appreciation · 2.95% rent growth · sell at horizon
- IRR
- 13.5%
- Equity multiple
- 1.54×
- Total profit
- $21,937
- Equity at exit
- $21,620
- IRR
- 22.3%
- Equity multiple
- 2.90×
- Total profit
- $77,188
- Equity at exit
- $12,537
Cash invested: $40,599 (down + closing). Projections, not guarantees.
Landlord ↔ Tenant lean methodology
- Overall (STATE)
- 85 Strongly Landlord-Friendly
- State North Carolina
- 85 Strongly Landlord-Friendly · R+3
- County
- — inherits STATE
- City
- — inherits STATE
ZIP-level market 28326
- Home prices YoY
- -9.9%
- Rents YoY
- 3.0%
- Active inventory
- 244
- Price-to-rent
- 6.0×
Monthly cashflow live
- Estimated rent
- $2,015 medium interval (Pro) →
- Mortgage (P&I)
- −$760
- Tax from tax record
- −$55 /mo · $661/yr
- Insurance
- −$60
- HOA
- −$0
- Vacancy / Maint / Mgmt
- −$423
- Net cashflow
- $716
Break-even live
UW: 25.0% down · 7.5% · 30yr · 1.5% tax · 5.0% vac · 8.0% maint · 8.0% mgmt
Financing live
Cash to close
- Down payment
- $36,250
- Closing costs
- $4,350
- Reserves months
- —
- Total cash needed
- —
Loan-product check · same deal, 3 products live
Conventional
25% down · 7.5% · 30yr
- Down + closing
- —
- Monthly P&I
- —
- Monthly cashflow
- —
- DSCR
- —
- Eligible?
- —
Personal DTI + credit; lowest rate.
DSCR
20% down · 8.5% · 30yr
- Down + closing
- —
- Monthly P&I
- —
- Monthly cashflow
- —
- DSCR
- —
- Eligible?
- —
No personal income docs; deal must DSCR.
Hard money
10% down · 12.0% · 12mo
- Down + closing
- —
- Monthly P&I
- —
- Monthly cashflow
- —
- DSCR
- —
- Eligible?
- —
Short-term bridge; refi at stabilization.
Listing history 5 events
-
2026-05-30status $144,998 Pending 17 DOM
-
2026-05-12$144,998 Active
-
2018-12-10soldstatus $67,000 235-char remark
Show marketing remark (235 chars)
-Charming 3 bedroom 2 bath home located in Cameron in Longhorn Estates. New carpet! Newer metal roof! Lovely kitchen, Split bedroom floor plan. This won't last! Close to 87 shopping and more! Great schools! Call for your showing today!
-
2018-12-10soldstatus $67,000
Show marketing remark (235 chars)
-Charming 3 bedroom 2 bath home located in Cameron in Longhorn Estates. New carpet! Newer metal roof! Lovely kitchen, Split bedroom floor plan. This won't last! Close to 87 shopping and more! Great schools! Call for your showing today!
-
2018-10-03$69,900 235-char remark
Show marketing remark (235 chars)
-Charming 3 bedroom 2 bath home located in Cameron in Longhorn Estates. New carpet! Newer metal roof! Lovely kitchen, Split bedroom floor plan. This won't last! Close to 87 shopping and more! Great schools! Call for your showing today!
ⓘ Source: listings_history table (triggers on properties + properties_extension) + one-shot
backfill from property_details.listing_events for pre-trigger history.
Tax reassessment forecast NC · Resets to sale price
- Current annual tax
- $661 · $55/mo
- Projected year-2 tax
- $1,189 · $99/mo
- Expected delta
- +$528/yr (+$44/mo · 79.8%)
ⓘ Screening estimate from a state-policy table — verify with the county assessor before closing.
Climate risk First Street
- Flood 1/10 Low FEMA zone X (unshaded) · 0% chance over 30 yrs
- Wildfire 5/10 Major
- Heat 6/10 Major 7 d/yr ≥106°F today · 16 d/yr by 30 yrs out
- Wind 6/10 Major 69% chance of damaging wind over 30 yrs
- Air quality 1/10 Low 0 unhealthy d/yr today · 0 by 30 yrs out
Nearby sold comps map
Loading sold comps map…
Walkable amenities ~0.75 mi
Loading nearby amenities…
Taxation est. · year 1
- Rental income
- $24,176
- − Mortgage interest
- −$8,122
- − Property taxes
- −$661
- − Insurance
- −$725
- − Repairs & maintenance
- −$1,934
- − Management
- −$1,934
- − Depreciation
- −$4,218
- Taxable income
- $6,581
- Est. tax owed @ 24.0%
- −$1,579
- After-tax cash flow
- $7,009/yr
For passive investors: Depreciation is non-cash, so a rental often shows a tax loss while cash-flowing — sheltering income. Rental losses are passive: they offset passive income freely, and up to $25,000/yr can offset ordinary (W-2) income if you actively participate and your MAGI is under $100k (phasing out to $0 by $150k); unused losses carry forward. On sale, claimed depreciation is recaptured at up to 25%, and gains may owe capital-gains tax (a 1031 exchange can defer both). Figures are a year-1 estimate at your 24.0% rate — not tax advice; consult a CPA.
Schools (NCES district)
- District
- Harnett County Schools
- NCES district ID
- 3702010
- Math proficiency
- 31% ▼ -2.00%
- Reading proficiency
- 39% ▼ -1.00%
- Median HH income
- $45,400
- Composite
- 29.88/100
- National rank
- #6397
- State rank
- #130 of 178 in NC
Livability — Spout Springs
No livability data for this city. (Only ~50 U.S. cities are tracked.)
Census & demographics
- County
- Harnett County · 125,715 people
- Metro
- Fayetteville, NC
- Population (ZIP)
- 26,068
- Household income
- $75,431
- Rent vs Own
- Severe rent burden
- 456.0
Population outlook (Harnett County) Hauer SSP2
- Today (2025)
- 153,758 people
- By 2030
- 166,581 · +8.3%
- By 2040
- 192,741 · +25.4%
- By 2050
- 218,332 · +42.0%
- By 2075
- 275,422 · +79.1%
- By 2100
- 313,511 · +103.9%
Race, ethnicity, and origin ACS 2023
- Neighborhood character
- Diverse neighborhood (Simpson 0.64)
- Race & ethnicity
- White 52% Black 27% Hispanic / Latino 12% Two or more races 8% Asian 1%
- Hispanic origin (detail)
- Mexican 5% Puerto Rican 6%
- Common ancestry
- Slovak 3% Lithuanian 3% Serbian 2%
- Foreign-born
- 4% · Canada
- Languages at home
- 91% English-only · Spanish 7%
Political lean MEDSL · Harnett
- 2024 margin
- Strong R (+25.1) · D 36.9% · R 62.0% · Other 1.1%
- 2008→2024 swing
- -8.4pp toward R · 2008: -16.7pp · 2024: -25.1pp
- All cycles
- 2024: R+25.1 2020: R+22.4 2016: R+24.1 2012: R+19.4 2008: R+16.7
Not yet ingested
- Civics
- —
Market trends
- HPI YoY
- ▼ -24.96%
- Current HPI
- 226.8295
- Rent YoY
- ▲ 2.95%
- Metro
- Fayetteville, NC
- State GDP YoY
- ▲ 3.28%
- F500 in state
- 26
Industry mix (Fortune 500 HQ in NC)
| Industry | F500 HQs | Revenue |
|---|---|---|
| Financial Services | 2 | $213B |
|
||
| Retail | 2 | $95B |
|
||
| Industrial Conglomerate | 1 | $38B |
|
||
| Metals / Steel | 1 | $35B |
|
||
| Utilities | 1 | $30B |
|
||
| Industrial Machinery | 1 | $19B |
|
||
Price history
+107.4% since first listed4 events — show timeline
- 2026-05-12 Listed $144,998 LPRMLS
- 2018-12-10 Sold (Public Records) $67,000 Public Records
- 2018-12-10 Sold (MLS) $67,000 LPRMLS
- 2018-10-03 Listed $69,900 LPRMLS
Property tax history
+0.7%/yrLatest (2025): $661 · +0.0% YoY. Source: county tax records.
Cash-flow waterfall
monthlySold comps — $/sqft
last 12 mo · ≤1 miLoading sold comps…