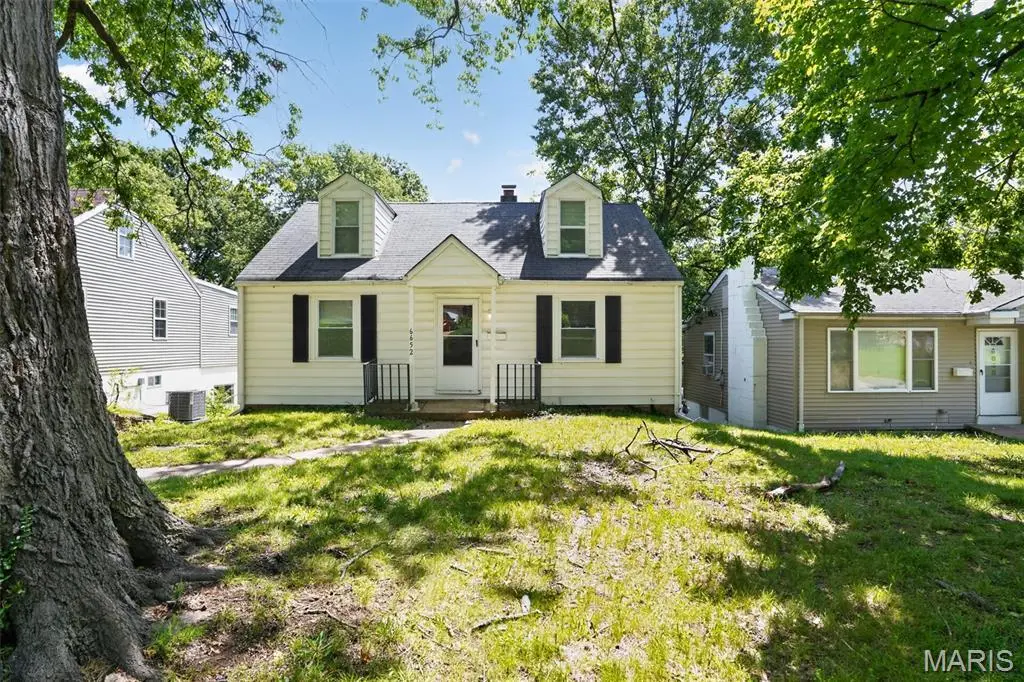
6652 Thurston Ave · Berkeley, MO
Flood risk 1/10 · Minimal
- FEMA flood zone
- X (unshaded)
- Chance of flooding over 30 yrs
- 0.0%
- Est. flood insurance / yr
- $473 – $860
Fire risk 1/10 · Minimal
- Est. fire insurance / yr
- $1,054 – $1,958
Heat risk 4/10 · Minor
- Hot days now (above 106°F)
- 7 days/yr
- Hot days in 30 yrs
- 20 days/yr
Wind risk 2/10 · Minimal
- Chance of severe wind over 30 yrs
- 1.0%
Air-quality risk 3/10 · Minor
- Unhealthy air days now
- 3 days/yr
- Unhealthy air days in 30 yrs
- 5 days/yr
Risk factors via First Street. Map © Google.
Why this score? — see what drove the B grade
The composite is a weighted blend of 9 inputs, each scored 0–100. Each bar is that input's sub-score; the figure is the points it added to the 100-point composite (weight × sub-score).
- Cash flow +30.0/30.0
- ARV discount +14.7/15.0
- DSCR +10.0/10.0
- 1% rule +9.7/10.0
- Rent growth +2.9/5.0
- Livability +2.7/5.0
- Condition / age +2.5/5.0
- Schools +1.2/10.0
- Appreciation +0.0/10.0
$94,900
🖨 Deal sheet (PDF) 📄 Offer letter ✓ Due diligence
Listing remarks
Located in the established community of Berkeley, Missouri, 6652 Thurston Avenue presents a well-situated residential opportunity with convenient access to local amenities, schools, parks, and major thoroughfares. The property is set along a quiet, paved city street with surrounding mature homes that reflect long-term neighborhood stability and pride of ownership. Its location provides quick connectivity to Interstate 170 and nearby commercial corridors, offering ease of travel to downtown St. Louis, Lambert Airport, and surrounding employment centers. Everyday conveniences such as grocery stores, dining options, and essential services are just a short drive away. This address offers a bala
Key facts
- 8,015 sq ft lot
- Built 1949
- Listed 16 days
Property features AI
Finance
- Other: Lot size approximately 0.184 acre (about 50 x 160)
- Financial info: Lease not considered
Exterior
- Parking: No designated parking or carport listed
- Utilities: Public water; Public sewer; Electric service (other)
- Home design: Single-family residence; House with one and one-half levels; Above-grade finished area about 1,165 (source: public records)
- Construction: Vinyl siding exterior; Composition roof
- Exterior features: Level lot; Paved road access
Interior
- Kitchen: Includes other appliances
- Bedrooms: Three bedrooms on the main level
- Bathrooms: One full bathroom on the main level
- Heating & cooling: Other heating; Central electric air conditioning
- Interior features: Full basement; No fireplace; Other built-in appliances
- Laundry & utility: Laundry/utility details not provided
Neighborhood map
What this means for you Summary
Snapshot
- This is a 3-bed/1.0-bath single-family listed at $95k.
Deal economics
- At list price, monthly cash flow is $494 ($6k/yr) — positive.
- The deal already cash-flows at list — no discount required.
- Meets the 1% rule at list price ($1k rent vs $95k).
- Recommended offer: $93k (1.5% below list) — sets the bar for market timing.
- Cap rate 12.5% vs local median 10.1% in Berkeley — meaningfully above typical; check what's discounted (condition, days-on-market, listing class) to confirm the premium yield is real.
Location & tenants
- Location reads 54/100 on livability (#774 in MO) — a working-class tenant base; expect higher turnover. Strengths: cost of living A+, housing A; Watch: health & safety C-, crime F, amenities F.
- Ferguson-Florissant R-II (suburban): math 7% / reading 20% proficiency, ranked #311 of 324 in MO (top 96%) — low school quality limits family demand, transient renter base, plan for 1-2y turnover; 70% free/reduced lunch — lower-income household profile, screen leases tightly.
- Zoned schools: Walnut Grove Elem. (342 students, 99% FRL); Mccluer High (math 0% / reading 17%, grade F, #511 of 521 statewide, top 98%, 1,181 students, 100% FRL) — zoned schools average 99% FRL vs 70% district-wide (30 pts higher); higher-poverty schools than district average — tighter screening recommended.
- Market conditions: Rents rising (+1.6%/yr); 71 active listings in the ZIP; 40 comparable units currently listed for rent nearby; rentals at typical pace (median 25d on market — plan ~3-4 weeks tenant-placement turnaround); lower-income renter base — watch delinquency; 920 units permitted in St. Louis County in 2024 (250 in 5+ unit buildings).
- This rent runs 38% of the median local income ($45k/yr) — at the standard rent-burdened threshold; future hikes will face affordability resistance.
Forward outlook
- Local home prices are declining (-3.0%/yr); year-one equity from $656 of loan paydown is wiped out by about $3k of value loss. Plan a longer hold.
- At projected returns (-3.0% appreciation + 1.6% rent growth), your $27k cash investment doubles in ~6 years — after that, you're playing with house money.
Negotiation context
- It's been on market 17 days — a 2% lower offer ($93k) is reasonable based on typical stale-listing flexibility.
- Current owner paid $51k; list at $95k implies a 87% gain — meaningful room to come down on a strong offer.
Risks & watch-outs
- Watch-outs: built in 1949 — expect roof / HVAC / electrical / plumbing capex.
Questions for the listing agent
- Built in 1949 — when were the roof, HVAC, electrical panel, plumbing, and water heater last replaced?
- Is there a deadline driving the sale (1031 exchange, divorce, estate, relocation)? That informs how much negotiation room exists.
- Schools are F-rated, which usually means shorter tenancies and higher turnover. Who's the typical renter profile here, and what's been the actual vacancy rate?
- Crime grade is F in this area — have there been break-ins, vandalism, or insurance claims at this property in the last 3 years? What carrier currently insures it and at what premium?
- What's the average days-on-market for RENTAL listings here right now (not sales)? A rising rental-DOM trend means longer vacancies and softer asking-rent achievability than the comps imply.
- What's the recent tenant-quality profile in this submarket — average credit score on applications, eviction rate, late-payment / NSF rate, and stable-employment percentage? A property-management company in the area should have these aggregated.
- How much new for-sale + rental construction is in the pipeline within 1–3 miles? Heavy new supply typically softens prices + rents 12–24 months out; constrained supply supports both.
Investment metrics
- 1% rule
- 1.47% ✓
- Cap rate
- 12.53%
- Cash-on-cash
- 22.29%
- DSCR
- 1.99
- GRM
- 5.7
CMA / ARV
- ARV (on-the-fly)
- $113,005
- Comps found
- 12
Show comp detail 12 sales within ~0.75 mi
| Address | Dist | Beds/Ba | Sqft | Sold | Price | $/sf | Match |
|---|---|---|---|---|---|---|---|
| 6801 Knoll Ave | 0.23mi | 3/1.0 | 1,224 (+5%) | 1mo | $104,900 | $86 | 80 |
| 8301 Pepperidge Dr | 0.42mi | 3/1.0 | 1,120 (-4%) | 1mo | $139,900 | $125 | 73 |
| 8302 Woodhurst Dr | 0.44mi | 3/1.0 | 1,120 (-4%) | 1mo | $99,900 | $89 | 73 |
| 8219 Davenport Dr | 0.49mi | 3/1.0 | 1,116 (-4%) | 1mo | $115,000 | $103 | 70 |
| 258 Williams Blvd | 0.49mi | 3/1.0 | 1,075 (-8%) | 0mo | $129,900 | $121 | 64 |
| 8513 Midwood Ave | 0.70mi | 3/2.0 | 1,176 (+1%) | 0mo | $94,900 | $81 | 61 |
| 6604 Graybirch Dr | 0.43mi | 3/2.0 | 1,288 (+11%) | 1mo | $124,900 | $97 | 58 |
| 6219 Tyndall Dr | 0.71mi | 2/1.5 (-1) | 1,128 (-3%) | 2mo | $94,900 | $84 | 53 |
| 8379 Midwood Ave | 0.58mi | 2/1.0 (-1) | 1,052 (-10%) | 2mo | $89,900 | $85 | 50 |
| 8418 Midwood Ave | 0.60mi | 3/2.0 | 1,288 (+11%) | 2mo | $125,000 | $97 | 49 |
| 8443 Red Fir Dr | 0.62mi | 3/2.0 | 1,288 (+11%) | 2mo | $32,000 | $25 | 48 |
| 8406 January Ave | 0.64mi | 3/2.0 | 1,288 (+11%) | 2mo | $160,000 | $124 | 47 |
Match score weights: distance 35% · size 25% · config 20% · recency 20%. Top-matched comps best support the ARV.
Projected returns pro-forma
-3.0% appreciation · 1.61% rent growth · sell at horizon
- IRR
- 13.5%
- Equity multiple
- 1.53×
- Total profit
- $14,126
- Equity at exit
- $14,150
- IRR
- 21.3%
- Equity multiple
- 2.70×
- Total profit
- $45,062
- Equity at exit
- $8,205
Cash invested: $26,572 (down + closing). Projections, not guarantees.
Landlord ↔ Tenant lean methodology
- Overall (STATE)
- 81 Strongly Landlord-Friendly
- State Missouri
- 81 Strongly Landlord-Friendly · R+10
- County
- — inherits STATE
- City
- — inherits STATE
ZIP-level market 63134
- Rents YoY
- 1.6%
- Active inventory
- 71
- Price-to-rent
- 5.7×
Monthly cashflow live
- Estimated rent
- $1,398 high interval (Pro) →
- Mortgage (P&I)
- −$498
- Tax from tax record
- −$73 /mo · $882/yr
- Insurance
- −$40
- HOA
- −$0
- Vacancy / Maint / Mgmt
- −$294
- Net cashflow
- $494
Break-even live
Sensitivity live
| Price | -10% $547 | -5% $520 | +0% $494 | +5% $467 | +10% $440 |
|---|---|---|---|---|---|
| Rent | -10% $383 | -5% $438 | +0% $494 | +5% $549 | +10% $604 |
| Rate | -1.0pp $541 | -0.5pp $518 | base $494 | +0.5pp $469 | +1.0pp $444 |
UW: 25.0% down · 7.5% · 30yr · 1.5% tax · 5.0% vac · 8.0% maint · 8.0% mgmt
Financing live
Cash to close
- Down payment
- $23,725
- Closing costs
- $2,847
- Reserves months
- —
- Total cash needed
- —
Loan-product check · same deal, 3 products live
Conventional
25% down · 7.5% · 30yr
- Down + closing
- —
- Monthly P&I
- —
- Monthly cashflow
- —
- DSCR
- —
- Eligible?
- —
Personal DTI + credit; lowest rate.
DSCR
20% down · 8.5% · 30yr
- Down + closing
- —
- Monthly P&I
- —
- Monthly cashflow
- —
- DSCR
- —
- Eligible?
- —
No personal income docs; deal must DSCR.
Hard money
10% down · 12.0% · 12mo
- Down + closing
- —
- Monthly P&I
- —
- Monthly cashflow
- —
- DSCR
- —
- Eligible?
- —
Short-term bridge; refi at stabilization.
Rent comps 40 comps
| Address | Beds | Baths | Sqft | Rent | $/sqft | DOM | Units | Dist |
|---|---|---|---|---|---|---|---|---|
| 6625 Thurston Ave Saint Louis, MO | 2.0 | 1.0 | 939 | $1,300 | $1.38 | 44d | 1 | 0.10mi |
| 6625 Thurston Ave Saint Louis, MO | 2.0 | 1.0 | 939 | $1,400 | $1.49 | 24d | 1 | 0.10mi |
| 6867 Thurston Ave Saint Louis, MO | 3.0 | 2.0 | 1243 | $1,580 | $1.27 | 44d | 1 | 0.20mi |
| 541 Hentschel Pl Saint Louis, MO | 2.0 | 1.0 | 1305 | $1,500 | $1.15 | 5d | 1 | 0.26mi |
| 24 Vierling Dr Saint Louis, MO | 2.0 | 1.0 | 850 | $1,290 | $1.52 | 8d | 1 | 0.35mi |
| 153 Bascom Dr Saint Louis, MO | 3.0 | 1.0 | 1076 | $1,195 | $1.11 | 20d | 1 | 0.41mi |
| 171 Elbring Dr Saint Louis, MO | 3.0 | 1.5 | 1008 | $1,395 | $1.38 | 13d | 1 | 0.45mi |
| 46 Bascom Dr Saint Louis, MO | 2.0 | 1.0 | 932 | $1,175 | $1.26 | 44d | 1 | 0.49mi |
| 6333 Peurifoy Ave Saint Louis, MO | 3.0 | 2.0 | 840 | $1,295 | $1.54 | 24d | 1 | 0.50mi |
| 8330 Woodhurst Dr Saint Louis, MO | 3.0 | 1.0 | 1120 | $1,000 | $0.89 | 8d | 1 | 0.51mi |
| 8418 Bayberry Dr Saint Louis, MO | 3.0 | 2.0 | 1288 | $1,350 | $1.05 | 22d | 1 | 0.53mi |
| 1275 N Florissant Rd Saint Louis, MO | 2.0 | 1.0 | 1008 | $1,275 | $1.26 | 24d | 1 | 0.56mi |
| 107 Anistasia Dr Saint Louis, MO | 2.0 | 2.0 | 1030 | $1,400 | $1.36 | 24d | 1 | 0.59mi |
| 260 Sadonia Ave Saint Louis, MO | 3.0 | 2.0 | 1088 | $1,623 | $1.49 | 21d | 1 | 0.59mi |
| 263 Sadonia Ave Saint Louis, MO | 3.0 | 2.0 | 888 | $1,350 | $1.52 | 44d | 1 | 0.62mi |
| 8412 Chalons Ct Saint Louis, MO | 3.0 | 1.0 | 1380 | $1,370 | $0.99 | 24d | 1 | 0.64mi |
| 6452 Evergreen Blvd Saint Louis, MO | 3.0 | 2.0 | 1288 | $1,500 | $1.16 | 24d | 1 | 0.65mi |
| 11 Anistasia Dr Saint Louis, MO | 3.0 | 1.5 | 1120 | $1,345 | $1.20 | 24d | 1 | 0.67mi |
| 222 Henquin Dr Saint Louis, MO | 2.0 | 1.0 | 816 | $1,050 | $1.29 | 18d | 1 | 0.67mi |
| 6336 Washington Ave Berkeley, MO | 2.0 | 1.0 | 720 | $1,175 | $1.63 | 44d | 1 | 0.68mi |
| 6334 Washington Ave Berkeley, MO | 3.0 | 1.0 | 864 | $1,100 | $1.27 | 5d | 1 | 0.68mi |
| 8437 January Ave Saint Louis, MO | 3.0 | 2.0 | 1288 | $1,350 | $1.05 | 44d | 1 | 0.70mi |
| 6132 Eaton Dr Saint Louis, MO | 2.0 | 1.0 | 792 | $1,125 | $1.42 | 24d | 1 | 0.71mi |
| 6156 Wulff Dr Saint Louis, MO | 3.0 | 2.0 | 960 | $1,425 | $1.48 | 11d | 1 | 0.73mi |
| 6315 Washington Ave Berkeley, MO | 2.0 | 1.0 | 739 | $1,175 | $1.59 | 17d | 1 | 0.73mi |
| 7025 Richwood Ln Hazelwood, MO | 3.0 | 1.0 | 936 | $1,375 | $1.47 | 18d | 1 | 0.73mi |
| 8439 Alder Ave Saint Louis, MO | 3.0 | 1.5 | 1176 | $1,425 | $1.21 | 24d | 1 | 0.74mi |
| 241 Flora Dr Saint Louis, MO | 2.0 | 1.0 | 703 | $1,075 | $1.53 | 24d | 1 | 0.75mi |
| 36 Connolly Dr Saint Louis, MO | 3.0 | 1.0 | 1024 | $1,149 | $1.12 | 24d | 1 | 0.76mi |
| 6214 Jefferson Ave Saint Louis, MO | 2.0 | 1.0 | 816 | $1,195 | $1.46 | 24d | 1 | 0.78mi |
| 8306 Whitewater Dr Saint Louis, MO | 3.0 | 1.0 | 792 | $1,195 | $1.51 | 8d | 1 | 0.79mi |
| 6044 Cascade Dr Saint Louis, MO | 2.0 | 1.0 | 984 | $1,150 | $1.17 | 8d | 1 | 0.80mi |
| 24 Barto Dr Saint Louis, MO | 3.0 | 1.0 | 864 | $1,400 | $1.62 | 44d | 1 | 0.81mi |
| 221 Barto Dr Saint Louis, MO | 3.0 | 2.0 | 958 | $1,295 | $1.35 | 21d | 1 | 0.88mi |
| 60 Mayme Dr Saint Louis, MO | 3.0 | 1.0 | 960 | $1,285 | $1.34 | 44d | 1 | 0.88mi |
| 6234 Hancock Ave Berkeley, MO | 2.0 | 1.0 | 846 | $1,050 | $1.24 | 44d | 1 | 0.90mi |
| 220 Du Bourg Ln Florissant, MO | 2.0 | 1.0 | 816 | $1,150 | $1.41 | 44d | 1 | 0.91mi |
| 910 Disco Dr Saint Louis, MO | 3.0 | 1.0 | 924 | $1,260 | $1.36 | 17d | 1 | 0.93mi |
| 6698 Amora Ave Berkeley, MO | 2.0–3.0 | 1.5 | 1625 | $1,500 | $0.92 | 44d | 1 | 0.95mi |
| 410 Robert Ave Ferguson, MO | 4.0 | 2.0 | 1471 | $2,000 | $1.36 | 12d | 1 | 1.03mi |
Listing history 12 events
-
2026-06-21days on market $94,900 Active 17 DOM
-
2026-06-18days on market $94,900 Active 14 DOM
-
2026-06-17days on market $94,900 Active 13 DOM
-
2026-06-16days on market $94,900 Active 12 DOM
-
2026-06-15days on market $94,900 Active 11 DOM
-
2026-06-13days on market $94,900 Active 9 DOM
-
2026-06-13days on market $94,900 Active 8 DOM
-
2026-06-09days on market $94,900 Active 5 DOM
-
2026-06-08days on market $94,900 Active 4 DOM
-
2026-06-07days on market $94,900 Active 3 DOM
-
2026-06-05remarks 699-char remark
-
2026-06-05$94,900 Active 1 DOM
ⓘ Source: listings_history table (triggers on properties + properties_extension) + one-shot
backfill from property_details.listing_events for pre-trigger history.
Tax reassessment forecast MO · Resets to sale price
- Current annual tax
- $882 · $73/mo
- Projected year-2 tax
- $921 · $77/mo
- Expected delta
- +$39/yr (+$3/mo · 4.4%)
ⓘ Screening estimate from a state-policy table — verify with the county assessor before closing.
Climate risk First Street
- Flood 1/10 Low FEMA zone X (unshaded) · 0% chance over 30 yrs
- Wildfire 1/10 Low
- Heat 4/10 Moderate 7 d/yr ≥106°F today · 20 d/yr by 30 yrs out
- Wind 2/10 Low 100% chance of damaging wind over 30 yrs
- Air quality 3/10 Moderate 3 unhealthy d/yr today · 5 by 30 yrs out
Nearby sold comps map
Loading sold comps map…
Walkable amenities ~0.75 mi
Loading nearby amenities…
Taxation est. · year 1
- Rental income
- $16,775
- − Mortgage interest
- −$5,316
- − Property taxes
- −$882
- − Insurance
- −$474
- − Repairs & maintenance
- −$1,342
- − Management
- −$1,342
- − Depreciation
- −$2,761
- Taxable income
- $4,658
- Est. tax owed @ 24.0%
- −$1,118
- After-tax cash flow
- $4,806/yr
For passive investors: Depreciation is non-cash, so a rental often shows a tax loss while cash-flowing — sheltering income. Rental losses are passive: they offset passive income freely, and up to $25,000/yr can offset ordinary (W-2) income if you actively participate and your MAGI is under $100k (phasing out to $0 by $150k); unused losses carry forward. On sale, claimed depreciation is recaptured at up to 25%, and gains may owe capital-gains tax (a 1031 exchange can defer both). Figures are a year-1 estimate at your 24.0% rate — not tax advice; consult a CPA.
Schools (NCES district)
- District
- Ferguson-Florissant R-II
- NCES district ID
- 2912010
- Math proficiency
- 7% ▼ -9.00%
- Reading proficiency
- 20% ▼ -6.00%
- Median HH income
- $44,610
- Composite
- 11.96/100
- National rank
- #9666
- State rank
- #311 of 324 in MO
Livability — Berkeley
- Score
- 54/100
- State rank
- #774
- US rank
- #23800
Category grades
Schools grade is shown separately in the Schools card above.
Census & demographics
- Census place
- Berkeley, MO
- County
- Saint Louis County · 888,823 people
- City population
- 13,059
- Metro
- St. Louis, MO-IL
- Population (ZIP)
- 13,059
- Household income
- $44,680
- Rent vs Own
- Severe rent burden
- 655.0
Population outlook (St. Louis County) Hauer SSP2
- Today (2025)
- 1,025,227 people
- By 2030
- 1,028,023 · +0.3%
- By 2040
- 1,020,940 · -0.4%
- By 2050
- 1,007,280 · -1.8%
- By 2075
- 987,277 · -3.7%
- By 2100
- 921,984 · -10.1%
Race, ethnicity, and origin ACS 2023
- Neighborhood character
- Predominantly Black (66%)
- Race & ethnicity
- Black 66% White 17% Hispanic / Latino 13% Two or more races 7%
- Hispanic origin (detail)
- Mexican 8%
- Common ancestry
- Lithuanian 1%
- Foreign-born
- 6% · Canada
- Languages at home
- 86% English-only · Spanish 11%
Political lean MEDSL · St. Louis
- 2024 margin
- Strong D (+23.4) · D 60.8% · R 37.4% · Other 1.7%
- 2008→2024 swing
- +3.5pp toward D · 2008: 19.9pp · 2024: 23.4pp
- All cycles
- 2024: D+23.4 2020: D+24.0 2016: D+16.2 2012: D+13.7 2008: D+19.9
Not yet ingested
- Civics
- —
Market trends
- HPI YoY
- ▼ -164.02%
- Current HPI
- 226.9524
- Rent YoY
- ▲ 1.61%
- Metro
- St. Louis, MO-IL
- State GDP YoY
- ▲ 1.84%
- F500 in state
- 20
Industry mix (Fortune 500 HQ in MO)
| Industry | F500 HQs | Revenue |
|---|---|---|
| Healthcare | 1 | $163B |
|
||
| Insurance | 1 | $21B |
|
||
| Industrial Technology | 1 | $17B |
|
||
| Retail | 1 | $16B |
|
||
| Industrial Distribution | 1 | $10B |
|
||
| Utilities | 1 | $9B |
|
||
Price history
+41.6% since first listed10 events — show timeline
- 2026-06-04 Listed $94,900 MARIS as Distributed by MLS Grid
- 2022-02-23 Sold (Public Records) $50,790 Public Records
- 2012-01-06 Sold (Public Records) $18,500 Public Records
- 2011-12-30 Sold (Public Records) $15,500 Public Records
- 2004-12-01 Sold (Public Records) $90,000 Public Records
- 2004-03-19 Sold (Public Records) $34,100 Public Records
- 2004-03-19 Sold (Public Records) $34,100 Public Records
- 2000-05-01 Sold (Public Records) $68,000 Public Records
- 2000-02-04 Sold (Public Records) $67,000 Public Records
- 2000-01-14 Sold (Public Records) — Public Records
Property tax history
+2.2%/yrLatest (2022): $882 · +0.7% YoY. Source: county tax records.
Cash-flow waterfall
monthlySold comps — $/sqft
last 12 mo · ≤1 miLoading sold comps…