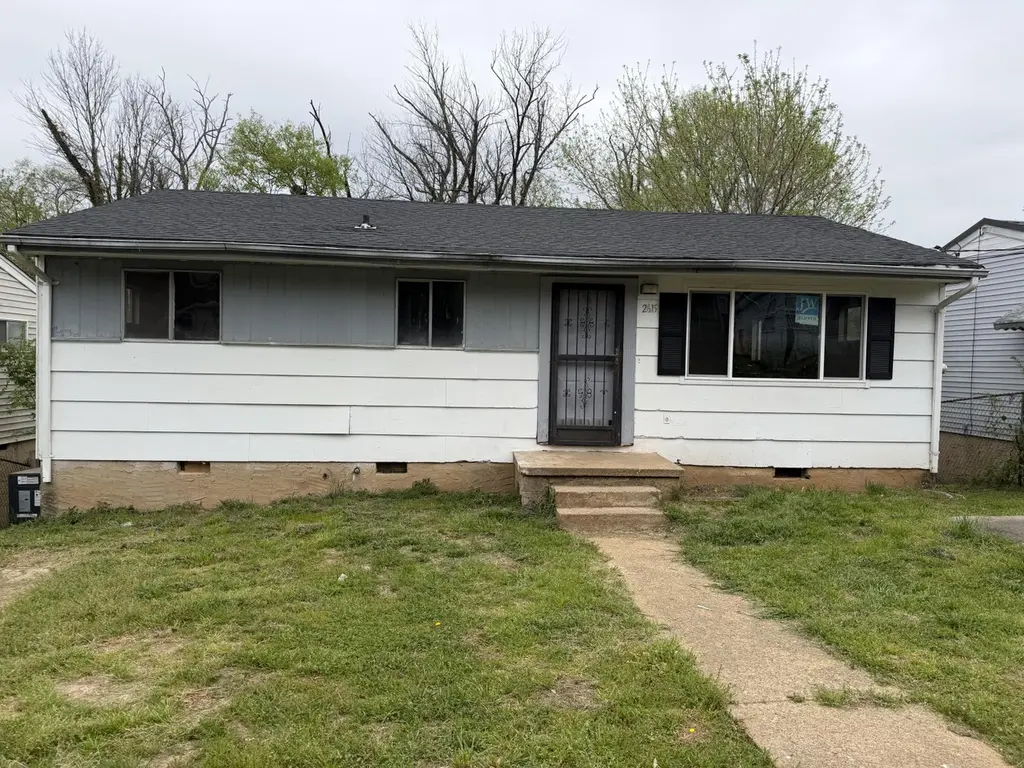
2615 Andrews St · Chattanooga, TN
Flood risk 1/10 · Minimal
- FEMA flood zone
- X (unshaded)
- Chance of flooding over 30 yrs
- 0.0%
- Est. flood insurance / yr
- $507 – $1,088
Fire risk 2/10 · Minimal
- Est. fire insurance / yr
- $949 – $1,763
Heat risk 6/10 · Moderate
- Hot days now (above 105°F)
- 7 days/yr
- Hot days in 30 yrs
- 19 days/yr
Wind risk 4/10 · Minor
- Chance of severe wind over 30 yrs
- 10.0%
Air-quality risk 3/10 · Minor
- Unhealthy air days now
- 2 days/yr
- Unhealthy air days in 30 yrs
- 2 days/yr
Risk factors via First Street. Map © Google.
Why this score? — see what drove the D+ grade
The composite is a weighted blend of 9 inputs, each scored 0–100. Each bar is that input's sub-score; the figure is the points it added to the 100-point composite (weight × sub-score).
- Cash flow +22.0/30.0
- DSCR +7.0/10.0
- 1% rule +4.4/10.0
- Livability +3.9/5.0
- Rent growth +3.8/5.0
- Schools +2.7/10.0
- Condition / age +2.5/5.0
- ARV discount +1.5/15.0
- Appreciation +0.0/10.0
$139,900
🖨 Deal sheet (PDF) 📄 Offer letter ✓ Due diligence
Listing remarks MLS
ATTENTION INVESTORS or HOMEOWNERS!! Fantastic opportunity in one of Chattanooga's up-and-coming neighborhood's. Located just minutes from downtown shopping and dining. This single level home is move-in-ready! Roof is only a couple years old and HVAC is new. Property is being sold as-is, but is in livable condition. This is a great opportunity to add to your investment portfolio or settle in your new home!
Key facts
- Move-in-ready
- New hvac
- 6,098 sq ft lot
Tags
Property features AI
Finance
- HOA & community: No community amenities listed
Exterior
- Parking: Off-street parking
- Utilities: Public water; Public sewer; Electricity connected; Water connected; Sewer connected
- Home design: Single-family residence; One story; Residential house; Property condition: Fixer and updated/remodeled
- Construction: Wood siding exterior; Block foundation; Shingle roof; Built as a house (structure type)
- Exterior features: Level to rolling lot; City street frontage
Interior
- Kitchen: Refrigerator; Free-standing electric range
- Bedrooms: Total of 5 rooms (includes bedrooms and living spaces)
- Flooring: Hardwood flooring; Vinyl flooring
- Bathrooms: 1 full bathroom
- Heating & cooling: Central heating (electric); Central air conditioning (electric)
- Interior features: Aluminum frame windows; Rain gutters
- Laundry & utility: Washer hookup; Electric dryer hookup; Laundry located in basement
Neighborhood map
What this means for you Summary
Snapshot
- This is a 3-bed/1.0-bath single-family listed at $140k.
Deal economics
- At list price, monthly cash flow is $223 ($3k/yr) — positive.
- The deal already cash-flows at list — no discount required.
- To meet the 1% rule (rent ≥ 1% of price), the offer needs to be $132k (5.6% below list).
- Recommended offer: $132k (5.6% below list) — sets the bar for 1% rule.
- Cap rate 8.2% vs local median 3.4% in Chattanooga — top-decile yield for the area; either an underpriced asset or a hidden risk that comps aren't pricing in. Stress-test before assuming the spread holds.
Location & tenants
- Location reads 78/100 on livability (#3 in TN, #2,582 nationally) — a middle-class / working-renter tenant base. Strengths: amenities A+, commute A+, cost of living A+; Watch: employment D+, crime F.
- Hamilton County (urban): math 31% / reading 31% proficiency, ranked #42 of 139 in TN (top 30%) — families likely to look elsewhere, expect single-tenant / working-renter base with shorter leases.
- Zoned schools: Hardy Elementary School (math 8% / reading 2%, grade F, #896 of 952 statewide, top 96%, 435 students, 0% FRL); Orchard Knob Middle (math 5% / reading 6%, grade F, #291 of 333 statewide, top 88%, 334 students, 0% FRL); Brainerd High School (math 2% / reading 12%, grade F, #294 of 332 statewide, top 91%, 635 students, 0% FRL) — zoned schools average 0% FRL vs 52% district-wide (52 pts lower); this property's tenant base skews higher-income than the district average.
- Zoned-school proficiency averages 6% at this address vs 31% district-wide (-25 pts) — the specific schools serving this property underperform the Hamilton County average; the district grade overstates school quality for this exact location.
- Market conditions: Rents rising fast (+5.1%/yr); 130 active listings in the ZIP; 14 comparable units currently listed for rent nearby; rentals at typical pace (median 25d on market — plan ~3-4 weeks tenant-placement turnaround); lower-income renter base — watch delinquency; 2,133 units permitted in Hamilton County in 2024 (405 in 5+ unit buildings).
- This rent runs 35% of the median local income ($45k/yr) — at the standard rent-burdened threshold; future hikes will face affordability resistance.
Forward outlook
- Local home prices are declining (-3.0%/yr); year-one equity from $967 of loan paydown is wiped out by about $4k of value loss. Plan a longer hold.
- Hamilton County population projected at +23% by 2050 — long-run rental-demand tailwind backs the buy-and-hold thesis.
Negotiation context
- It's been on market 18 days — a 2% lower offer ($138k) is reasonable based on typical stale-listing flexibility.
- 6 sale attempts since 26y ago; this cycle's ask has dropped $15k (10%) from the opening price — seller is motivated, your offer sets the floor, not the list.
- Current owner paid $42k; list at $140k implies a 233% gain — meaningful room to come down on a strong offer.
Risks & watch-outs
- Climate carrying-cost: extreme-heat days projected 7→19/yr by 2055 (HVAC capex compounding) — expect insurance premiums to compound above CPI over the hold.
Questions for the listing agent
- Built in 1960 — when were the roof, HVAC, electrical panel, plumbing, and water heater last replaced?
- Is there a deadline driving the sale (1031 exchange, divorce, estate, relocation)? That informs how much negotiation room exists.
- Schools are F-rated, which usually means shorter tenancies and higher turnover. Who's the typical renter profile here, and what's been the actual vacancy rate?
- Crime grade is F in this area — have there been break-ins, vandalism, or insurance claims at this property in the last 3 years? What carrier currently insures it and at what premium?
- The area grade is low — what's the realistic commute time and amenity access for the typical tenant pool here? Any planned neighborhood developments (good or bad) we should know about?
- What's the average days-on-market for RENTAL listings here right now (not sales)? A rising rental-DOM trend means longer vacancies and softer asking-rent achievability than the comps imply.
- What's the recent tenant-quality profile in this submarket — average credit score on applications, eviction rate, late-payment / NSF rate, and stable-employment percentage? A property-management company in the area should have these aggregated.
- How much new for-sale + rental construction is in the pipeline within 1–3 miles? Heavy new supply typically softens prices + rents 12–24 months out; constrained supply supports both.
Investment metrics
- 1% rule
- 0.94% ✗
- Cap rate
- 8.21%
- Cash-on-cash
- 6.83%
- DSCR
- 1.30
- GRM
- 8.8
CMA / ARV
- ARV (on-the-fly)
- $123,552
- Comps found
- 6
Show comp detail 6 sales within ~0.75 mi
| Address | Dist | Beds/Ba | Sqft | Sold | Price | $/sf | Match |
|---|---|---|---|---|---|---|---|
| 2605 Wilder St | 0.32mi | 2/1.0 (-1) | 871 (-7%) | 10mo | $115,000 | $132 | 60 |
| 3301 Taylor St | 0.54mi | 2/1.0 (-1) | 1,000 (+7%) | 4mo | $205,000 | $205 | 56 |
| 2104 Sims St | 0.72mi | 3/2.0 | 960 (+3%) | 4mo | $230,000 | $240 | 55 |
| 3201 Curtis St | 0.58mi | 2/1.0 (-1) | 1,026 (+10%) | 1mo | $80,000 | $78 | 51 |
| 2313 Appling St | 0.20mi | 2/1.0 (-1) | 840 (-10%) | 23mo | $98,000 | $117 | 49 |
| 2939 Pennsylvania Ave | 0.63mi | 2/1.0 (-1) | 1,072 (+14%) | 11mo | $135,000 | $126 | 32 |
Match score weights: distance 35% · size 25% · config 20% · recency 20%. Top-matched comps best support the ARV.
Projected returns pro-forma
-3.0% appreciation · 5.13% rent growth · sell at horizon
- IRR
- -3.8%
- Equity multiple
- 0.86×
- Total profit
- $-5,640
- Equity at exit
- $20,860
- IRR
- 7.9%
- Equity multiple
- 1.65×
- Total profit
- $25,494
- Equity at exit
- $12,096
Cash invested: $39,172 (down + closing). Projections, not guarantees.
Landlord ↔ Tenant lean methodology
- Overall (STATE)
- 87 Strongly Landlord-Friendly
- State Tennessee
- 87 Strongly Landlord-Friendly · R+13
- County
- — inherits STATE
- City
- — inherits STATE
ZIP-level market 37406
- Home prices YoY
- -23.8%
- Rents YoY
- 5.1%
- Active inventory
- 130
- Price-to-rent
- 8.8×
Monthly cashflow live
- Estimated rent
- $1,321 high interval (Pro) →
- Mortgage (P&I)
- −$734
- Tax from tax record
- −$29 /mo · $345/yr
- Insurance
- −$58
- HOA
- −$0
- Vacancy / Maint / Mgmt
- −$277
- Net cashflow
- $223
Break-even live
Sensitivity live
| Price | -10% $302 | -5% $263 | +0% $223 | +5% $183 | +10% $144 |
|---|---|---|---|---|---|
| Rent | -10% $119 | -5% $171 | +0% $223 | +5% $275 | +10% $327 |
| Rate | -1.0pp $294 | -0.5pp $259 | base $223 | +0.5pp $187 | +1.0pp $150 |
UW: 25.0% down · 7.5% · 30yr · 1.5% tax · 5.0% vac · 8.0% maint · 8.0% mgmt
Financing live
Cash to close
- Down payment
- $34,975
- Closing costs
- $4,197
- Reserves months
- —
- Total cash needed
- —
Loan-product check · same deal, 3 products live
Conventional
25% down · 7.5% · 30yr
- Down + closing
- —
- Monthly P&I
- —
- Monthly cashflow
- —
- DSCR
- —
- Eligible?
- —
Personal DTI + credit; lowest rate.
DSCR
20% down · 8.5% · 30yr
- Down + closing
- —
- Monthly P&I
- —
- Monthly cashflow
- —
- DSCR
- —
- Eligible?
- —
No personal income docs; deal must DSCR.
Hard money
10% down · 12.0% · 12mo
- Down + closing
- —
- Monthly P&I
- —
- Monthly cashflow
- —
- DSCR
- —
- Eligible?
- —
Short-term bridge; refi at stabilization.
Rent comps 14 comps
| Address | Beds | Baths | Sqft | Rent | $/sqft | DOM | Units | Dist |
|---|---|---|---|---|---|---|---|---|
| 2512 Boone St Chattanooga, TN | 3.0 | 1.0 | 1060 | $1,150 | $1.08 | 15d | 1 | 0.08mi |
| 2405 Harley St Chattanooga, TN | 2.0 | 1.0 | 700 | $1,199 | $1.71 | 15d | 1 | 0.12mi |
| 2603 Dodson Ave Chattanooga, TN | 4.0 | 1.0 | 1104 | $1,250 | $1.13 | 22d | 1 | 0.34mi |
| 2305 Glass St Chattanooga, TN | 2.0 | 1.0 | 738 | $1,050 | $1.42 | 25d | 1 | 0.36mi |
| 2400 Crutchfield St Chattanooga, TN | 3.0 | 1.0 | 984 | $1,200 | $1.22 | 22d | 1 | 0.37mi |
| 2829 New Jersey Ave Chattanooga, TN | 3.0 | 2.0 | 1120 | $1,295 | $1.16 | 15d | 1 | 0.63mi |
| 2215 Allin St Unit A Chattanooga, TN | 2.0 | 1.0 | 700 | $899 | $1.28 | 25d | 1 | 0.64mi |
| 1707 Arlington Ave Unit B Chattanooga, TN | 2.0 | 1.0 | 760 | $1,000 | $1.32 | 25d | 1 | 0.99mi |
| 2113 Ocoee St Unit 2113 Chattanooga, TN | 2.0 | 1.0 | 780 | $950 | $1.22 | 25d | 1 | 1.05mi |
| 1754 Ocoee St Chattanooga, TN | 3.0 | 1.5 | 1050 | $1,250 | $1.19 | 15d | 1 | 1.23mi |
| 1409 Bradt St Chattanooga, TN | 3.0 | 1.0 | 960 | $1,275 | $1.33 | 25d | 1 | 1.25mi |
| 1237 Wheeler Ave Unit B Chattanooga, TN | 2.0 | 1.0 | 845 | $1,125 | $1.33 | 25d | 1 | 1.37mi |
| 1310 Roanoke Ave Chattanooga, TN | 2.0 | 1.0 | 792 | $1,350 | $1.70 | 25d | 1 | 1.38mi |
| 1301 N Orchard Knob Ave Chattanooga, TN | 2.0 | 1.0 | 864 | $1,095 | $1.27 | 25d | 1 | 1.45mi |
Listing history 23 events
-
2026-06-22days on market $139,900 Active 18 DOM
-
2026-06-18days on market $139,900 Active 15 DOM
-
2026-06-17days on market $139,900 Active 14 DOM
-
2026-06-16days on market $139,900 Active 13 DOM
-
2026-06-15days on market $139,900 Active 12 DOM
-
2026-06-14pricedays on market $139,900 Active 10 DOM
-
2026-06-10days on market $154,900 Active 7 DOM
-
2026-06-09days on market $154,900 Active 6 DOM
-
2026-06-08days on market $154,900 Active 5 DOM
-
2026-06-07days on market $154,900 Active 4 DOM
-
2026-06-03days on market $154,900 Active 1 DOM
-
2026-06-02days on market $154,900 Active 63 DOM
-
2026-06-01days on market $154,900 Active 62 DOM
-
2026-05-31days on market $154,900 Active 61 DOM
-
2026-05-30days on market $154,900 Active 60 DOM
-
2026-03-31$154,900 Active 408-char remark
Show marketing remark (408 chars)
ATTENTION INVESTORS or HOMEOWNERS!! Fantastic opportunity in one of Chattanooga's up-and-coming neighborhood's. Located just minutes from downtown shopping and dining. This single level home is move-in-ready! Roof is only a couple years old and HVAC is new. Property is being sold as-is, but is in livable condition. This is a great opportunity to add to your investment portfolio or settle in your new home!
-
2026-03-31$154,900 Active
Show marketing remark (408 chars)
ATTENTION INVESTORS or HOMEOWNERS!! Fantastic opportunity in one of Chattanooga's up-and-coming neighborhood's. Located just minutes from downtown shopping and dining. This single level home is move-in-ready! Roof is only a couple years old and HVAC is new. Property is being sold as-is, but is in livable condition. This is a great opportunity to add to your investment portfolio or settle in your new home!
-
2006-09-29$55,000
-
2005-05-01$50,000
-
2001-07-31soldstatus $42,000
-
2001-07-31soldstatus $42,000
-
2000-11-25$49,500
-
2000-07-17$55,000
ⓘ Source: listings_history table (triggers on properties + properties_extension) + one-shot
backfill from property_details.listing_events for pre-trigger history.
Tax reassessment forecast TN · Resets to sale price
- Current annual tax
- $345 · $29/mo
- Projected year-2 tax
- $993 · $83/mo
- Expected delta
- +$648/yr (+$54/mo · 188.1%)
ⓘ Screening estimate from a state-policy table — verify with the county assessor before closing.
Climate risk First Street
- Flood 1/10 Low FEMA zone X (unshaded) · 0% chance over 30 yrs
- Wildfire 2/10 Low
- Heat 6/10 Major 7 d/yr ≥105°F today · 19 d/yr by 30 yrs out
- Wind 4/10 Moderate 10% chance of damaging wind over 30 yrs
- Air quality 3/10 Moderate 2 unhealthy d/yr today · 2 by 30 yrs out
Nearby sold comps map
Loading sold comps map…
Walkable amenities ~0.75 mi
Loading nearby amenities…
Taxation est. · year 1
- Rental income
- $15,855
- − Mortgage interest
- −$7,837
- − Property taxes
- −$345
- − Insurance
- −$700
- − Repairs & maintenance
- −$1,268
- − Management
- −$1,268
- − Depreciation
- −$4,070
- Taxable income
- $367
- Est. tax owed @ 24.0%
- −$88
- After-tax cash flow
- $2,589/yr
For passive investors: Depreciation is non-cash, so a rental often shows a tax loss while cash-flowing — sheltering income. Rental losses are passive: they offset passive income freely, and up to $25,000/yr can offset ordinary (W-2) income if you actively participate and your MAGI is under $100k (phasing out to $0 by $150k); unused losses carry forward. On sale, claimed depreciation is recaptured at up to 25%, and gains may owe capital-gains tax (a 1031 exchange can defer both). Figures are a year-1 estimate at your 24.0% rate — not tax advice; consult a CPA.
Schools (NCES district)
- District
- Hamilton County
- NCES district ID
- 4701590
- Math proficiency
- 31% ▼ -10.00%
- Reading proficiency
- 31% ▼ -3.00%
- Median HH income
- $47,456
- Composite
- 26.8/100
- National rank
- #7122
- State rank
- #42 of 139 in TN
Livability — Chattanooga
- Score
- 78/100
- State rank
- #3
- US rank
- #2582
Category grades
Schools grade is shown separately in the Schools card above.
Census & demographics
- Census place
- Chattanooga, TN
- County
- Hamilton County · 312,777 people
- City population
- 131,999
- Metro
- Chattanooga, TN-GA
- Population (ZIP)
- 13,364
- Household income
- $44,850
- Rent vs Own
- Severe rent burden
- 759.0
Population outlook (Hamilton County) Hauer SSP2
- Today (2025)
- 393,784 people
- By 2030
- 412,983 · +4.9%
- By 2040
- 449,502 · +14.1%
- By 2050
- 484,341 · +23.0%
- By 2075
- 565,746 · +43.7%
- By 2100
- 618,394 · +57.0%
Race, ethnicity, and origin ACS 2023
- Neighborhood character
- Predominantly Black (70%)
- Race & ethnicity
- Black 70% White 21% Hispanic / Latino 6% Two or more races 5%
- Hispanic origin (detail)
- Puerto Rican 1%
- Common ancestry
- Italian 1% Slovak 1%
- Foreign-born
- 5% · Canada
- Languages at home
- 92% English-only · Spanish 6% Other Indo-European 1%
Political lean MEDSL · Hamilton
- 2024 margin
- R (+13.1) · D 42.7% · R 55.7% · Other 1.6%
- 2008→2024 swing
- -1.2pp toward R · 2008: -11.8pp · 2024: -13.1pp
- All cycles
- 2024: R+13.1 2020: R+9.7 2016: R+16.6 2012: R+14.8 2008: R+11.8
Not yet ingested
- Civics
- —
Market trends
- HPI YoY
- ▼ -63.73%
- Current HPI
- 203.5858
- Rent YoY
- ▲ 5.13%
- Metro
- Chattanooga, TN-GA
- State GDP YoY
- ▲ 2.78%
- F500 in state
- 22
Industry mix (Fortune 500 HQ in TN)
| Industry | F500 HQs | Revenue |
|---|---|---|
| Healthcare | 3 | $91B |
|
||
| Retail | 3 | $72B |
|
||
| Transportation / Logistics | 1 | $88B |
|
||
| Paper / Packaging | 1 | $19B |
|
||
| Insurance | 1 | $13B |
|
||
| Energy | 1 | $12B |
|
||
Price history
+181.6% since first listed8 events — show timeline
- 2026-03-31 Listed $154,900 GCAR
- 2026-03-31 Listed $154,900 RCAOR
- 2006-09-29 Listed $55,000 RCAOR
- 2005-05-01 Listed $50,000 RCAOR
- 2001-07-31 Sold (Public Records) $42,000 Public Records
- 2001-07-31 Sold (MLS) $42,000 GCAR
- 2000-11-25 Listed $49,500 GCAR
- 2000-07-17 Listed $55,000 RCAOR
Property tax history
+4.0%/yrLatest (2025): $345 · +37.6% YoY. Source: county tax records.
Cash-flow waterfall
monthlySold comps — $/sqft
last 12 mo · ≤1 miLoading sold comps…